Bullish Cassiopeia C Harmonic Patterns [theEccentricTrader]█ OVERVIEW
This indicator automatically detects and draws bullish Cassiopeia C harmonic patterns and price projections derived from the ranges that constitute the patterns.
Cassiopeia A, B and C harmonic patterns are patterns that I created/discovered myself. They are all inspired by the Cassiopeia constellation and each one is based on different rotations of the constellation as it moves through the sky. The range ratios are also based on the constellation's right ascension and declination listed on Wikipedia:
Right ascension 22h 57m 04.5897s–03h 41m 14.0997s
Declination 77.6923447°–48.6632690°
en.wikipedia.org
I actually developed this idea quite a while ago now but have not felt audacious enough to introduce a new harmonic pattern, let alone 3 at the same time! But I have since been able to run backtests on tick data going back to 2002 across a variety of market and timeframe combinations and have learned that the Cassiopeia patterns can certainly hold their own against the currently known harmonic patterns.
I would also point out that the Cassiopeia constellation does actually look like a harmonic pattern and the Cassiopeia A star is literally the 'strongest source of radio emission in the sky beyond the solar system', so its arguably more of a real harmonic phenomenon than the current patterns.
www.britannica.com
chandra.si.edu
█ CONCEPTS
Green and Red Candles
• A green candle is one that closes with a close price equal to or above the price it opened.
• A red candle is one that closes with a close price that is lower than the price it opened.
Swing Highs and Swing Lows
• A swing high is a green candle or series of consecutive green candles followed by a single red candle to complete the swing and form the peak.
• A swing low is a red candle or series of consecutive red candles followed by a single green candle to complete the swing and form the trough.
Peak and Trough Prices (Basic)
• The peak price of a complete swing high is the high price of either the red candle that completes the swing high or the high price of the preceding green candle, depending on which is higher.
• The trough price of a complete swing low is the low price of either the green candle that completes the swing low or the low price of the preceding red candle, depending on which is lower.
Historic Peaks and Troughs
The current, or most recent, peak and trough occurrences are referred to as occurrence zero. Previous peak and trough occurrences are referred to as historic and ordered numerically from right to left, with the most recent historic peak and trough occurrences being occurrence one.
Range
The range is simply the difference between the current peak and current trough prices, generally expressed in terms of points or pips.
Upper Trends
• A return line uptrend is formed when the current peak price is higher than the preceding peak price.
• A downtrend is formed when the current peak price is lower than the preceding peak price.
• A double-top is formed when the current peak price is equal to the preceding peak price.
Lower Trends
• An uptrend is formed when the current trough price is higher than the preceding trough price.
• A return line downtrend is formed when the current trough price is lower than the preceding trough price.
• A double-bottom is formed when the current trough price is equal to the preceding trough price.
Muti-Part Upper and Lower Trends
• A multi-part return line uptrend begins with the formation of a new return line uptrend and continues until a new downtrend ends the trend.
• A multi-part downtrend begins with the formation of a new downtrend and continues until a new return line uptrend ends the trend.
• A multi-part uptrend begins with the formation of a new uptrend and continues until a new return line downtrend ends the trend.
• A multi-part return line downtrend begins with the formation of a new return line downtrend and continues until a new uptrend ends the trend.
Double Trends
• A double uptrend is formed when the current trough price is higher than the preceding trough price and the current peak price is higher than the preceding peak price.
• A double downtrend is formed when the current peak price is lower than the preceding peak price and the current trough price is lower than the preceding trough price.
Muti-Part Double Trends
• A multi-part double uptrend begins with the formation of a new uptrend that proceeds a new return line uptrend, and continues until a new downtrend or return line downtrend ends the trend.
• A multi-part double downtrend begins with the formation of a new downtrend that proceeds a new return line downtrend, and continues until a new uptrend or return line uptrend ends the trend.
Wave Cycles
A wave cycle is here defined as a complete two-part move between a swing high and a swing low, or a swing low and a swing high. The first swing high or swing low will set the course for the sequence of wave cycles that follow; for example a chart that begins with a swing low will form its first complete wave cycle upon the formation of the first complete swing high and vice versa.
Figure 1.
Retracement and Extension Ratios
Retracement and extension ratios are calculated by dividing the current range by the preceding range and multiplying the answer by 100. Retracement ratios are those that are equal to or below 100% of the preceding range and extension ratios are those that are above 100% of the preceding range.
Fibonacci Retracement and Extension Ratios
The Fibonacci sequence is a series of numbers in which each number is the sum of the two preceding numbers, starting with 0 and 1. For example 0 + 1 = 1, 1 + 1 = 2, 1 + 2 = 3, and so on. Ultimately, we could go on forever but the first few numbers in the sequence are as follows: 0 , 1, 1, 2, 3, 5, 8, 13, 21, 34, 55, 89, 144.
The extension ratios are calculated by dividing each number in the sequence by the number preceding it. For example 0/1 = 0, 1/1 = 1, 2/1 = 2, 3/2 = 1.5, 5/3 = 1.6666..., 8/5 = 1.6, 13/8 = 1.625, 21/13 = 1.6153..., 34/21 = 1.6190..., 55/34 = 1.6176..., 89/55 = 1.6181..., 144/89 = 1.6179..., and so on. The retracement ratios are calculated by inverting this process and dividing each number in the sequence by the number proceeding it. For example 0/1 = 0, 1/1 = 1, 1/2 = 0.5, 2/3 = 0.666..., 3/5 = 0.6, 5/8 = 0.625, 8/13 = 0.6153..., 13/21 = 0.6190..., 21/34 = 0.6176..., 34/55 = 0.6181..., 55/89 = 0.6179..., 89/144 = 0.6180..., and so on.
1.618 is considered to be the 'golden ratio', found in many natural phenomena such as the growth of seashells and the branching of trees. Some now speculate the universe oscillates at a frequency of 0,618 Hz, which could help to explain such phenomena, but this theory has yet to be proven.
Traders and analysts use Fibonacci retracement and extension indicators, consisting of horizontal lines representing different Fibonacci ratios, for identifying potential levels of support and resistance. Fibonacci ranges are typically drawn from left to right, with retracement levels representing ratios inside of the current range and extension levels representing ratios extended outside of the current range. If the current wave cycle ends on a swing low, the Fibonacci range is drawn from peak to trough. If the current wave cycle ends on a swing high the Fibonacci range is drawn from trough to peak.
Harmonic Patterns
The concept of harmonic patterns in trading was first introduced by H.M. Gartley in his book "Profits in the Stock Market", published in 1935. Gartley observed that markets have a tendency to move in repetitive patterns, and he identified several specific patterns that he believed could be used to predict future price movements.
Since then, many other traders and analysts have built upon Gartley's work and developed their own variations of harmonic patterns. One such contributor is Larry Pesavento, who developed his own methods for measuring harmonic patterns using Fibonacci ratios. Pesavento has written several books on the subject of harmonic patterns and Fibonacci ratios in trading. Another notable contributor to harmonic patterns is Scott Carney, who developed his own approach to harmonic trading in the late 1990s and also popularised the use of Fibonacci ratios to measure harmonic patterns. Carney expanded on Gartley's work and also introduced several new harmonic patterns, such as the Shark pattern and the 5-0 pattern.
The bullish and bearish Gartley patterns are the oldest recognized harmonic patterns in trading and all the other harmonic patterns are ultimately modifications of the original Gartley patterns. Gartley patterns are fundamentally composed of 5 points, or 4 waves.
Bullish and Bearish Cassiopeia C Harmonic Patterns
• Bullish Cassiopeia C patterns are fundamentally composed of three troughs and two peaks. The second peak being higher than the first peak. And the third trough being lower than both the first and second troughs, while the second trough is higher than the first.
• Bearish Cassiopeia C patterns are fundamentally composed of three peaks and two troughs. The second trough being lower than the first trough. And the third peak being higher than both the first and second peaks, while the second peak is lower than the first.
The ratio measurements I use to detect the patterns are as follows:
• Wave 1 of the pattern, generally referred to as XA, has no specific ratio requirements.
• Wave 2 of the pattern, generally referred to as AB, should retrace by at least 11.34%, but no further than 22.31% of the range set by wave 1.
• Wave 3 of the pattern, generally referred to as BC, should extend by at least 225.7%, but no further than 341% of the range set by wave 2.
• Wave 4 of the pattern, generally referred to as CD, should retrace by at least 77.69%, but no further than 88.66% of the range set by wave 3.
Measurement Tolerances
In general, tolerance in measurements refers to the allowable variation or deviation from a specific value or dimension. It is the range within which a particular measurement is considered to be acceptable or accurate. In this script I have applied this concept to the measurement of harmonic pattern ratios to increase to the frequency of pattern occurrences.
For example, the AB measurement of Gartley patterns is generally set at around 61.8%, but with such specificity in the measuring requirements the patterns are very rare. We can increase the frequency of pattern occurrences by setting a tolerance. A tolerance of 10% to both downside and upside, which is the default setting for all tolerances, means we would have a tolerable measurement range between 51.8-71.8%, thus increasing the frequency of occurrence.
█ FEATURES
Inputs
• AB Lower Tolerance
• AB Upper Tolerance
• BC Lower Tolerance
• BC Upper Tolerance
• CD Lower Tolerance
• CD Upper Tolerance
• Pattern Color
• Label Color
• Show Projections
• Extend Current Projection Lines
Alerts
Users can set alerts for when the patterns occur.
█ LIMITATIONS
All green and red candle calculations are based on differences between open and close prices, as such I have made no attempt to account for green candles that gap lower and close below the close price of the preceding candle, or red candles that gap higher and close above the close price of the preceding candle. This may cause some unexpected behaviour on some markets and timeframes. I can only recommend using 24-hour markets, if and where possible, as there are far fewer gaps and, generally, more data to work with.
█ NOTES
I know a few people have been requesting a single indicator that contains all my patterns and I definitely hear you on that one. However, I have been very busy working on other projects while trying to trade and be a human at the same time. For now I am going to maintain my original approach of releasing each pattern individually so as to maintain consistency. But I am now also working on getting my some of my libraries ready for public release and in doing so I will finally be able to fit all patterns into one script. I will also be giving my scripts some TLC by making them cleaner once I have the libraries up and running. Please bear with me in the meantime, this may take a while. Cheers!
Cari dalam skrip untuk "wave"

Bearish Cassiopeia B Harmonic Patterns [theEccentricTrader]█ OVERVIEW
This indicator automatically detects and draws bearish Cassiopeia B harmonic patterns and price projections derived from the ranges that constitute the patterns.
Cassiopeia A, B and C harmonic patterns are patterns that I created/discovered myself. They are all inspired by the Cassiopeia constellation and each one is based on different rotations of the constellation as it moves through the sky. The range ratios are also based on the constellation's right ascension and declination listed on Wikipedia:
Right ascension 22h 57m 04.5897s–03h 41m 14.0997s
Declination 77.6923447°–48.6632690°
en.wikipedia.org
I actually developed this idea quite a while ago now but have not felt audacious enough to introduce a new harmonic pattern, let alone 3 at the same time! But I have since been able to run backtests on tick data going back to 2002 across a variety of market and timeframe combinations and have learned that the Cassiopeia patterns can certainly hold their own against the currently known harmonic patterns.
I would also point out that the Cassiopeia constellation does actually look like a harmonic pattern and the Cassiopeia A star is literally the 'strongest source of radio emission in the sky beyond the solar system', so its arguably more of a real harmonic phenomenon than the current patterns.
www.britannica.com
chandra.si.edu
█ CONCEPTS
Green and Red Candles
• A green candle is one that closes with a close price equal to or above the price it opened.
• A red candle is one that closes with a close price that is lower than the price it opened.
Swing Highs and Swing Lows
• A swing high is a green candle or series of consecutive green candles followed by a single red candle to complete the swing and form the peak.
• A swing low is a red candle or series of consecutive red candles followed by a single green candle to complete the swing and form the trough.
Peak and Trough Prices (Basic)
• The peak price of a complete swing high is the high price of either the red candle that completes the swing high or the high price of the preceding green candle, depending on which is higher.
• The trough price of a complete swing low is the low price of either the green candle that completes the swing low or the low price of the preceding red candle, depending on which is lower.
Historic Peaks and Troughs
The current, or most recent, peak and trough occurrences are referred to as occurrence zero. Previous peak and trough occurrences are referred to as historic and ordered numerically from right to left, with the most recent historic peak and trough occurrences being occurrence one.
Range
The range is simply the difference between the current peak and current trough prices, generally expressed in terms of points or pips.
Upper Trends
• A return line uptrend is formed when the current peak price is higher than the preceding peak price.
• A downtrend is formed when the current peak price is lower than the preceding peak price.
• A double-top is formed when the current peak price is equal to the preceding peak price.
Lower Trends
• An uptrend is formed when the current trough price is higher than the preceding trough price.
• A return line downtrend is formed when the current trough price is lower than the preceding trough price.
• A double-bottom is formed when the current trough price is equal to the preceding trough price.
Muti-Part Upper and Lower Trends
• A multi-part return line uptrend begins with the formation of a new return line uptrend and continues until a new downtrend ends the trend.
• A multi-part downtrend begins with the formation of a new downtrend and continues until a new return line uptrend ends the trend.
• A multi-part uptrend begins with the formation of a new uptrend and continues until a new return line downtrend ends the trend.
• A multi-part return line downtrend begins with the formation of a new return line downtrend and continues until a new uptrend ends the trend.
Double Trends
• A double uptrend is formed when the current trough price is higher than the preceding trough price and the current peak price is higher than the preceding peak price.
• A double downtrend is formed when the current peak price is lower than the preceding peak price and the current trough price is lower than the preceding trough price.
Muti-Part Double Trends
• A multi-part double uptrend begins with the formation of a new uptrend that proceeds a new return line uptrend, and continues until a new downtrend or return line downtrend ends the trend.
• A multi-part double downtrend begins with the formation of a new downtrend that proceeds a new return line downtrend, and continues until a new uptrend or return line uptrend ends the trend.
Wave Cycles
A wave cycle is here defined as a complete two-part move between a swing high and a swing low, or a swing low and a swing high. The first swing high or swing low will set the course for the sequence of wave cycles that follow; for example a chart that begins with a swing low will form its first complete wave cycle upon the formation of the first complete swing high and vice versa.
Figure 1.
Retracement and Extension Ratios
Retracement and extension ratios are calculated by dividing the current range by the preceding range and multiplying the answer by 100. Retracement ratios are those that are equal to or below 100% of the preceding range and extension ratios are those that are above 100% of the preceding range.
Fibonacci Retracement and Extension Ratios
The Fibonacci sequence is a series of numbers in which each number is the sum of the two preceding numbers, starting with 0 and 1. For example 0 + 1 = 1, 1 + 1 = 2, 1 + 2 = 3, and so on. Ultimately, we could go on forever but the first few numbers in the sequence are as follows: 0 , 1, 1, 2, 3, 5, 8, 13, 21, 34, 55, 89, 144.
The extension ratios are calculated by dividing each number in the sequence by the number preceding it. For example 0/1 = 0, 1/1 = 1, 2/1 = 2, 3/2 = 1.5, 5/3 = 1.6666..., 8/5 = 1.6, 13/8 = 1.625, 21/13 = 1.6153..., 34/21 = 1.6190..., 55/34 = 1.6176..., 89/55 = 1.6181..., 144/89 = 1.6179..., and so on. The retracement ratios are calculated by inverting this process and dividing each number in the sequence by the number proceeding it. For example 0/1 = 0, 1/1 = 1, 1/2 = 0.5, 2/3 = 0.666..., 3/5 = 0.6, 5/8 = 0.625, 8/13 = 0.6153..., 13/21 = 0.6190..., 21/34 = 0.6176..., 34/55 = 0.6181..., 55/89 = 0.6179..., 89/144 = 0.6180..., and so on.
1.618 is considered to be the 'golden ratio', found in many natural phenomena such as the growth of seashells and the branching of trees. Some now speculate the universe oscillates at a frequency of 0,618 Hz, which could help to explain such phenomena, but this theory has yet to be proven.
Traders and analysts use Fibonacci retracement and extension indicators, consisting of horizontal lines representing different Fibonacci ratios, for identifying potential levels of support and resistance. Fibonacci ranges are typically drawn from left to right, with retracement levels representing ratios inside of the current range and extension levels representing ratios extended outside of the current range. If the current wave cycle ends on a swing low, the Fibonacci range is drawn from peak to trough. If the current wave cycle ends on a swing high the Fibonacci range is drawn from trough to peak.
Harmonic Patterns
The concept of harmonic patterns in trading was first introduced by H.M. Gartley in his book "Profits in the Stock Market", published in 1935. Gartley observed that markets have a tendency to move in repetitive patterns, and he identified several specific patterns that he believed could be used to predict future price movements.
Since then, many other traders and analysts have built upon Gartley's work and developed their own variations of harmonic patterns. One such contributor is Larry Pesavento, who developed his own methods for measuring harmonic patterns using Fibonacci ratios. Pesavento has written several books on the subject of harmonic patterns and Fibonacci ratios in trading. Another notable contributor to harmonic patterns is Scott Carney, who developed his own approach to harmonic trading in the late 1990s and also popularised the use of Fibonacci ratios to measure harmonic patterns. Carney expanded on Gartley's work and also introduced several new harmonic patterns, such as the Shark pattern and the 5-0 pattern.
The bullish and bearish Gartley patterns are the oldest recognized harmonic patterns in trading and all the other harmonic patterns are ultimately modifications of the original Gartley patterns. Gartley patterns are fundamentally composed of 5 points, or 4 waves.
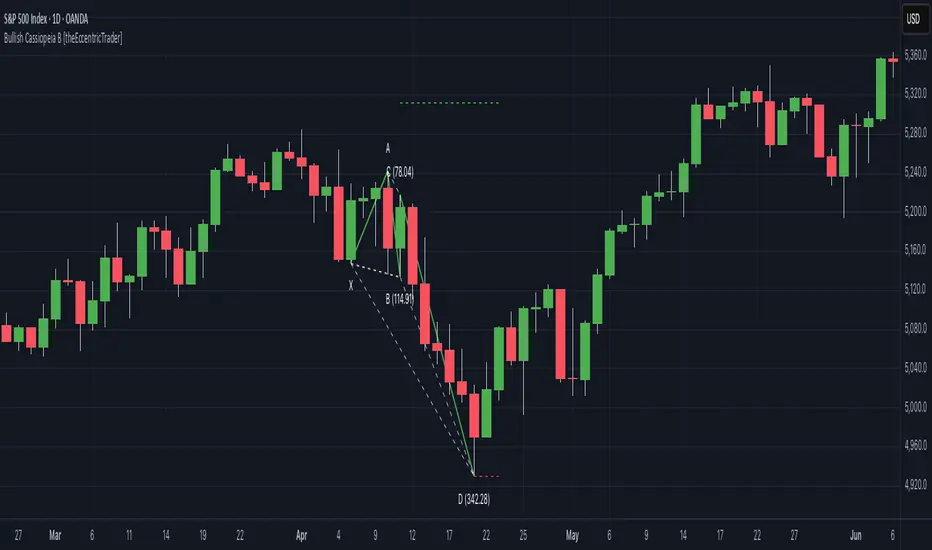
Bullish and Bearish Cassiopeia B Harmonic Patterns
• Bullish Cassiopeia B patterns are fundamentally composed of three troughs and two peaks. The second peak being lower than the first peak. And the third trough being lower than both the first and second troughs, while the second trough is also lower than the first.
• Bearish Cassiopeia B patterns are fundamentally composed of three peaks and two troughs. The second trough being higher than the first trough. And the third peak being higher than both the first and second peaks, while the second peak is also higher than the first.
The ratio measurements I use to detect the patterns are as follows:
• Wave 1 of the pattern, generally referred to as XA, has no specific ratio requirements.
• Wave 2 of the pattern, generally referred to as AB, should retrace by at least 11.34%, but no further than 22.31% of the range set by wave 1.
• Wave 3 of the pattern, generally referred to as BC, should extend by at least 225.7%, but no further than 341% of the range set by wave 2.
• Wave 4 of the pattern, generally referred to as CD, should retrace by at least 77.69%, but no further than 88.66% of the range set by wave 3.
Measurement Tolerances
In general, tolerance in measurements refers to the allowable variation or deviation from a specific value or dimension. It is the range within which a particular measurement is considered to be acceptable or accurate. In this script I have applied this concept to the measurement of harmonic pattern ratios to increase to the frequency of pattern occurrences.
For example, the AB measurement of Gartley patterns is generally set at around 61.8%, but with such specificity in the measuring requirements the patterns are very rare. We can increase the frequency of pattern occurrences by setting a tolerance. A tolerance of 10% to both downside and upside, which is the default setting for all tolerances, means we would have a tolerable measurement range between 51.8-71.8%, thus increasing the frequency of occurrence.
█ FEATURES
Inputs
• AB Lower Tolerance
• AB Upper Tolerance
• BC Lower Tolerance
• BC Upper Tolerance
• CD Lower Tolerance
• CD Upper Tolerance
• Pattern Color
• Label Color
• Show Projections
• Extend Current Projection Lines
Alerts
Users can set alerts for when the patterns occur.
█ LIMITATIONS
All green and red candle calculations are based on differences between open and close prices, as such I have made no attempt to account for green candles that gap lower and close below the close price of the preceding candle, or red candles that gap higher and close above the close price of the preceding candle. This may cause some unexpected behaviour on some markets and timeframes. I can only recommend using 24-hour markets, if and where possible, as there are far fewer gaps and, generally, more data to work with.
█ NOTES
I know a few people have been requesting a single indicator that contains all my patterns and I definitely hear you on that one. However, I have been very busy working on other projects while trying to trade and be a human at the same time. For now I am going to maintain my original approach of releasing each pattern individually so as to maintain consistency. But I am now also working on getting my some of my libraries ready for public release and in doing so I will finally be able to fit all patterns into one script. I will also be giving my scripts some TLC by making them cleaner once I have the libraries up and running. Please bear with me in the meantime, this may take a while. Cheers!

Bullish Cassiopeia B Harmonic Patterns [theEccentricTrader]█ OVERVIEW
This indicator automatically detects and draws bullish Cassiopeia B harmonic patterns and price projections derived from the ranges that constitute the patterns.
Cassiopeia A, B and C harmonic patterns are patterns that I created/discovered myself. They are all inspired by the Cassiopeia constellation and each one is based on different rotations of the constellation as it moves through the sky. The range ratios are also based on the constellation's right ascension and declination listed on Wikipedia:
Right ascension 22h 57m 04.5897s–03h 41m 14.0997s
Declination 77.6923447°–48.6632690°
en.wikipedia.org
I actually developed this idea quite a while ago now but have not felt audacious enough to introduce a new harmonic pattern, let alone 3 at the same time! But I have since been able to run backtests on tick data going back to 2002 across a variety of market and timeframe combinations and have learned that the Cassiopeia patterns can certainly hold their own against the currently known harmonic patterns.
I would also point out that the Cassiopeia constellation does actually look like a harmonic pattern and the Cassiopeia A star is literally the 'strongest source of radio emission in the sky beyond the solar system', so its arguably more of a real harmonic phenomenon than the current patterns.
www.britannica.com
chandra.si.edu
█ CONCEPTS
Green and Red Candles
• A green candle is one that closes with a close price equal to or above the price it opened.
• A red candle is one that closes with a close price that is lower than the price it opened.
Swing Highs and Swing Lows
• A swing high is a green candle or series of consecutive green candles followed by a single red candle to complete the swing and form the peak.
• A swing low is a red candle or series of consecutive red candles followed by a single green candle to complete the swing and form the trough.
Peak and Trough Prices (Basic)
• The peak price of a complete swing high is the high price of either the red candle that completes the swing high or the high price of the preceding green candle, depending on which is higher.
• The trough price of a complete swing low is the low price of either the green candle that completes the swing low or the low price of the preceding red candle, depending on which is lower.
Historic Peaks and Troughs
The current, or most recent, peak and trough occurrences are referred to as occurrence zero. Previous peak and trough occurrences are referred to as historic and ordered numerically from right to left, with the most recent historic peak and trough occurrences being occurrence one.
Range
The range is simply the difference between the current peak and current trough prices, generally expressed in terms of points or pips.
Upper Trends
• A return line uptrend is formed when the current peak price is higher than the preceding peak price.
• A downtrend is formed when the current peak price is lower than the preceding peak price.
• A double-top is formed when the current peak price is equal to the preceding peak price.
Lower Trends
• An uptrend is formed when the current trough price is higher than the preceding trough price.
• A return line downtrend is formed when the current trough price is lower than the preceding trough price.
• A double-bottom is formed when the current trough price is equal to the preceding trough price.
Muti-Part Upper and Lower Trends
• A multi-part return line uptrend begins with the formation of a new return line uptrend and continues until a new downtrend ends the trend.
• A multi-part downtrend begins with the formation of a new downtrend and continues until a new return line uptrend ends the trend.
• A multi-part uptrend begins with the formation of a new uptrend and continues until a new return line downtrend ends the trend.
• A multi-part return line downtrend begins with the formation of a new return line downtrend and continues until a new uptrend ends the trend.
Double Trends
• A double uptrend is formed when the current trough price is higher than the preceding trough price and the current peak price is higher than the preceding peak price.
• A double downtrend is formed when the current peak price is lower than the preceding peak price and the current trough price is lower than the preceding trough price.
Muti-Part Double Trends
• A multi-part double uptrend begins with the formation of a new uptrend that proceeds a new return line uptrend, and continues until a new downtrend or return line downtrend ends the trend.
• A multi-part double downtrend begins with the formation of a new downtrend that proceeds a new return line downtrend, and continues until a new uptrend or return line uptrend ends the trend.
Wave Cycles
A wave cycle is here defined as a complete two-part move between a swing high and a swing low, or a swing low and a swing high. The first swing high or swing low will set the course for the sequence of wave cycles that follow; for example a chart that begins with a swing low will form its first complete wave cycle upon the formation of the first complete swing high and vice versa.
Figure 1.
Retracement and Extension Ratios
Retracement and extension ratios are calculated by dividing the current range by the preceding range and multiplying the answer by 100. Retracement ratios are those that are equal to or below 100% of the preceding range and extension ratios are those that are above 100% of the preceding range.
Fibonacci Retracement and Extension Ratios
The Fibonacci sequence is a series of numbers in which each number is the sum of the two preceding numbers, starting with 0 and 1. For example 0 + 1 = 1, 1 + 1 = 2, 1 + 2 = 3, and so on. Ultimately, we could go on forever but the first few numbers in the sequence are as follows: 0 , 1, 1, 2, 3, 5, 8, 13, 21, 34, 55, 89, 144.
The extension ratios are calculated by dividing each number in the sequence by the number preceding it. For example 0/1 = 0, 1/1 = 1, 2/1 = 2, 3/2 = 1.5, 5/3 = 1.6666..., 8/5 = 1.6, 13/8 = 1.625, 21/13 = 1.6153..., 34/21 = 1.6190..., 55/34 = 1.6176..., 89/55 = 1.6181..., 144/89 = 1.6179..., and so on. The retracement ratios are calculated by inverting this process and dividing each number in the sequence by the number proceeding it. For example 0/1 = 0, 1/1 = 1, 1/2 = 0.5, 2/3 = 0.666..., 3/5 = 0.6, 5/8 = 0.625, 8/13 = 0.6153..., 13/21 = 0.6190..., 21/34 = 0.6176..., 34/55 = 0.6181..., 55/89 = 0.6179..., 89/144 = 0.6180..., and so on.
1.618 is considered to be the 'golden ratio', found in many natural phenomena such as the growth of seashells and the branching of trees. Some now speculate the universe oscillates at a frequency of 0,618 Hz, which could help to explain such phenomena, but this theory has yet to be proven.
Traders and analysts use Fibonacci retracement and extension indicators, consisting of horizontal lines representing different Fibonacci ratios, for identifying potential levels of support and resistance. Fibonacci ranges are typically drawn from left to right, with retracement levels representing ratios inside of the current range and extension levels representing ratios extended outside of the current range. If the current wave cycle ends on a swing low, the Fibonacci range is drawn from peak to trough. If the current wave cycle ends on a swing high the Fibonacci range is drawn from trough to peak.
Harmonic Patterns
The concept of harmonic patterns in trading was first introduced by H.M. Gartley in his book "Profits in the Stock Market", published in 1935. Gartley observed that markets have a tendency to move in repetitive patterns, and he identified several specific patterns that he believed could be used to predict future price movements.
Since then, many other traders and analysts have built upon Gartley's work and developed their own variations of harmonic patterns. One such contributor is Larry Pesavento, who developed his own methods for measuring harmonic patterns using Fibonacci ratios. Pesavento has written several books on the subject of harmonic patterns and Fibonacci ratios in trading. Another notable contributor to harmonic patterns is Scott Carney, who developed his own approach to harmonic trading in the late 1990s and also popularised the use of Fibonacci ratios to measure harmonic patterns. Carney expanded on Gartley's work and also introduced several new harmonic patterns, such as the Shark pattern and the 5-0 pattern.
The bullish and bearish Gartley patterns are the oldest recognized harmonic patterns in trading and all the other harmonic patterns are ultimately modifications of the original Gartley patterns. Gartley patterns are fundamentally composed of 5 points, or 4 waves.
Bullish and Bearish Cassiopeia B Harmonic Patterns
• Bullish Cassiopeia B patterns are fundamentally composed of three troughs and two peaks. The second peak being lower than the first peak. And the third trough being lower than both the first and second troughs, while the second trough is also lower than the first.
• Bearish Cassiopeia B patterns are fundamentally composed of three peaks and two troughs. The second trough being higher than the first trough. And the third peak being higher than both the first and second peaks, while the second peak is also higher than the first.
The ratio measurements I use to detect the patterns are as follows:
• Wave 1 of the pattern, generally referred to as XA, has no specific ratio requirements.
• Wave 2 of the pattern, generally referred to as AB, should retrace by at least 11.34%, but no further than 22.31% of the range set by wave 1.
• Wave 3 of the pattern, generally referred to as BC, should extend by at least 225.7%, but no further than 341% of the range set by wave 2.
• Wave 4 of the pattern, generally referred to as CD, should retrace by at least 77.69%, but no further than 88.66% of the range set by wave 3.
Measurement Tolerances
In general, tolerance in measurements refers to the allowable variation or deviation from a specific value or dimension. It is the range within which a particular measurement is considered to be acceptable or accurate. In this script I have applied this concept to the measurement of harmonic pattern ratios to increase to the frequency of pattern occurrences.
For example, the AB measurement of Gartley patterns is generally set at around 61.8%, but with such specificity in the measuring requirements the patterns are very rare. We can increase the frequency of pattern occurrences by setting a tolerance. A tolerance of 10% to both downside and upside, which is the default setting for all tolerances, means we would have a tolerable measurement range between 51.8-71.8%, thus increasing the frequency of occurrence.
█ FEATURES
Inputs
• AB Lower Tolerance
• AB Upper Tolerance
• BC Lower Tolerance
• BC Upper Tolerance
• CD Lower Tolerance
• CD Upper Tolerance
• Pattern Color
• Label Color
• Show Projections
• Extend Current Projection Lines
Alerts
Users can set alerts for when the patterns occur.
█ LIMITATIONS
All green and red candle calculations are based on differences between open and close prices, as such I have made no attempt to account for green candles that gap lower and close below the close price of the preceding candle, or red candles that gap higher and close above the close price of the preceding candle. This may cause some unexpected behaviour on some markets and timeframes. I can only recommend using 24-hour markets, if and where possible, as there are far fewer gaps and, generally, more data to work with.
█ NOTES
I know a few people have been requesting a single indicator that contains all my patterns and I definitely hear you on that one. However, I have been very busy working on other projects while trying to trade and be a human at the same time. For now I am going to maintain my original approach of releasing each pattern individually so as to maintain consistency. But I am now also working on getting my some of my libraries ready for public release and in doing so I will finally be able to fit all patterns into one script. I will also be giving my scripts some TLC by making them cleaner once I have the libraries up and running. Please bear with me in the meantime, this may take a while. Cheers!
Bearish Cassiopeia A Harmonic Patterns [theEccentricTrader]█ OVERVIEW
This indicator automatically detects and draws bearish Cassiopeia A harmonic patterns and price projections derived from the ranges that constitute the patterns.
Cassiopeia A, B and C harmonic patterns are patterns that I created/discovered myself. They are all inspired by the Cassiopeia constellation and each one is based on different rotations of the constellation as it moves through the sky. The range ratios are also based on the constellation's right ascension and declination listed on Wikipedia:
Right ascension 22h 57m 04.5897s–03h 41m 14.0997s
Declination 77.6923447°–48.6632690°
en.wikipedia.org
I actually developed this idea quite a while ago now but have not felt audacious enough to introduce a new harmonic pattern, let alone 3 at the same time! But I have since been able to run backtests on tick data going back to 2002 across a variety of market and timeframe combinations and have learned that the Cassiopeia patterns can certainly hold their own against the currently known harmonic patterns.
I would also point out that the Cassiopeia constellation does actually look like a harmonic pattern and the Cassiopeia A star is literally the 'strongest source of radio emission in the sky beyond the solar system', so its arguably more of a real harmonic phenomenon than the current patterns.
www.britannica.com
chandra.si.edu
█ CONCEPTS
Green and Red Candles
• A green candle is one that closes with a close price equal to or above the price it opened.
• A red candle is one that closes with a close price that is lower than the price it opened.
Swing Highs and Swing Lows
• A swing high is a green candle or series of consecutive green candles followed by a single red candle to complete the swing and form the peak.
• A swing low is a red candle or series of consecutive red candles followed by a single green candle to complete the swing and form the trough.
Peak and Trough Prices (Basic)
• The peak price of a complete swing high is the high price of either the red candle that completes the swing high or the high price of the preceding green candle, depending on which is higher.
• The trough price of a complete swing low is the low price of either the green candle that completes the swing low or the low price of the preceding red candle, depending on which is lower.
Historic Peaks and Troughs
The current, or most recent, peak and trough occurrences are referred to as occurrence zero. Previous peak and trough occurrences are referred to as historic and ordered numerically from right to left, with the most recent historic peak and trough occurrences being occurrence one.
Range
The range is simply the difference between the current peak and current trough prices, generally expressed in terms of points or pips.
Upper Trends
• A return line uptrend is formed when the current peak price is higher than the preceding peak price.
• A downtrend is formed when the current peak price is lower than the preceding peak price.
• A double-top is formed when the current peak price is equal to the preceding peak price.
Lower Trends
• An uptrend is formed when the current trough price is higher than the preceding trough price.
• A return line downtrend is formed when the current trough price is lower than the preceding trough price.
• A double-bottom is formed when the current trough price is equal to the preceding trough price.
Muti-Part Upper and Lower Trends
• A multi-part return line uptrend begins with the formation of a new return line uptrend and continues until a new downtrend ends the trend.
• A multi-part downtrend begins with the formation of a new downtrend and continues until a new return line uptrend ends the trend.
• A multi-part uptrend begins with the formation of a new uptrend and continues until a new return line downtrend ends the trend.
• A multi-part return line downtrend begins with the formation of a new return line downtrend and continues until a new uptrend ends the trend.
Double Trends
• A double uptrend is formed when the current trough price is higher than the preceding trough price and the current peak price is higher than the preceding peak price.
• A double downtrend is formed when the current peak price is lower than the preceding peak price and the current trough price is lower than the preceding trough price.
Muti-Part Double Trends
• A multi-part double uptrend begins with the formation of a new uptrend that proceeds a new return line uptrend, and continues until a new downtrend or return line downtrend ends the trend.
• A multi-part double downtrend begins with the formation of a new downtrend that proceeds a new return line downtrend, and continues until a new uptrend or return line uptrend ends the trend.
Wave Cycles
A wave cycle is here defined as a complete two-part move between a swing high and a swing low, or a swing low and a swing high. The first swing high or swing low will set the course for the sequence of wave cycles that follow; for example a chart that begins with a swing low will form its first complete wave cycle upon the formation of the first complete swing high and vice versa.
Figure 1.
Retracement and Extension Ratios
Retracement and extension ratios are calculated by dividing the current range by the preceding range and multiplying the answer by 100. Retracement ratios are those that are equal to or below 100% of the preceding range and extension ratios are those that are above 100% of the preceding range.
Fibonacci Retracement and Extension Ratios
The Fibonacci sequence is a series of numbers in which each number is the sum of the two preceding numbers, starting with 0 and 1. For example 0 + 1 = 1, 1 + 1 = 2, 1 + 2 = 3, and so on. Ultimately, we could go on forever but the first few numbers in the sequence are as follows: 0 , 1, 1, 2, 3, 5, 8, 13, 21, 34, 55, 89, 144.
The extension ratios are calculated by dividing each number in the sequence by the number preceding it. For example 0/1 = 0, 1/1 = 1, 2/1 = 2, 3/2 = 1.5, 5/3 = 1.6666..., 8/5 = 1.6, 13/8 = 1.625, 21/13 = 1.6153..., 34/21 = 1.6190..., 55/34 = 1.6176..., 89/55 = 1.6181..., 144/89 = 1.6179..., and so on. The retracement ratios are calculated by inverting this process and dividing each number in the sequence by the number proceeding it. For example 0/1 = 0, 1/1 = 1, 1/2 = 0.5, 2/3 = 0.666..., 3/5 = 0.6, 5/8 = 0.625, 8/13 = 0.6153..., 13/21 = 0.6190..., 21/34 = 0.6176..., 34/55 = 0.6181..., 55/89 = 0.6179..., 89/144 = 0.6180..., and so on.
1.618 is considered to be the 'golden ratio', found in many natural phenomena such as the growth of seashells and the branching of trees. Some now speculate the universe oscillates at a frequency of 0,618 Hz, which could help to explain such phenomena, but this theory has yet to be proven.
Traders and analysts use Fibonacci retracement and extension indicators, consisting of horizontal lines representing different Fibonacci ratios, for identifying potential levels of support and resistance. Fibonacci ranges are typically drawn from left to right, with retracement levels representing ratios inside of the current range and extension levels representing ratios extended outside of the current range. If the current wave cycle ends on a swing low, the Fibonacci range is drawn from peak to trough. If the current wave cycle ends on a swing high the Fibonacci range is drawn from trough to peak.
Harmonic Patterns
The concept of harmonic patterns in trading was first introduced by H.M. Gartley in his book "Profits in the Stock Market", published in 1935. Gartley observed that markets have a tendency to move in repetitive patterns, and he identified several specific patterns that he believed could be used to predict future price movements.
Since then, many other traders and analysts have built upon Gartley's work and developed their own variations of harmonic patterns. One such contributor is Larry Pesavento, who developed his own methods for measuring harmonic patterns using Fibonacci ratios. Pesavento has written several books on the subject of harmonic patterns and Fibonacci ratios in trading. Another notable contributor to harmonic patterns is Scott Carney, who developed his own approach to harmonic trading in the late 1990s and also popularised the use of Fibonacci ratios to measure harmonic patterns. Carney expanded on Gartley's work and also introduced several new harmonic patterns, such as the Shark pattern and the 5-0 pattern.
The bullish and bearish Gartley patterns are the oldest recognized harmonic patterns in trading and all the other harmonic patterns are ultimately modifications of the original Gartley patterns. Gartley patterns are fundamentally composed of 5 points, or 4 waves.
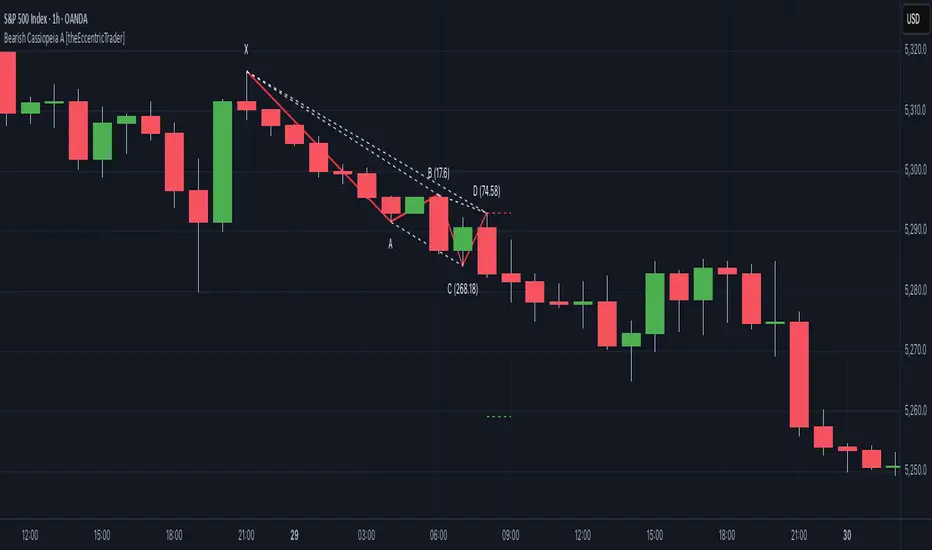
Bullish and Bearish Cassiopeia A Harmonic Patterns
• Bullish Cassiopeia A patterns are fundamentally composed of three troughs and two peaks. The second peak being higher than the first peak. And the third trough being higher than both the first and second troughs, while the second trough is also higher than the first.
• Bearish Cassiopeia A patterns are fundamentally composed of three peaks and two troughs. The second trough being lower than the first trough. And the third peak being lower than both the first and second peaks, while the second peak is also lower than the first.
The ratio measurements I use to detect the patterns are as follows:
• Wave 1 of the pattern, generally referred to as XA, has no specific ratio requirements.
• Wave 2 of the pattern, generally referred to as AB, should retrace by at least 11.34%, but no further than 22.31% of the range set by wave 1.
• Wave 3 of the pattern, generally referred to as BC, should extend by at least 225.7%, but no further than 341% of the range set by wave 2.
• Wave 4 of the pattern, generally referred to as CD, should retrace by at least 77.69%, but no further than 88.66% of the range set by wave 3.
Measurement Tolerances
In general, tolerance in measurements refers to the allowable variation or deviation from a specific value or dimension. It is the range within which a particular measurement is considered to be acceptable or accurate. In this script I have applied this concept to the measurement of harmonic pattern ratios to increase to the frequency of pattern occurrences.
For example, the AB measurement of Gartley patterns is generally set at around 61.8%, but with such specificity in the measuring requirements the patterns are very rare. We can increase the frequency of pattern occurrences by setting a tolerance. A tolerance of 10% to both downside and upside, which is the default setting for all tolerances, means we would have a tolerable measurement range between 51.8-71.8%, thus increasing the frequency of occurrence.
█ FEATURES
Inputs
• AB Lower Tolerance
• AB Upper Tolerance
• BC Lower Tolerance
• BC Upper Tolerance
• CD Lower Tolerance
• CD Upper Tolerance
• Pattern Color
• Label Color
• Show Projections
• Extend Current Projection Lines
Alerts
Users can set alerts for when the patterns occur.
█ LIMITATIONS
All green and red candle calculations are based on differences between open and close prices, as such I have made no attempt to account for green candles that gap lower and close below the close price of the preceding candle, or red candles that gap higher and close above the close price of the preceding candle. This may cause some unexpected behaviour on some markets and timeframes. I can only recommend using 24-hour markets, if and where possible, as there are far fewer gaps and, generally, more data to work with.
█ NOTES
I know a few people have been requesting a single indicator that contains all my patterns and I definitely hear you on that one. However, I have been very busy working on other projects while trying to trade and be a human at the same time. For now I am going to maintain my original approach of releasing each pattern individually so as to maintain consistency. But I am now also working on getting my some of my libraries ready for public release and in doing so I will finally be able to fit all patterns into one script. I will also be giving my scripts some TLC by making them cleaner once I have the libraries up and running. Please bear with me in the meantime, this may take a while. Cheers!
Bullish Cassiopeia A Harmonic Patterns [theEccentricTrader]█ OVERVIEW
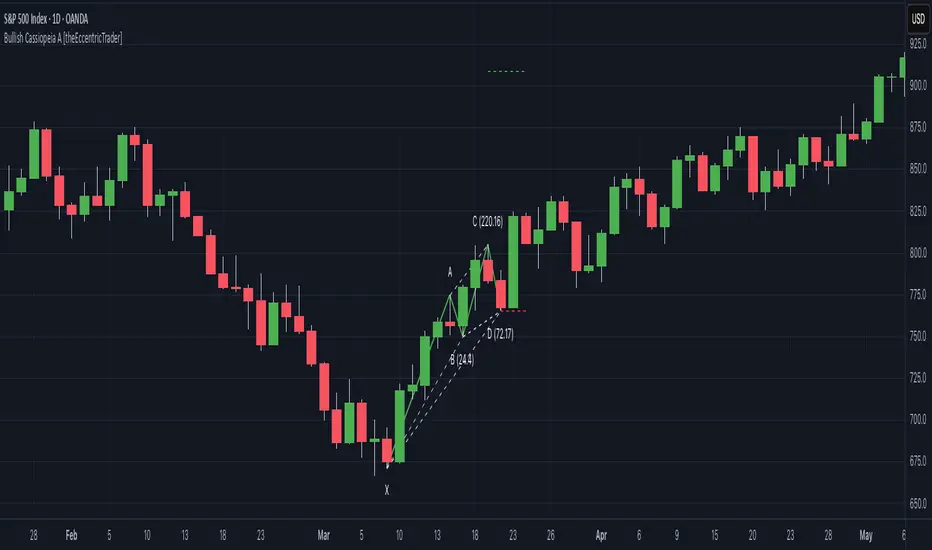
This indicator automatically detects and draws bullish Cassiopeia A harmonic patterns and price projections derived from the ranges that constitute the patterns.
Cassiopeia A, B and C harmonic patterns are patterns that I created/discovered myself. They are all inspired by the Cassiopeia constellation and each one is based on different rotations of the constellation as it moves through the sky. The range ratios are also based on the constellation's right ascension and declination listed on Wikipedia:
Right ascension 22h 57m 04.5897s–03h 41m 14.0997s
Declination 77.6923447°–48.6632690°
en.wikipedia.org
I actually developed this idea quite a while ago now but have not felt audacious enough to introduce a new harmonic pattern, let alone 3 at the same time! But I have since been able to run backtests on tick data going back to 2002 across a variety of market and timeframe combinations and have learned that the Cassiopeia patterns can certainly hold their own against the currently known harmonic patterns. As can be seen in the picture above the bullish Cassiopeia A caught the 2009 bear market bottom almost perfectly.
I would also point out that the Cassiopeia constellation does actually look like a harmonic pattern and the Cassiopeia A star is literally the 'strongest source of radio emission in the sky beyond the solar system', so its arguably more of a real harmonic phenomenon than the current patterns.
www.britannica.com
chandra.si.edu
█ CONCEPTS
Green and Red Candles
• A green candle is one that closes with a close price equal to or above the price it opened.
• A red candle is one that closes with a close price that is lower than the price it opened.
Swing Highs and Swing Lows
• A swing high is a green candle or series of consecutive green candles followed by a single red candle to complete the swing and form the peak.
• A swing low is a red candle or series of consecutive red candles followed by a single green candle to complete the swing and form the trough.
Peak and Trough Prices (Basic)
• The peak price of a complete swing high is the high price of either the red candle that completes the swing high or the high price of the preceding green candle, depending on which is higher.
• The trough price of a complete swing low is the low price of either the green candle that completes the swing low or the low price of the preceding red candle, depending on which is lower.
Historic Peaks and Troughs
The current, or most recent, peak and trough occurrences are referred to as occurrence zero. Previous peak and trough occurrences are referred to as historic and ordered numerically from right to left, with the most recent historic peak and trough occurrences being occurrence one.
Range
The range is simply the difference between the current peak and current trough prices, generally expressed in terms of points or pips.
Upper Trends
• A return line uptrend is formed when the current peak price is higher than the preceding peak price.
• A downtrend is formed when the current peak price is lower than the preceding peak price.
• A double-top is formed when the current peak price is equal to the preceding peak price.
Lower Trends
• An uptrend is formed when the current trough price is higher than the preceding trough price.
• A return line downtrend is formed when the current trough price is lower than the preceding trough price.
• A double-bottom is formed when the current trough price is equal to the preceding trough price.
Muti-Part Upper and Lower Trends
• A multi-part return line uptrend begins with the formation of a new return line uptrend and continues until a new downtrend ends the trend.
• A multi-part downtrend begins with the formation of a new downtrend and continues until a new return line uptrend ends the trend.
• A multi-part uptrend begins with the formation of a new uptrend and continues until a new return line downtrend ends the trend.
• A multi-part return line downtrend begins with the formation of a new return line downtrend and continues until a new uptrend ends the trend.
Double Trends
• A double uptrend is formed when the current trough price is higher than the preceding trough price and the current peak price is higher than the preceding peak price.
• A double downtrend is formed when the current peak price is lower than the preceding peak price and the current trough price is lower than the preceding trough price.
Muti-Part Double Trends
• A multi-part double uptrend begins with the formation of a new uptrend that proceeds a new return line uptrend, and continues until a new downtrend or return line downtrend ends the trend.
• A multi-part double downtrend begins with the formation of a new downtrend that proceeds a new return line downtrend, and continues until a new uptrend or return line uptrend ends the trend.
Wave Cycles
A wave cycle is here defined as a complete two-part move between a swing high and a swing low, or a swing low and a swing high. The first swing high or swing low will set the course for the sequence of wave cycles that follow; for example a chart that begins with a swing low will form its first complete wave cycle upon the formation of the first complete swing high and vice versa.
Figure 1.
Retracement and Extension Ratios
Retracement and extension ratios are calculated by dividing the current range by the preceding range and multiplying the answer by 100. Retracement ratios are those that are equal to or below 100% of the preceding range and extension ratios are those that are above 100% of the preceding range.
Fibonacci Retracement and Extension Ratios
The Fibonacci sequence is a series of numbers in which each number is the sum of the two preceding numbers, starting with 0 and 1. For example 0 + 1 = 1, 1 + 1 = 2, 1 + 2 = 3, and so on. Ultimately, we could go on forever but the first few numbers in the sequence are as follows: 0 , 1, 1, 2, 3, 5, 8, 13, 21, 34, 55, 89, 144.
The extension ratios are calculated by dividing each number in the sequence by the number preceding it. For example 0/1 = 0, 1/1 = 1, 2/1 = 2, 3/2 = 1.5, 5/3 = 1.6666..., 8/5 = 1.6, 13/8 = 1.625, 21/13 = 1.6153..., 34/21 = 1.6190..., 55/34 = 1.6176..., 89/55 = 1.6181..., 144/89 = 1.6179..., and so on. The retracement ratios are calculated by inverting this process and dividing each number in the sequence by the number proceeding it. For example 0/1 = 0, 1/1 = 1, 1/2 = 0.5, 2/3 = 0.666..., 3/5 = 0.6, 5/8 = 0.625, 8/13 = 0.6153..., 13/21 = 0.6190..., 21/34 = 0.6176..., 34/55 = 0.6181..., 55/89 = 0.6179..., 89/144 = 0.6180..., and so on.
1.618 is considered to be the 'golden ratio', found in many natural phenomena such as the growth of seashells and the branching of trees. Some now speculate the universe oscillates at a frequency of 0,618 Hz, which could help to explain such phenomena, but this theory has yet to be proven.
Traders and analysts use Fibonacci retracement and extension indicators, consisting of horizontal lines representing different Fibonacci ratios, for identifying potential levels of support and resistance. Fibonacci ranges are typically drawn from left to right, with retracement levels representing ratios inside of the current range and extension levels representing ratios extended outside of the current range. If the current wave cycle ends on a swing low, the Fibonacci range is drawn from peak to trough. If the current wave cycle ends on a swing high the Fibonacci range is drawn from trough to peak.
Harmonic Patterns
The concept of harmonic patterns in trading was first introduced by H.M. Gartley in his book "Profits in the Stock Market", published in 1935. Gartley observed that markets have a tendency to move in repetitive patterns, and he identified several specific patterns that he believed could be used to predict future price movements.
Since then, many other traders and analysts have built upon Gartley's work and developed their own variations of harmonic patterns. One such contributor is Larry Pesavento, who developed his own methods for measuring harmonic patterns using Fibonacci ratios. Pesavento has written several books on the subject of harmonic patterns and Fibonacci ratios in trading. Another notable contributor to harmonic patterns is Scott Carney, who developed his own approach to harmonic trading in the late 1990s and also popularised the use of Fibonacci ratios to measure harmonic patterns. Carney expanded on Gartley's work and also introduced several new harmonic patterns, such as the Shark pattern and the 5-0 pattern.
The bullish and bearish Gartley patterns are the oldest recognized harmonic patterns in trading and all the other harmonic patterns are ultimately modifications of the original Gartley patterns. Gartley patterns are fundamentally composed of 5 points, or 4 waves.
Bullish and Bearish Cassiopeia A Harmonic Patterns
• Bullish Cassiopeia A patterns are fundamentally composed of three troughs and two peaks. The second peak being higher than the first peak. And the third trough being higher than both the first and second troughs, while the second trough is also higher than the first.
• Bearish Cassiopeia A patterns are fundamentally composed of three peaks and two troughs. The second trough being lower than the first trough. And the third peak being lower than both the first and second peaks, while the second peak is also lower than the first.
The ratio measurements I use to detect the patterns are as follows:
• Wave 1 of the pattern, generally referred to as XA, has no specific ratio requirements.
• Wave 2 of the pattern, generally referred to as AB, should retrace by at least 11.34%, but no further than 22.31% of the range set by wave 1.
• Wave 3 of the pattern, generally referred to as BC, should extend by at least 225.7%, but no further than 341% of the range set by wave 2.
• Wave 4 of the pattern, generally referred to as CD, should retrace by at least 77.69%, but no further than 88.66% of the range set by wave 3.
Measurement Tolerances
In general, tolerance in measurements refers to the allowable variation or deviation from a specific value or dimension. It is the range within which a particular measurement is considered to be acceptable or accurate. In this script I have applied this concept to the measurement of harmonic pattern ratios to increase to the frequency of pattern occurrences.
For example, the AB measurement of Gartley patterns is generally set at around 61.8%, but with such specificity in the measuring requirements the patterns are very rare. We can increase the frequency of pattern occurrences by setting a tolerance. A tolerance of 10% to both downside and upside, which is the default setting for all tolerances, means we would have a tolerable measurement range between 51.8-71.8%, thus increasing the frequency of occurrence.
█ FEATURES
Inputs
• AB Lower Tolerance
• AB Upper Tolerance
• BC Lower Tolerance
• BC Upper Tolerance
• CD Lower Tolerance
• CD Upper Tolerance
• Pattern Color
• Label Color
• Show Projections
• Extend Current Projection Lines
Alerts
Users can set alerts for when the patterns occur.
█ LIMITATIONS
All green and red candle calculations are based on differences between open and close prices, as such I have made no attempt to account for green candles that gap lower and close below the close price of the preceding candle, or red candles that gap higher and close above the close price of the preceding candle. This may cause some unexpected behaviour on some markets and timeframes. I can only recommend using 24-hour markets, if and where possible, as there are far fewer gaps and, generally, more data to work with.
█ NOTES
I know a few people have been requesting a single indicator that contains all my patterns and I definitely hear you on that one. However, I have been very busy working on other projects while trying to trade and be a human at the same time. For now I am going to maintain my original approach of releasing each pattern individually so as to maintain consistency. But I am now also working on getting my some of my libraries ready for public release and in doing so I will finally be able to fit all patterns into one script. I will also be giving my scripts some TLC by making them cleaner once I have the libraries up and running. Please bear with me in the meantime, this may take a while. Cheers!
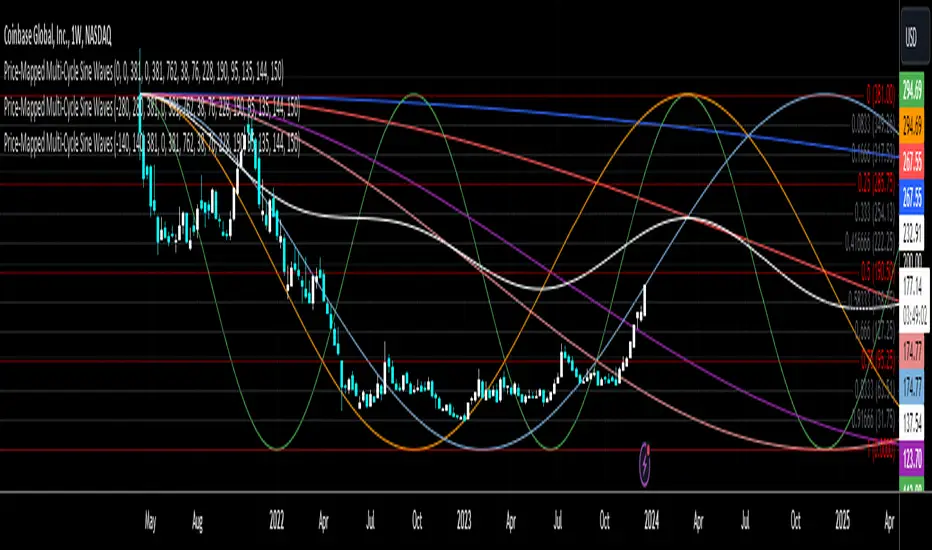
Price-Mapped Multi-Cycle Sine WavesThe primary function is to overlay a series of sine wave patterns onto a chart, providing a nuanced and visually intuitive representation of market dynamics.
Key features of this script include:
User-Defined Parameters: It allows users to input various parameters such as start bar (of the sine wave, so that we can start at a dynamic point), start date of the cycle plots, price range, and cycle lengths. These parameters enable customization of the sine wave patterns according to the user's specific analytical needs.
Multiple Sine Wave Cycles: It can generate up to ten different sine wave cycles, each with its own length and activation toggle.
Dynamic Visualization: The script plots these sine waves on the TradingView chart, each with a distinct color and the ability to offset the waves based on user input. This visual differentiation aids in easy identification and comparison of the different cycles.
Average Wave Calculation: Additionally, the script calculates an average wave based on the enabled cycles, providing a consolidated view of the market movement trends.
In essence, this script is a versatile tool for technical analysts and traders, offering a unique way to visualize and analyze market cycles and trends through the lens of sine wave theory. It stands as a testament to the confluence of mathematical elegance and practical financial analysis.
Elliott's Quadratic Momentum - Strategy [presentTrading]█ Introduction and How It Is Different
The "Elliott's Quadratic Momentum - Strategy" is a unique and innovative approach in the realm of technical trading. This strategy is a fusion of multiple SuperTrend indicators combined with an Elliott Wave-like pattern analysis, offering a comprehensive and dynamic trading tool. It stands apart from conventional strategies by incorporating multiple layers of trend analysis, thereby providing a more robust and nuanced view of market movements.
*Although the script doesn't explicitly analyze Elliott Wave patterns, it employs a wave-like approach by considering multiple SuperTrend indicators. Elliott Wave theory is based on the premise that markets move in predictable wave patterns. While this script doesn't identify specific Elliott Wave structures like impulsive and corrective waves, the sequential checking of trend conditions across multiple SuperTrend indicators mimics a wave-like progression.
BTC 8hr Long/Short Performance
Local Detail
█ Strategy, How It Works: Detailed Explanation
The core of this strategy lies in its multi-tiered approach:
1. Multiple SuperTrend Indicators:
The strategy employs four different SuperTrend indicators, each with unique ATR lengths and multipliers. These indicators offer various perspectives on market trends, ranging from short to long-term views.
By analyzing the convergence of these indicators, the strategy can pinpoint robust entry signals for both long and short positions.
2. Elliott Wave-like Pattern Recognition:
While not directly applying Elliott Wave theory, the strategy takes inspiration from its pattern recognition approach. It looks for alignments in market movements that resemble the characteristic waves of Elliott's theory.
This pattern recognition aids in confirming the signals provided by the SuperTrend indicators, adding an extra layer of validation to the trading signals.
3. Comprehensive Market Analysis:
By combining multiple indicators and pattern analysis, the strategy offers a holistic view of the market. This allows for capturing potential trend reversals and significant market moves early.
█ Trade Direction
The strategy is designed with flexibility in mind, allowing traders to select their preferred trading direction – Long, Short, or Both. This adaptability is key for traders looking to tailor their approach to different market conditions or personal trading styles. The strategy automatically adjusts its logic based on the chosen direction, ensuring that traders are always aligned with their strategic objectives.
█ Usage
To utilize the "Elliott's Quadratic Momentum - Strategy" effectively:
Traders should first determine their trading direction and adjust the SuperTrend settings according to their market analysis and risk appetite.
The strategy is versatile and can be applied across various time frames and asset classes, making it suitable for a wide range of trading scenarios.
It's particularly effective in trending markets, where the alignment of multiple SuperTrend indicators can provide strong trade signals.
█ Default Settings
Trading Direction: Configurable (Long, Short, Both)
SuperTrend Settings:
SuperTrend 1: ATR Length 7, Multiplier 4.0
SuperTrend 2: ATR Length 14, Multiplier 3.618
SuperTrend 3: ATR Length 21, Multiplier 3.5
SuperTrend 4: ATR Length 28, Multiplier 3.382
Additional Settings: Gradient effect for trend visualization, customizable color schemes for upward and downward trends.

Bearish Cypher Harmonic Patterns [theEccentricTrader]█ OVERVIEW
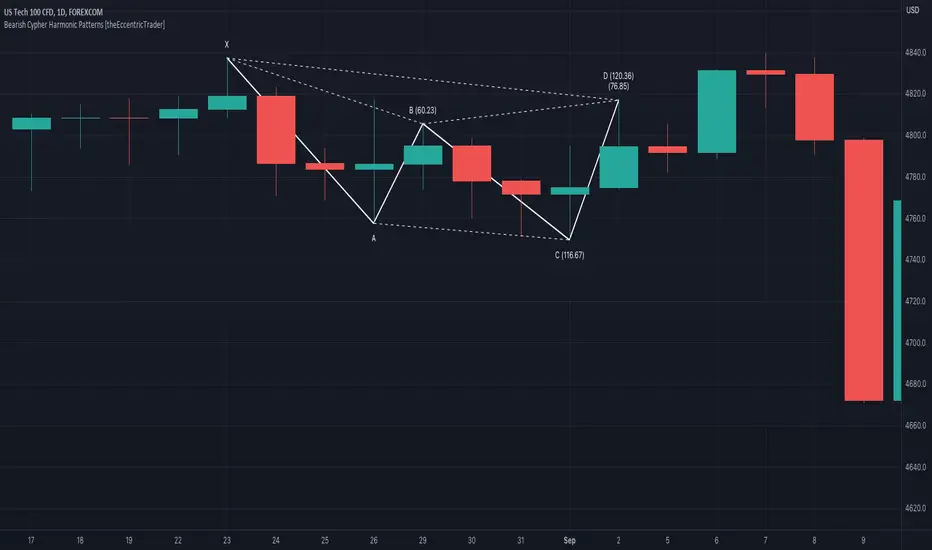
This indicator automatically draws bearish cypher harmonic patterns and price projections derived from the ranges that constitute the patterns.
█ CONCEPTS
Green and Red Candles
• A green candle is one that closes with a close price equal to or above the price it opened.
• A red candle is one that closes with a close price that is lower than the price it opened.
Swing Highs and Swing Lows
• A swing high is a green candle or series of consecutive green candles followed by a single red candle to complete the swing and form the peak.
• A swing low is a red candle or series of consecutive red candles followed by a single green candle to complete the swing and form the trough.
Peak and Trough Prices (Basic)
• The peak price of a complete swing high is the high price of either the red candle that completes the swing high or the high price of the preceding green candle, depending on which is higher.
• The trough price of a complete swing low is the low price of either the green candle that completes the swing low or the low price of the preceding red candle, depending on which is lower.
Historic Peaks and Troughs
The current, or most recent, peak and trough occurrences are referred to as occurrence zero. Previous peak and trough occurrences are referred to as historic and ordered numerically from right to left, with the most recent historic peak and trough occurrences being occurrence one.
Range
The range is simply the difference between the current peak and current trough prices, generally expressed in terms of points or pips.
Support and Resistance
• Support refers to a price level where the demand for an asset is strong enough to prevent the price from falling further.
• Resistance refers to a price level where the supply of an asset is strong enough to prevent the price from rising further.
Support and resistance levels are important because they can help traders identify where the price of an asset might pause or reverse its direction, offering potential entry and exit points. For example, a trader might look to buy an asset when it approaches a support level , with the expectation that the price will bounce back up. Alternatively, a trader might look to sell an asset when it approaches a resistance level , with the expectation that the price will drop back down.
It's important to note that support and resistance levels are not always relevant, and the price of an asset can also break through these levels and continue moving in the same direction.
Upper Trends
• A return line uptrend is formed when the current peak price is higher than the preceding peak price.
• A downtrend is formed when the current peak price is lower than the preceding peak price.
• A double-top is formed when the current peak price is equal to the preceding peak price.
Lower Trends
• An uptrend is formed when the current trough price is higher than the preceding trough price.
• A return line downtrend is formed when the current trough price is lower than the preceding trough price.
• A double-bottom is formed when the current trough price is equal to the preceding trough price.
Wave Cycles
A wave cycle is here defined as a complete two-part move between a swing high and a swing low, or a swing low and a swing high. The first swing high or swing low will set the course for the sequence of wave cycles that follow; for example a chart that begins with a swing low will form its first complete wave cycle upon the formation of the first complete swing high and vice versa.
Figure 1.
Fibonacci Retracement and Extension Ratios
The Fibonacci sequence is a series of numbers in which each number is the sum of the two preceding numbers, starting with 0 and 1. For example 0 + 1 = 1, 1 + 1 = 2, 1 + 2 = 3, and so on. Ultimately, we could go on forever but the first few numbers in the sequence are as follows: 0 , 1, 1, 2, 3, 5, 8, 13, 21, 34, 55, 89, 144.
The extension ratios are calculated by dividing each number in the sequence by the number preceding it. For example 0/1 = 0, 1/1 = 1, 2/1 = 2, 3/2 = 1.5, 5/3 = 1.6666..., 8/5 = 1.6, 13/8 = 1.625, 21/13 = 1.6153..., 34/21 = 1.6190..., 55/34 = 1.6176..., 89/55 = 1.6181..., 144/89 = 1.6179..., and so on. The retracement ratios are calculated by inverting this process and dividing each number in the sequence by the number proceeding it. For example 0/1 = 0, 1/1 = 1, 1/2 = 0.5, 2/3 = 0.666..., 3/5 = 0.6, 5/8 = 0.625, 8/13 = 0.6153..., 13/21 = 0.6190..., 21/34 = 0.6176..., 34/55 = 0.6181..., 55/89 = 0.6179..., 89/144 = 0.6180..., and so on.
1.618 is considered to be the 'golden ratio', found in many natural phenomena such as the growth of seashells and the branching of trees. Some now speculate the universe oscillates at a frequency of 0,618 Hz, which could help to explain such phenomena, but this theory has yet to be proven.
Traders and analysts use Fibonacci retracement and extension indicators, consisting of horizontal lines representing different Fibonacci ratios, for identifying potential levels of support and resistance. Fibonacci ranges are typically drawn from left to right, with retracement levels representing ratios inside of the current range and extension levels representing ratios extended outside of the current range. If the current wave cycle ends on a swing low, the Fibonacci range is drawn from peak to trough. If the current wave cycle ends on a swing high the Fibonacci range is drawn from trough to peak.
Harmonic Patterns
The concept of harmonic patterns in trading was first introduced by H.M. Gartley in his book "Profits in the Stock Market", published in 1935. Gartley observed that markets have a tendency to move in repetitive patterns, and he identified several specific patterns that he believed could be used to predict future price movements.
Since then, many other traders and analysts have built upon Gartley's work and developed their own variations of harmonic patterns. One such contributor is Larry Pesavento, who developed his own methods for measuring harmonic patterns using Fibonacci ratios. Pesavento has written several books on the subject of harmonic patterns and Fibonacci ratios in trading. Another notable contributor to harmonic patterns is Scott Carney, who developed his own approach to harmonic trading in the late 1990s and also popularised the use of Fibonacci ratios to measure harmonic patterns. Carney expanded on Gartley's work and also introduced several new harmonic patterns, such as the Shark pattern and the 5-0 pattern.
The bullish and bearish Gartley patterns are the oldest recognized harmonic patterns in trading and all the other harmonic patterns are ultimately modifications of the original Gartley patterns. Gartley patterns are fundamentally composed of 5 points, or 4 waves.
Bullish and Bearish Cypher Patterns
• Bullish cypher patterns are fundamentally composed of three troughs and two peaks, with the second peak being higher than the first peak and the second trough being higher than the first trough. The third trough must be lower than the second trough but higher than the first.
• Bearish cypher patterns are fundamentally composed of three peaks and two troughs, with the second trough being lower than the first trough and the second peak being lower than the first peak. The third peak must be higher than the second peak but lower than the first.
The most commonly recognised ratio measures used by traders today are as follows:
• Wave 1 of the pattern, referred to as XA, has no specific ratio requirements.
• Wave 2 of the pattern, referred to as AB, should retrace to at least 38.2%, but no further than 61.8% of the range set by wave 1.
• Wave 3 of the pattern, referred to as BC, should extend to at least 113%, but no further than 141.4% of the range set by wave 2.
• Wave 4 of the pattern, referred to as CD, should extend to at least 127.2%, but no further than 200% of the range set by wave 3.
• The last measure, that of wave 4 as a ratio of the range set between points X and C, referred to as XC, should retrace to 78.6%.
Measurement Tolerances
In general, tolerance in measurements refers to the allowable variation or deviation from a specific value or dimension. It is the range within which a particular measurement is considered to be acceptable or accurate. In this script I have applied this concept to the measurement of harmonic pattern ratios to increase to the frequency of pattern occurrences.
For example, the AB measurement of Gartley patterns is generally set at around 61.8%, but with such specificity in the measuring requirements the patterns are very rare. We can increase the frequency of pattern occurrences by setting a tolerance. A tolerance of 10% to both downside and upside, which is the default setting for all tolerances, means we would have a tolerable measurement range between 51.8-71.8%, thus increasing the frequency of occurrence.
█ FEATURES
Inputs
• AB Lower Tolerance
• AB Upper Tolerance
• BC Lower Tolerance
• BC Upper Tolerance
• CD Lower Tolerance
• CD Upper Tolerance
• XC Lower Tolerance
• XC Upper Tolerance
• Pattern Color
• Label Color
• Show Projections
• Extend Current Projection Lines
Alerts
Users can set alerts for when the patterns occur.
█ LIMITATIONS
All green and red candle calculations are based on differences between open and close prices, as such I have made no attempt to account for green candles that gap lower and close below the close price of the preceding candle, or red candles that gap higher and close above the close price of the preceding candle. This may cause some unexpected behaviour on some markets and timeframes. I can only recommend using 24-hour markets, if and where possible, as there are far fewer gaps and, generally, more data to work with.
█ NOTES
The cypher pattern was initially discovered by Darren Oglesbee, but I was unable to find any direct sources to his work on harmonic patterns. And although there seems to be some contention over whether or not there should be a ratio requirement for the CD wave, I decided to include it nonetheless.
Bullish Cypher Harmonic Patterns [theEccentricTrader]█ OVERVIEW
This indicator automatically draws bullish cypher harmonic patterns and price projections derived from the ranges that constitute the patterns.
█ CONCEPTS
Green and Red Candles
• A green candle is one that closes with a close price equal to or above the price it opened.
• A red candle is one that closes with a close price that is lower than the price it opened.
Swing Highs and Swing Lows
• A swing high is a green candle or series of consecutive green candles followed by a single red candle to complete the swing and form the peak.
• A swing low is a red candle or series of consecutive red candles followed by a single green candle to complete the swing and form the trough.
Peak and Trough Prices (Basic)
• The peak price of a complete swing high is the high price of either the red candle that completes the swing high or the high price of the preceding green candle, depending on which is higher.
• The trough price of a complete swing low is the low price of either the green candle that completes the swing low or the low price of the preceding red candle, depending on which is lower.
Historic Peaks and Troughs
The current, or most recent, peak and trough occurrences are referred to as occurrence zero. Previous peak and trough occurrences are referred to as historic and ordered numerically from right to left, with the most recent historic peak and trough occurrences being occurrence one.
Range
The range is simply the difference between the current peak and current trough prices, generally expressed in terms of points or pips.
Support and Resistance
• Support refers to a price level where the demand for an asset is strong enough to prevent the price from falling further.
• Resistance refers to a price level where the supply of an asset is strong enough to prevent the price from rising further.
Support and resistance levels are important because they can help traders identify where the price of an asset might pause or reverse its direction, offering potential entry and exit points. For example, a trader might look to buy an asset when it approaches a support level , with the expectation that the price will bounce back up. Alternatively, a trader might look to sell an asset when it approaches a resistance level , with the expectation that the price will drop back down.
It's important to note that support and resistance levels are not always relevant, and the price of an asset can also break through these levels and continue moving in the same direction.
Upper Trends
• A return line uptrend is formed when the current peak price is higher than the preceding peak price.
• A downtrend is formed when the current peak price is lower than the preceding peak price.
• A double-top is formed when the current peak price is equal to the preceding peak price.
Lower Trends
• An uptrend is formed when the current trough price is higher than the preceding trough price.
• A return line downtrend is formed when the current trough price is lower than the preceding trough price.
• A double-bottom is formed when the current trough price is equal to the preceding trough price.
Wave Cycles
A wave cycle is here defined as a complete two-part move between a swing high and a swing low, or a swing low and a swing high. The first swing high or swing low will set the course for the sequence of wave cycles that follow; for example a chart that begins with a swing low will form its first complete wave cycle upon the formation of the first complete swing high and vice versa.
Figure 1.
Fibonacci Retracement and Extension Ratios
The Fibonacci sequence is a series of numbers in which each number is the sum of the two preceding numbers, starting with 0 and 1. For example 0 + 1 = 1, 1 + 1 = 2, 1 + 2 = 3, and so on. Ultimately, we could go on forever but the first few numbers in the sequence are as follows: 0 , 1, 1, 2, 3, 5, 8, 13, 21, 34, 55, 89, 144.
The extension ratios are calculated by dividing each number in the sequence by the number preceding it. For example 0/1 = 0, 1/1 = 1, 2/1 = 2, 3/2 = 1.5, 5/3 = 1.6666..., 8/5 = 1.6, 13/8 = 1.625, 21/13 = 1.6153..., 34/21 = 1.6190..., 55/34 = 1.6176..., 89/55 = 1.6181..., 144/89 = 1.6179..., and so on. The retracement ratios are calculated by inverting this process and dividing each number in the sequence by the number proceeding it. For example 0/1 = 0, 1/1 = 1, 1/2 = 0.5, 2/3 = 0.666..., 3/5 = 0.6, 5/8 = 0.625, 8/13 = 0.6153..., 13/21 = 0.6190..., 21/34 = 0.6176..., 34/55 = 0.6181..., 55/89 = 0.6179..., 89/144 = 0.6180..., and so on.
1.618 is considered to be the 'golden ratio', found in many natural phenomena such as the growth of seashells and the branching of trees. Some now speculate the universe oscillates at a frequency of 0,618 Hz, which could help to explain such phenomena, but this theory has yet to be proven.
Traders and analysts use Fibonacci retracement and extension indicators, consisting of horizontal lines representing different Fibonacci ratios, for identifying potential levels of support and resistance. Fibonacci ranges are typically drawn from left to right, with retracement levels representing ratios inside of the current range and extension levels representing ratios extended outside of the current range. If the current wave cycle ends on a swing low, the Fibonacci range is drawn from peak to trough. If the current wave cycle ends on a swing high the Fibonacci range is drawn from trough to peak.
Harmonic Patterns
The concept of harmonic patterns in trading was first introduced by H.M. Gartley in his book "Profits in the Stock Market", published in 1935. Gartley observed that markets have a tendency to move in repetitive patterns, and he identified several specific patterns that he believed could be used to predict future price movements.
Since then, many other traders and analysts have built upon Gartley's work and developed their own variations of harmonic patterns. One such contributor is Larry Pesavento, who developed his own methods for measuring harmonic patterns using Fibonacci ratios. Pesavento has written several books on the subject of harmonic patterns and Fibonacci ratios in trading. Another notable contributor to harmonic patterns is Scott Carney, who developed his own approach to harmonic trading in the late 1990s and also popularised the use of Fibonacci ratios to measure harmonic patterns. Carney expanded on Gartley's work and also introduced several new harmonic patterns, such as the Shark pattern and the 5-0 pattern.
The bullish and bearish Gartley patterns are the oldest recognized harmonic patterns in trading and all the other harmonic patterns are ultimately modifications of the original Gartley patterns. Gartley patterns are fundamentally composed of 5 points, or 4 waves.
Bullish and Bearish Cypher Patterns
• Bullish cypher patterns are fundamentally composed of three troughs and two peaks, with the second peak being higher than the first peak and the second trough being higher than the first trough. The third trough must be lower than the second trough but higher than the first.
• Bearish cypher patterns are fundamentally composed of three peaks and two troughs, with the second trough being lower than the first trough and the second peak being lower than the first peak. The third peak must be higher than the second peak but lower than the first.
The most commonly recognised ratio measures used by traders today are as follows:
• Wave 1 of the pattern, referred to as XA, has no specific ratio requirements.
• Wave 2 of the pattern, referred to as AB, should retrace to at least 38.2%, but no further than 61.8% of the range set by wave 1.
• Wave 3 of the pattern, referred to as BC, should extend to at least 113%, but no further than 141.4% of the range set by wave 2.
• Wave 4 of the pattern, referred to as CD, should extend to at least 127.2%, but no further than 200% of the range set by wave 3.
• The last measure, that of wave 4 as a ratio of the range set between points X and C, referred to as XC, should retrace to 78.6%.
Measurement Tolerances
In general, tolerance in measurements refers to the allowable variation or deviation from a specific value or dimension. It is the range within which a particular measurement is considered to be acceptable or accurate. In this script I have applied this concept to the measurement of harmonic pattern ratios to increase to the frequency of pattern occurrences.
For example, the AB measurement of Gartley patterns is generally set at around 61.8%, but with such specificity in the measuring requirements the patterns are very rare. We can increase the frequency of pattern occurrences by setting a tolerance. A tolerance of 10% to both downside and upside, which is the default setting for all tolerances, means we would have a tolerable measurement range between 51.8-71.8%, thus increasing the frequency of occurrence.
█ FEATURES
Inputs
• AB Lower Tolerance
• AB Upper Tolerance
• BC Lower Tolerance
• BC Upper Tolerance
• CD Lower Tolerance
• CD Upper Tolerance
• XC Lower Tolerance
• XC Upper Tolerance
• Pattern Color
• Label Color
• Show Projections
• Extend Current Projection Lines
Alerts
Users can set alerts for when the patterns occur.
█ LIMITATIONS
All green and red candle calculations are based on differences between open and close prices, as such I have made no attempt to account for green candles that gap lower and close below the close price of the preceding candle, or red candles that gap higher and close above the close price of the preceding candle. This may cause some unexpected behaviour on some markets and timeframes. I can only recommend using 24-hour markets, if and where possible, as there are far fewer gaps and, generally, more data to work with.
█ NOTES
The cypher pattern was initially discovered by Darren Oglesbee, but I was unable to find any direct sources to his work on harmonic patterns. And although there seems to be some contention over whether or not there should be a ratio requirement for the CD wave, I decided to include it nonetheless.
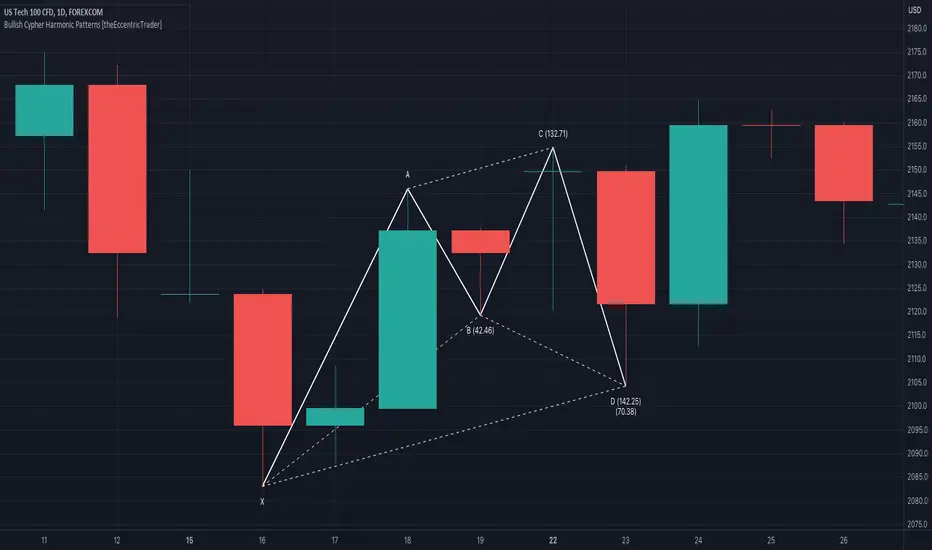
Bearish Deep Crab Harmonic Patterns [theEccentricTrader]█ OVERVIEW
This indicator automatically draws bearish deep crab harmonic patterns and price projections derived from the ranges that constitute the patterns.
█ CONCEPTS
Green and Red Candles
• A green candle is one that closes with a close price equal to or above the price it opened.
• A red candle is one that closes with a close price that is lower than the price it opened.
Swing Highs and Swing Lows
• A swing high is a green candle or series of consecutive green candles followed by a single red candle to complete the swing and form the peak.
• A swing low is a red candle or series of consecutive red candles followed by a single green candle to complete the swing and form the trough.
Peak and Trough Prices (Basic)
• The peak price of a complete swing high is the high price of either the red candle that completes the swing high or the high price of the preceding green candle, depending on which is higher.
• The trough price of a complete swing low is the low price of either the green candle that completes the swing low or the low price of the preceding red candle, depending on which is lower.
Historic Peaks and Troughs
The current, or most recent, peak and trough occurrences are referred to as occurrence zero. Previous peak and trough occurrences are referred to as historic and ordered numerically from right to left, with the most recent historic peak and trough occurrences being occurrence one.
Range
The range is simply the difference between the current peak and current trough prices, generally expressed in terms of points or pips.
Support and Resistance
• Support refers to a price level where the demand for an asset is strong enough to prevent the price from falling further.
• Resistance refers to a price level where the supply of an asset is strong enough to prevent the price from rising further.
Support and resistance levels are important because they can help traders identify where the price of an asset might pause or reverse its direction, offering potential entry and exit points. For example, a trader might look to buy an asset when it approaches a support level , with the expectation that the price will bounce back up. Alternatively, a trader might look to sell an asset when it approaches a resistance level , with the expectation that the price will drop back down.
It's important to note that support and resistance levels are not always relevant, and the price of an asset can also break through these levels and continue moving in the same direction.
Upper Trends
• A return line uptrend is formed when the current peak price is higher than the preceding peak price.
• A downtrend is formed when the current peak price is lower than the preceding peak price.
• A double-top is formed when the current peak price is equal to the preceding peak price.
Lower Trends
• An uptrend is formed when the current trough price is higher than the preceding trough price.
• A return line downtrend is formed when the current trough price is lower than the preceding trough price.
• A double-bottom is formed when the current trough price is equal to the preceding trough price.
Wave Cycles
A wave cycle is here defined as a complete two-part move between a swing high and a swing low, or a swing low and a swing high. The first swing high or swing low will set the course for the sequence of wave cycles that follow; for example a chart that begins with a swing low will form its first complete wave cycle upon the formation of the first complete swing high and vice versa.
Figure 1.
Fibonacci Retracement and Extension Ratios
The Fibonacci sequence is a series of numbers in which each number is the sum of the two preceding numbers, starting with 0 and 1. For example 0 + 1 = 1, 1 + 1 = 2, 1 + 2 = 3, and so on. Ultimately, we could go on forever but the first few numbers in the sequence are as follows: 0 , 1, 1, 2, 3, 5, 8, 13, 21, 34, 55, 89, 144.
The extension ratios are calculated by dividing each number in the sequence by the number preceding it. For example 0/1 = 0, 1/1 = 1, 2/1 = 2, 3/2 = 1.5, 5/3 = 1.6666..., 8/5 = 1.6, 13/8 = 1.625, 21/13 = 1.6153..., 34/21 = 1.6190..., 55/34 = 1.6176..., 89/55 = 1.6181..., 144/89 = 1.6179..., and so on. The retracement ratios are calculated by inverting this process and dividing each number in the sequence by the number proceeding it. For example 0/1 = 0, 1/1 = 1, 1/2 = 0.5, 2/3 = 0.666..., 3/5 = 0.6, 5/8 = 0.625, 8/13 = 0.6153..., 13/21 = 0.6190..., 21/34 = 0.6176..., 34/55 = 0.6181..., 55/89 = 0.6179..., 89/144 = 0.6180..., and so on.
1.618 is considered to be the 'golden ratio', found in many natural phenomena such as the growth of seashells and the branching of trees. Some now speculate the universe oscillates at a frequency of 0,618 Hz, which could help to explain such phenomena, but this theory has yet to be proven.
Traders and analysts use Fibonacci retracement and extension indicators, consisting of horizontal lines representing different Fibonacci ratios, for identifying potential levels of support and resistance. Fibonacci ranges are typically drawn from left to right, with retracement levels representing ratios inside of the current range and extension levels representing ratios extended outside of the current range. If the current wave cycle ends on a swing low, the Fibonacci range is drawn from peak to trough. If the current wave cycle ends on a swing high the Fibonacci range is drawn from trough to peak.
Harmonic Patterns
The concept of harmonic patterns in trading was first introduced by H.M. Gartley in his book "Profits in the Stock Market", published in 1935. Gartley observed that markets have a tendency to move in repetitive patterns, and he identified several specific patterns that he believed could be used to predict future price movements.
Since then, many other traders and analysts have built upon Gartley's work and developed their own variations of harmonic patterns. One such contributor is Larry Pesavento, who developed his own methods for measuring harmonic patterns using Fibonacci ratios. Pesavento has written several books on the subject of harmonic patterns and Fibonacci ratios in trading. Another notable contributor to harmonic patterns is Scott Carney, who developed his own approach to harmonic trading in the late 1990s and also popularised the use of Fibonacci ratios to measure harmonic patterns. Carney expanded on Gartley's work and also introduced several new harmonic patterns, such as the Shark pattern and the 5-0 pattern.
The bullish and bearish Gartley patterns are the oldest recognized harmonic patterns in trading and all the other harmonic patterns are ultimately modifications of the original Gartley patterns. Gartley patterns are fundamentally composed of 5 points, or 4 waves.
Bullish and Bearish Deep Crab Patterns
• Bullish deep crab patterns are fundamentally composed of three troughs and two peaks. The second peak being lower than the first peak. And the third trough being lower than both the first and second troughs, while the second trough is higher than the first.
• Bearish deep crab patterns are fundamentally composed of three peaks and two troughs. The second trough being higher than the first trough. And the third peak being higher than both the first and second peaks, while the second peak is lower than the first.
The ratio measurements recommended by Scott Carney, who originated the pattern, are as follows:
• Wave 1 of the pattern, generally referred to as XA, has no specific ratio requirements.
• Wave 2 of the pattern, generally referred to as AB, should retrace to 88.6% of the range set by wave 1.
• Wave 3 of the pattern, generally referred to as BC, should retrace by at least 38.2%, but no further than 88.6% of the range set by wave 2.
• Wave 4 of the pattern, generally referred to as CD, should extend to at least 200%, but no further than 361.8% of the range set by wave 3.
• The last measure, generally referred to as AD, is that of wave 4 as a ratio of the range set by wave 1, which should extend to 161.8%.
Measurement Tolerances
In general, tolerance in measurements refers to the allowable variation or deviation from a specific value or dimension. It is the range within which a particular measurement is considered to be acceptable or accurate. In this script I have applied this concept to the measurement of harmonic pattern ratios to increase to the frequency of pattern occurrences.
For example, the AB measurement of Gartley patterns is generally set at around 61.8%, but with such specificity in the measuring requirements the patterns are very rare. We can increase the frequency of pattern occurrences by setting a tolerance. A tolerance of 10% to both downside and upside, which is the default setting for all tolerances, means we would have a tolerable measurement range between 51.8-71.8%, thus increasing the frequency of occurrence.
█ FEATURES
Inputs
• AB Lower Tolerance
• AB Upper Tolerance
• BC Lower Tolerance
• BC Upper Tolerance
• CD Lower Tolerance
• CD Upper Tolerance
• AD Lower Tolerance
• AD Upper Tolerance
• Pattern Color
• Label Color
• Show Projections
• Extend Current Projection Lines
Alerts
Users can set alerts for when the patterns occur.
█ LIMITATIONS
All green and red candle calculations are based on differences between open and close prices, as such I have made no attempt to account for green candles that gap lower and close below the close price of the preceding candle, or red candles that gap higher and close above the close price of the preceding candle. This may cause some unexpected behaviour on some markets and timeframes. I can only recommend using 24-hour markets, if and where possible, as there are far fewer gaps and, generally, more data to work with.
█ NOTES
A link to Scott's harmonic patterns webpage for anyone who may be interested: harmonictrader.com/harmonic-patterns/

Bullish Deep Crab Harmonic Patterns [theEccentricTrader]█ OVERVIEW
This indicator automatically draws bullish deep crab harmonic patterns and price projections derived from the ranges that constitute the patterns.
█ CONCEPTS
Green and Red Candles
• A green candle is one that closes with a close price equal to or above the price it opened.
• A red candle is one that closes with a close price that is lower than the price it opened.
Swing Highs and Swing Lows
• A swing high is a green candle or series of consecutive green candles followed by a single red candle to complete the swing and form the peak.
• A swing low is a red candle or series of consecutive red candles followed by a single green candle to complete the swing and form the trough.
Peak and Trough Prices (Basic)
• The peak price of a complete swing high is the high price of either the red candle that completes the swing high or the high price of the preceding green candle, depending on which is higher.
• The trough price of a complete swing low is the low price of either the green candle that completes the swing low or the low price of the preceding red candle, depending on which is lower.
Historic Peaks and Troughs
The current, or most recent, peak and trough occurrences are referred to as occurrence zero. Previous peak and trough occurrences are referred to as historic and ordered numerically from right to left, with the most recent historic peak and trough occurrences being occurrence one.
Range
The range is simply the difference between the current peak and current trough prices, generally expressed in terms of points or pips.
Support and Resistance
• Support refers to a price level where the demand for an asset is strong enough to prevent the price from falling further.
• Resistance refers to a price level where the supply of an asset is strong enough to prevent the price from rising further.
Support and resistance levels are important because they can help traders identify where the price of an asset might pause or reverse its direction, offering potential entry and exit points. For example, a trader might look to buy an asset when it approaches a support level , with the expectation that the price will bounce back up. Alternatively, a trader might look to sell an asset when it approaches a resistance level , with the expectation that the price will drop back down.
It's important to note that support and resistance levels are not always relevant, and the price of an asset can also break through these levels and continue moving in the same direction.
Upper Trends
• A return line uptrend is formed when the current peak price is higher than the preceding peak price.
• A downtrend is formed when the current peak price is lower than the preceding peak price.
• A double-top is formed when the current peak price is equal to the preceding peak price.
Lower Trends
• An uptrend is formed when the current trough price is higher than the preceding trough price.
• A return line downtrend is formed when the current trough price is lower than the preceding trough price.
• A double-bottom is formed when the current trough price is equal to the preceding trough price.
Wave Cycles
A wave cycle is here defined as a complete two-part move between a swing high and a swing low, or a swing low and a swing high. The first swing high or swing low will set the course for the sequence of wave cycles that follow; for example a chart that begins with a swing low will form its first complete wave cycle upon the formation of the first complete swing high and vice versa.
Figure 1.
Fibonacci Retracement and Extension Ratios
The Fibonacci sequence is a series of numbers in which each number is the sum of the two preceding numbers, starting with 0 and 1. For example 0 + 1 = 1, 1 + 1 = 2, 1 + 2 = 3, and so on. Ultimately, we could go on forever but the first few numbers in the sequence are as follows: 0 , 1, 1, 2, 3, 5, 8, 13, 21, 34, 55, 89, 144.
The extension ratios are calculated by dividing each number in the sequence by the number preceding it. For example 0/1 = 0, 1/1 = 1, 2/1 = 2, 3/2 = 1.5, 5/3 = 1.6666..., 8/5 = 1.6, 13/8 = 1.625, 21/13 = 1.6153..., 34/21 = 1.6190..., 55/34 = 1.6176..., 89/55 = 1.6181..., 144/89 = 1.6179..., and so on. The retracement ratios are calculated by inverting this process and dividing each number in the sequence by the number proceeding it. For example 0/1 = 0, 1/1 = 1, 1/2 = 0.5, 2/3 = 0.666..., 3/5 = 0.6, 5/8 = 0.625, 8/13 = 0.6153..., 13/21 = 0.6190..., 21/34 = 0.6176..., 34/55 = 0.6181..., 55/89 = 0.6179..., 89/144 = 0.6180..., and so on.
1.618 is considered to be the 'golden ratio', found in many natural phenomena such as the growth of seashells and the branching of trees. Some now speculate the universe oscillates at a frequency of 0,618 Hz, which could help to explain such phenomena, but this theory has yet to be proven.
Traders and analysts use Fibonacci retracement and extension indicators, consisting of horizontal lines representing different Fibonacci ratios, for identifying potential levels of support and resistance. Fibonacci ranges are typically drawn from left to right, with retracement levels representing ratios inside of the current range and extension levels representing ratios extended outside of the current range. If the current wave cycle ends on a swing low, the Fibonacci range is drawn from peak to trough. If the current wave cycle ends on a swing high the Fibonacci range is drawn from trough to peak.
Harmonic Patterns
The concept of harmonic patterns in trading was first introduced by H.M. Gartley in his book "Profits in the Stock Market", published in 1935. Gartley observed that markets have a tendency to move in repetitive patterns, and he identified several specific patterns that he believed could be used to predict future price movements.
Since then, many other traders and analysts have built upon Gartley's work and developed their own variations of harmonic patterns. One such contributor is Larry Pesavento, who developed his own methods for measuring harmonic patterns using Fibonacci ratios. Pesavento has written several books on the subject of harmonic patterns and Fibonacci ratios in trading. Another notable contributor to harmonic patterns is Scott Carney, who developed his own approach to harmonic trading in the late 1990s and also popularised the use of Fibonacci ratios to measure harmonic patterns. Carney expanded on Gartley's work and also introduced several new harmonic patterns, such as the Shark pattern and the 5-0 pattern.
The bullish and bearish Gartley patterns are the oldest recognized harmonic patterns in trading and all the other harmonic patterns are ultimately modifications of the original Gartley patterns. Gartley patterns are fundamentally composed of 5 points, or 4 waves.
Bullish and Bearish Deep Crab Patterns
• Bullish deep crab patterns are fundamentally composed of three troughs and two peaks. The second peak being lower than the first peak. And the third trough being lower than both the first and second troughs, while the second trough is higher than the first.
• Bearish deep crab patterns are fundamentally composed of three peaks and two troughs. The second trough being higher than the first trough. And the third peak being higher than both the first and second peaks, while the second peak is lower than the first.
The ratio measurements recommended by Scott Carney, who originated the pattern, are as follows:
• Wave 1 of the pattern, generally referred to as XA, has no specific ratio requirements.
• Wave 2 of the pattern, generally referred to as AB, should retrace to 88.6% of the range set by wave 1.
• Wave 3 of the pattern, generally referred to as BC, should retrace by at least 38.2%, but no further than 88.6% of the range set by wave 2.
• Wave 4 of the pattern, generally referred to as CD, should extend to at least 200%, but no further than 361.8% of the range set by wave 3.
• The last measure, generally referred to as AD, is that of wave 4 as a ratio of the range set by wave 1, which should extend to 161.8%.
Measurement Tolerances
In general, tolerance in measurements refers to the allowable variation or deviation from a specific value or dimension. It is the range within which a particular measurement is considered to be acceptable or accurate. In this script I have applied this concept to the measurement of harmonic pattern ratios to increase to the frequency of pattern occurrences.
For example, the AB measurement of Gartley patterns is generally set at around 61.8%, but with such specificity in the measuring requirements the patterns are very rare. We can increase the frequency of pattern occurrences by setting a tolerance. A tolerance of 10% to both downside and upside, which is the default setting for all tolerances, means we would have a tolerable measurement range between 51.8-71.8%, thus increasing the frequency of occurrence.
█ FEATURES
Inputs
• AB Lower Tolerance
• AB Upper Tolerance
• BC Lower Tolerance
• BC Upper Tolerance
• CD Lower Tolerance
• CD Upper Tolerance
• AD Lower Tolerance
• AD Upper Tolerance
• Pattern Color
• Label Color
• Show Projections
• Extend Current Projection Lines
Alerts
Users can set alerts for when the patterns occur.
█ LIMITATIONS
All green and red candle calculations are based on differences between open and close prices, as such I have made no attempt to account for green candles that gap lower and close below the close price of the preceding candle, or red candles that gap higher and close above the close price of the preceding candle. This may cause some unexpected behaviour on some markets and timeframes. I can only recommend using 24-hour markets, if and where possible, as there are far fewer gaps and, generally, more data to work with.
█ NOTES
A link to Scott's harmonic patterns webpage for anyone who may be interested: harmonictrader.com/harmonic-patterns/
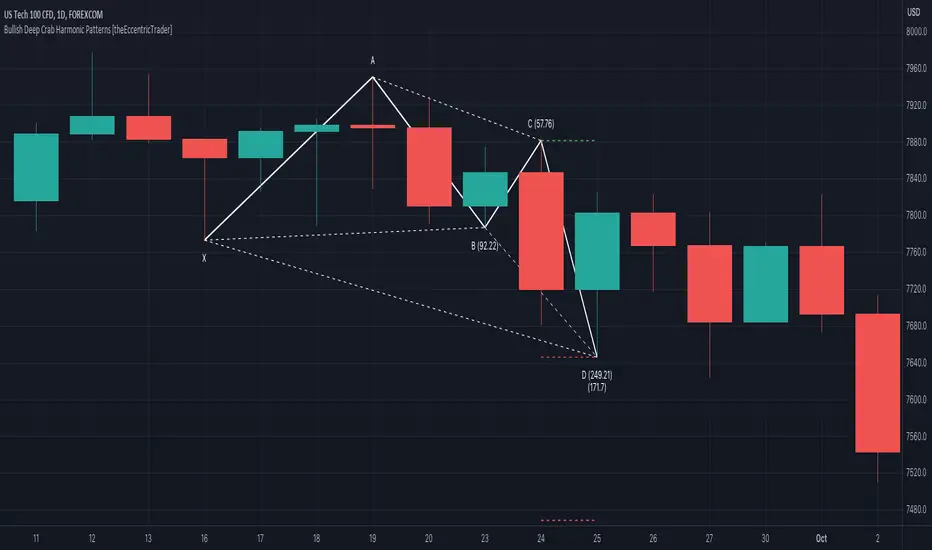
Bearish Alternate Bat Harmonic Patterns [theEccentricTrader]█ OVERVIEW
This indicator automatically draws bearish alternate bat harmonic patterns and price projections derived from the ranges that constitute the patterns.
█ CONCEPTS
Green and Red Candles
• A green candle is one that closes with a close price equal to or above the price it opened.
• A red candle is one that closes with a close price that is lower than the price it opened.
Swing Highs and Swing Lows
• A swing high is a green candle or series of consecutive green candles followed by a single red candle to complete the swing and form the peak.
• A swing low is a red candle or series of consecutive red candles followed by a single green candle to complete the swing and form the trough.
Peak and Trough Prices (Basic)
• The peak price of a complete swing high is the high price of either the red candle that completes the swing high or the high price of the preceding green candle, depending on which is higher.
• The trough price of a complete swing low is the low price of either the green candle that completes the swing low or the low price of the preceding red candle, depending on which is lower.
Historic Peaks and Troughs
The current, or most recent, peak and trough occurrences are referred to as occurrence zero. Previous peak and trough occurrences are referred to as historic and ordered numerically from right to left, with the most recent historic peak and trough occurrences being occurrence one.
Range
The range is simply the difference between the current peak and current trough prices, generally expressed in terms of points or pips.
Support and Resistance
• Support refers to a price level where the demand for an asset is strong enough to prevent the price from falling further.
• Resistance refers to a price level where the supply of an asset is strong enough to prevent the price from rising further.
Support and resistance levels are important because they can help traders identify where the price of an asset might pause or reverse its direction, offering potential entry and exit points. For example, a trader might look to buy an asset when it approaches a support level , with the expectation that the price will bounce back up. Alternatively, a trader might look to sell an asset when it approaches a resistance level , with the expectation that the price will drop back down.
It's important to note that support and resistance levels are not always relevant, and the price of an asset can also break through these levels and continue moving in the same direction.
Upper Trends
• A return line uptrend is formed when the current peak price is higher than the preceding peak price.
• A downtrend is formed when the current peak price is lower than the preceding peak price.
• A double-top is formed when the current peak price is equal to the preceding peak price.
Lower Trends
• An uptrend is formed when the current trough price is higher than the preceding trough price.
• A return line downtrend is formed when the current trough price is lower than the preceding trough price.
• A double-bottom is formed when the current trough price is equal to the preceding trough price.
Wave Cycles
A wave cycle is here defined as a complete two-part move between a swing high and a swing low, or a swing low and a swing high. The first swing high or swing low will set the course for the sequence of wave cycles that follow; for example a chart that begins with a swing low will form its first complete wave cycle upon the formation of the first complete swing high and vice versa.
Figure 1.
Fibonacci Retracement and Extension Ratios
The Fibonacci sequence is a series of numbers in which each number is the sum of the two preceding numbers, starting with 0 and 1. For example 0 + 1 = 1, 1 + 1 = 2, 1 + 2 = 3, and so on. Ultimately, we could go on forever but the first few numbers in the sequence are as follows: 0 , 1, 1, 2, 3, 5, 8, 13, 21, 34, 55, 89, 144.
The extension ratios are calculated by dividing each number in the sequence by the number preceding it. For example 0/1 = 0, 1/1 = 1, 2/1 = 2, 3/2 = 1.5, 5/3 = 1.6666..., 8/5 = 1.6, 13/8 = 1.625, 21/13 = 1.6153..., 34/21 = 1.6190..., 55/34 = 1.6176..., 89/55 = 1.6181..., 144/89 = 1.6179..., and so on. The retracement ratios are calculated by inverting this process and dividing each number in the sequence by the number proceeding it. For example 0/1 = 0, 1/1 = 1, 1/2 = 0.5, 2/3 = 0.666..., 3/5 = 0.6, 5/8 = 0.625, 8/13 = 0.6153..., 13/21 = 0.6190..., 21/34 = 0.6176..., 34/55 = 0.6181..., 55/89 = 0.6179..., 89/144 = 0.6180..., and so on.
1.618 is considered to be the 'golden ratio', found in many natural phenomena such as the growth of seashells and the branching of trees. Some now speculate the universe oscillates at a frequency of 0,618 Hz, which could help to explain such phenomena, but this theory has yet to be proven.
Traders and analysts use Fibonacci retracement and extension indicators, consisting of horizontal lines representing different Fibonacci ratios, for identifying potential levels of support and resistance. Fibonacci ranges are typically drawn from left to right, with retracement levels representing ratios inside of the current range and extension levels representing ratios extended outside of the current range. If the current wave cycle ends on a swing low, the Fibonacci range is drawn from peak to trough. If the current wave cycle ends on a swing high the Fibonacci range is drawn from trough to peak.
Harmonic Patterns
The concept of harmonic patterns in trading was first introduced by H.M. Gartley in his book "Profits in the Stock Market", published in 1935. Gartley observed that markets have a tendency to move in repetitive patterns, and he identified several specific patterns that he believed could be used to predict future price movements.
Since then, many other traders and analysts have built upon Gartley's work and developed their own variations of harmonic patterns. One such contributor is Larry Pesavento, who developed his own methods for measuring harmonic patterns using Fibonacci ratios. Pesavento has written several books on the subject of harmonic patterns and Fibonacci ratios in trading. Another notable contributor to harmonic patterns is Scott Carney, who developed his own approach to harmonic trading in the late 1990s and also popularised the use of Fibonacci ratios to measure harmonic patterns. Carney expanded on Gartley's work and also introduced several new harmonic patterns, such as the Shark pattern and the 5-0 pattern.
The bullish and bearish Gartley patterns are the oldest recognized harmonic patterns in trading and all the other harmonic patterns are ultimately modifications of the original Gartley patterns. Gartley patterns are fundamentally composed of 5 points, or 4 waves.
Bullish and Bearish Alternate Bat Patterns
• Bullish alternate bat patterns are fundamentally composed of three troughs and two peaks. The second peak being lower than the first peak and the second trough being higher than the first, with the third trough being lower than both the first and second troughs.
• Bearish alternate bat patterns are fundamentally composed of three peaks and two troughs. The second trough being higher than the first trough and the second peak being lower than the first, with the third peak being higher than both the first and second peaks.
The ratio measurements recommended by Scott Carney, who originated the pattern, are as follows:
• Wave 1 of the pattern, generally referred to as XA, has no specific ratio requirements.
• Wave 2 of the pattern, generally referred to as AB, should retrace to 38.2% of the range set by wave 1.
• Wave 3 of the pattern, generally referred to as BC, should retrace by at least 38.2%, but no further than 88.6% of the range set by wave 2.
• Wave 4 of the pattern, generally referred to as CD, should extend to at least 200%, but no further than 361.8% of the range set by wave 3.
• The last measure, generally referred to as AD, is that of wave 4 as a ratio of the range set by wave 1, which should extend to 113%.
Measurement Tolerances
In general, tolerance in measurements refers to the allowable variation or deviation from a specific value or dimension. It is the range within which a particular measurement is considered to be acceptable or accurate. In this script I have applied this concept to the measurement of harmonic pattern ratios to increase to the frequency of pattern occurrences.
For example, the AB measurement of Gartley patterns is generally set at around 61.8%, but with such specificity in the measuring requirements the patterns are very rare. We can increase the frequency of pattern occurrences by setting a tolerance. A tolerance of 10% to both downside and upside, which is the default setting for all tolerances, means we would have a tolerable measurement range between 51.8-71.8%, thus increasing the frequency of occurrence.
█ FEATURES
Inputs
• AB Lower Tolerance
• AB Upper Tolerance
• BC Lower Tolerance
• BC Upper Tolerance
• CD Lower Tolerance
• CD Upper Tolerance
• AD Lower Tolerance
• AD Upper Tolerance
• Pattern Color
• Label Color
• Show Projections
• Extend Current Projection Lines
Alerts
Users can set alerts for when the patterns occur.
█ LIMITATIONS
All green and red candle calculations are based on differences between open and close prices, as such I have made no attempt to account for green candles that gap lower and close below the close price of the preceding candle, or red candles that gap higher and close above the close price of the preceding candle. This may cause some unexpected behaviour on some markets and timeframes. I can only recommend using 24-hour markets, if and where possible, as there are far fewer gaps and, generally, more data to work with.
█ NOTES
A link to Scott's harmonic patterns webpage for anyone who may be interested: harmonictrader.com/harmonic-patterns/
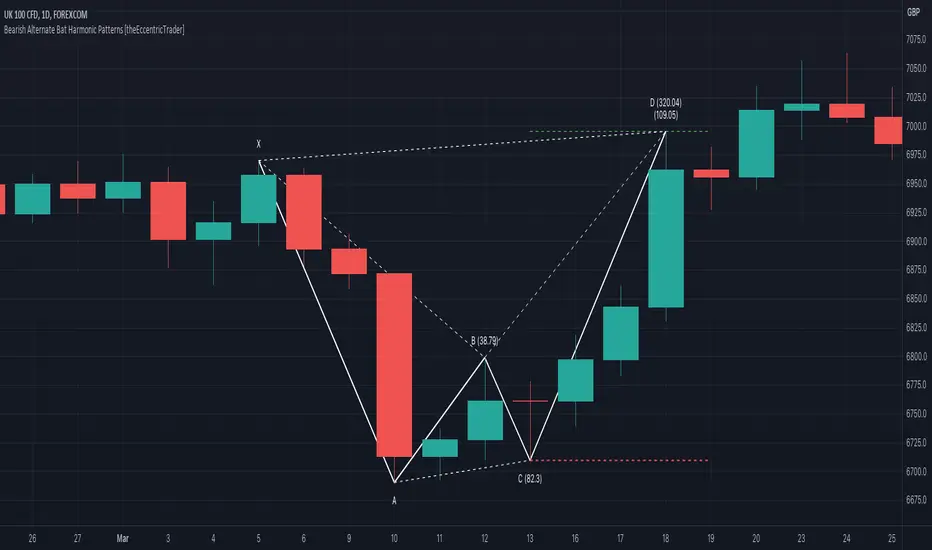
Bullish Alternate Bat Harmonic Patterns [theEccentricTrader]█ OVERVIEW
This indicator automatically draws bullish alternate bat harmonic patterns and price projections derived from the ranges that constitute the patterns.
█ CONCEPTS
Green and Red Candles
• A green candle is one that closes with a close price equal to or above the price it opened.
• A red candle is one that closes with a close price that is lower than the price it opened.
Swing Highs and Swing Lows
• A swing high is a green candle or series of consecutive green candles followed by a single red candle to complete the swing and form the peak.
• A swing low is a red candle or series of consecutive red candles followed by a single green candle to complete the swing and form the trough.
Peak and Trough Prices (Basic)
• The peak price of a complete swing high is the high price of either the red candle that completes the swing high or the high price of the preceding green candle, depending on which is higher.
• The trough price of a complete swing low is the low price of either the green candle that completes the swing low or the low price of the preceding red candle, depending on which is lower.
Historic Peaks and Troughs
The current, or most recent, peak and trough occurrences are referred to as occurrence zero. Previous peak and trough occurrences are referred to as historic and ordered numerically from right to left, with the most recent historic peak and trough occurrences being occurrence one.
Range
The range is simply the difference between the current peak and current trough prices, generally expressed in terms of points or pips.
Support and Resistance
• Support refers to a price level where the demand for an asset is strong enough to prevent the price from falling further.
• Resistance refers to a price level where the supply of an asset is strong enough to prevent the price from rising further.
Support and resistance levels are important because they can help traders identify where the price of an asset might pause or reverse its direction, offering potential entry and exit points. For example, a trader might look to buy an asset when it approaches a support level , with the expectation that the price will bounce back up. Alternatively, a trader might look to sell an asset when it approaches a resistance level , with the expectation that the price will drop back down.
It's important to note that support and resistance levels are not always relevant, and the price of an asset can also break through these levels and continue moving in the same direction.
Upper Trends
• A return line uptrend is formed when the current peak price is higher than the preceding peak price.
• A downtrend is formed when the current peak price is lower than the preceding peak price.
• A double-top is formed when the current peak price is equal to the preceding peak price.
Lower Trends
• An uptrend is formed when the current trough price is higher than the preceding trough price.
• A return line downtrend is formed when the current trough price is lower than the preceding trough price.
• A double-bottom is formed when the current trough price is equal to the preceding trough price.
Wave Cycles
A wave cycle is here defined as a complete two-part move between a swing high and a swing low, or a swing low and a swing high. The first swing high or swing low will set the course for the sequence of wave cycles that follow; for example a chart that begins with a swing low will form its first complete wave cycle upon the formation of the first complete swing high and vice versa.
Figure 1.
Fibonacci Retracement and Extension Ratios
The Fibonacci sequence is a series of numbers in which each number is the sum of the two preceding numbers, starting with 0 and 1. For example 0 + 1 = 1, 1 + 1 = 2, 1 + 2 = 3, and so on. Ultimately, we could go on forever but the first few numbers in the sequence are as follows: 0 , 1, 1, 2, 3, 5, 8, 13, 21, 34, 55, 89, 144.
The extension ratios are calculated by dividing each number in the sequence by the number preceding it. For example 0/1 = 0, 1/1 = 1, 2/1 = 2, 3/2 = 1.5, 5/3 = 1.6666..., 8/5 = 1.6, 13/8 = 1.625, 21/13 = 1.6153..., 34/21 = 1.6190..., 55/34 = 1.6176..., 89/55 = 1.6181..., 144/89 = 1.6179..., and so on. The retracement ratios are calculated by inverting this process and dividing each number in the sequence by the number proceeding it. For example 0/1 = 0, 1/1 = 1, 1/2 = 0.5, 2/3 = 0.666..., 3/5 = 0.6, 5/8 = 0.625, 8/13 = 0.6153..., 13/21 = 0.6190..., 21/34 = 0.6176..., 34/55 = 0.6181..., 55/89 = 0.6179..., 89/144 = 0.6180..., and so on.
1.618 is considered to be the 'golden ratio', found in many natural phenomena such as the growth of seashells and the branching of trees. Some now speculate the universe oscillates at a frequency of 0,618 Hz, which could help to explain such phenomena, but this theory has yet to be proven.
Traders and analysts use Fibonacci retracement and extension indicators, consisting of horizontal lines representing different Fibonacci ratios, for identifying potential levels of support and resistance. Fibonacci ranges are typically drawn from left to right, with retracement levels representing ratios inside of the current range and extension levels representing ratios extended outside of the current range. If the current wave cycle ends on a swing low, the Fibonacci range is drawn from peak to trough. If the current wave cycle ends on a swing high the Fibonacci range is drawn from trough to peak.
Harmonic Patterns
The concept of harmonic patterns in trading was first introduced by H.M. Gartley in his book "Profits in the Stock Market", published in 1935. Gartley observed that markets have a tendency to move in repetitive patterns, and he identified several specific patterns that he believed could be used to predict future price movements.
Since then, many other traders and analysts have built upon Gartley's work and developed their own variations of harmonic patterns. One such contributor is Larry Pesavento, who developed his own methods for measuring harmonic patterns using Fibonacci ratios. Pesavento has written several books on the subject of harmonic patterns and Fibonacci ratios in trading. Another notable contributor to harmonic patterns is Scott Carney, who developed his own approach to harmonic trading in the late 1990s and also popularised the use of Fibonacci ratios to measure harmonic patterns. Carney expanded on Gartley's work and also introduced several new harmonic patterns, such as the Shark pattern and the 5-0 pattern.
The bullish and bearish Gartley patterns are the oldest recognized harmonic patterns in trading and all the other harmonic patterns are ultimately modifications of the original Gartley patterns. Gartley patterns are fundamentally composed of 5 points, or 4 waves.
Bullish and Bearish Alternate Bat Patterns
• Bullish alternate bat patterns are fundamentally composed of three troughs and two peaks. The second peak being lower than the first peak and the second trough being higher than the first, with the third trough being lower than both the first and second troughs.
• Bearish alternate bat patterns are fundamentally composed of three peaks and two troughs. The second trough being higher than the first trough and the second peak being lower than the first, with the third peak being higher than both the first and second peaks.
The ratio measurements recommended by Scott Carney, who originated the pattern, are as follows:
• Wave 1 of the pattern, generally referred to as XA, has no specific ratio requirements.
• Wave 2 of the pattern, generally referred to as AB, should retrace to 38.2% of the range set by wave 1.
• Wave 3 of the pattern, generally referred to as BC, should retrace by at least 38.2%, but no further than 88.6% of the range set by wave 2.
• Wave 4 of the pattern, generally referred to as CD, should extend to at least 200%, but no further than 361.8% of the range set by wave 3.
• The last measure, generally referred to as AD, is that of wave 4 as a ratio of the range set by wave 1, which should extend to 113%.
Measurement Tolerances
In general, tolerance in measurements refers to the allowable variation or deviation from a specific value or dimension. It is the range within which a particular measurement is considered to be acceptable or accurate. In this script I have applied this concept to the measurement of harmonic pattern ratios to increase to the frequency of pattern occurrences.
For example, the AB measurement of Gartley patterns is generally set at around 61.8%, but with such specificity in the measuring requirements the patterns are very rare. We can increase the frequency of pattern occurrences by setting a tolerance. A tolerance of 10% to both downside and upside, which is the default setting for all tolerances, means we would have a tolerable measurement range between 51.8-71.8%, thus increasing the frequency of occurrence.
█ FEATURES
Inputs
• AB Lower Tolerance
• AB Upper Tolerance
• BC Lower Tolerance
• BC Upper Tolerance
• CD Lower Tolerance
• CD Upper Tolerance
• AD Lower Tolerance
• AD Upper Tolerance
• Pattern Color
• Label Color
• Show Projections
• Extend Current Projection Lines
Alerts
Users can set alerts for when the patterns occur.
█ LIMITATIONS
All green and red candle calculations are based on differences between open and close prices, as such I have made no attempt to account for green candles that gap lower and close below the close price of the preceding candle, or red candles that gap higher and close above the close price of the preceding candle. This may cause some unexpected behaviour on some markets and timeframes. I can only recommend using 24-hour markets, if and where possible, as there are far fewer gaps and, generally, more data to work with.
█ NOTES
A link to Scott's harmonic patterns webpage for anyone who may be interested: harmonictrader.com/harmonic-patterns/
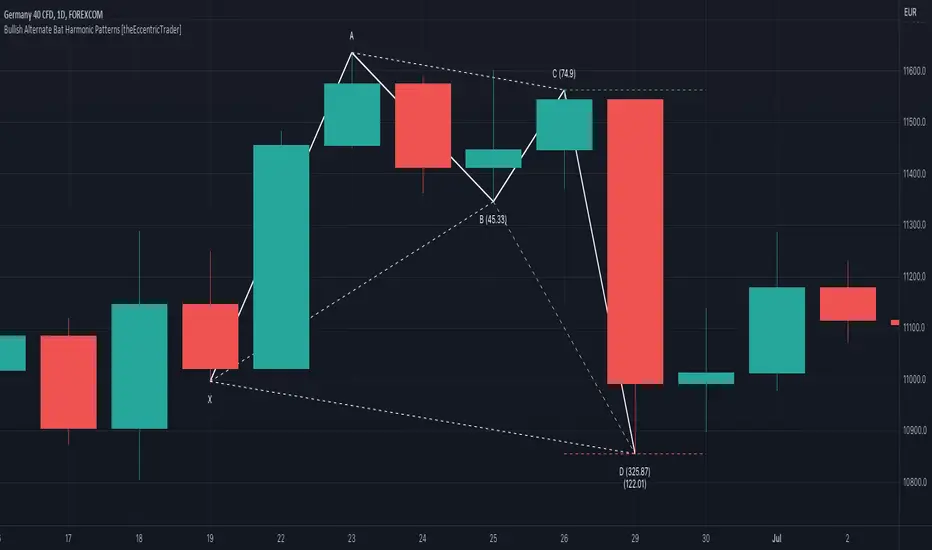
Bearish 5-0 Harmonic Patterns [theEccentricTrader]█ OVERVIEW
This indicator automatically draws bearish 5-0 harmonic patterns and price projections derived from the ranges that constitute the patterns.
█ CONCEPTS
Green and Red Candles
• A green candle is one that closes with a close price equal to or above the price it opened.
• A red candle is one that closes with a close price that is lower than the price it opened.
Swing Highs and Swing Lows
• A swing high is a green candle or series of consecutive green candles followed by a single red candle to complete the swing and form the peak.
• A swing low is a red candle or series of consecutive red candles followed by a single green candle to complete the swing and form the trough.
Peak and Trough Prices (Basic)
• The peak price of a complete swing high is the high price of either the red candle that completes the swing high or the high price of the preceding green candle, depending on which is higher.
• The trough price of a complete swing low is the low price of either the green candle that completes the swing low or the low price of the preceding red candle, depending on which is lower.
Historic Peaks and Troughs
The current, or most recent, peak and trough occurrences are referred to as occurrence zero. Previous peak and trough occurrences are referred to as historic and ordered numerically from right to left, with the most recent historic peak and trough occurrences being occurrence one.
Range
The range is simply the difference between the current peak and current trough prices, generally expressed in terms of points or pips.
Support and Resistance
• Support refers to a price level where the demand for an asset is strong enough to prevent the price from falling further.
• Resistance refers to a price level where the supply of an asset is strong enough to prevent the price from rising further.
Support and resistance levels are important because they can help traders identify where the price of an asset might pause or reverse its direction, offering potential entry and exit points. For example, a trader might look to buy an asset when it approaches a support level , with the expectation that the price will bounce back up. Alternatively, a trader might look to sell an asset when it approaches a resistance level , with the expectation that the price will drop back down.
It's important to note that support and resistance levels are not always relevant, and the price of an asset can also break through these levels and continue moving in the same direction.
Upper Trends
• A return line uptrend is formed when the current peak price is higher than the preceding peak price.
• A downtrend is formed when the current peak price is lower than the preceding peak price.
• A double-top is formed when the current peak price is equal to the preceding peak price.
Lower Trends
• An uptrend is formed when the current trough price is higher than the preceding trough price.
• A return line downtrend is formed when the current trough price is lower than the preceding trough price.
• A double-bottom is formed when the current trough price is equal to the preceding trough price.
Muti-Part Upper and Lower Trends
• A multi-part return line uptrend begins with the formation of a new return line uptrend, or higher peak, and continues until a new downtrend, or lower peak, completes the trend.
• A multi-part downtrend begins with the formation of a new downtrend, or lower peak, and continues until a new return line uptrend, or higher peak, completes the trend.
• A multi-part uptrend begins with the formation of a new uptrend, or higher trough, and continues until a new return line downtrend, or lower trough, completes the trend.
• A multi-part return line downtrend begins with the formation of a new return line downtrend, or lower trough, and continues until a new uptrend, or higher trough, completes the trend.
Wave Cycles
A wave cycle is here defined as a complete two-part move between a swing high and a swing low, or a swing low and a swing high. The first swing high or swing low will set the course for the sequence of wave cycles that follow; for example a chart that begins with a swing low will form its first complete wave cycle upon the formation of the first complete swing high and vice versa.
Figure 1.
Fibonacci Retracement and Extension Ratios
The Fibonacci sequence is a series of numbers in which each number is the sum of the two preceding numbers, starting with 0 and 1. For example 0 + 1 = 1, 1 + 1 = 2, 1 + 2 = 3, and so on. Ultimately, we could go on forever but the first few numbers in the sequence are as follows: 0 , 1, 1, 2, 3, 5, 8, 13, 21, 34, 55, 89, 144.
The extension ratios are calculated by dividing each number in the sequence by the number preceding it. For example 0/1 = 0, 1/1 = 1, 2/1 = 2, 3/2 = 1.5, 5/3 = 1.6666..., 8/5 = 1.6, 13/8 = 1.625, 21/13 = 1.6153..., 34/21 = 1.6190..., 55/34 = 1.6176..., 89/55 = 1.6181..., 144/89 = 1.6179..., and so on. The retracement ratios are calculated by inverting this process and dividing each number in the sequence by the number proceeding it. For example 0/1 = 0, 1/1 = 1, 1/2 = 0.5, 2/3 = 0.666..., 3/5 = 0.6, 5/8 = 0.625, 8/13 = 0.6153..., 13/21 = 0.6190..., 21/34 = 0.6176..., 34/55 = 0.6181..., 55/89 = 0.6179..., 89/144 = 0.6180..., and so on.
1.618 is considered to be the 'golden ratio', found in many natural phenomena such as the growth of seashells and the branching of trees. Some now speculate the universe oscillates at a frequency of 0,618 Hz, which could help to explain such phenomena, but this theory has yet to be proven.
Traders and analysts use Fibonacci retracement and extension indicators, consisting of horizontal lines representing different Fibonacci ratios, for identifying potential levels of support and resistance. Fibonacci ranges are typically drawn from left to right, with retracement levels representing ratios inside of the current range and extension levels representing ratios extended outside of the current range. If the current wave cycle ends on a swing low, the Fibonacci range is drawn from peak to trough. If the current wave cycle ends on a swing high the Fibonacci range is drawn from trough to peak.
Harmonic Patterns
The concept of harmonic patterns in trading was first introduced by H.M. Gartley in his book "Profits in the Stock Market", published in 1935. Gartley observed that markets have a tendency to move in repetitive patterns, and he identified several specific patterns that he believed could be used to predict future price movements.
Since then, many other traders and analysts have built upon Gartley's work and developed their own variations of harmonic patterns. One such contributor is Larry Pesavento, who developed his own methods for measuring harmonic patterns using Fibonacci ratios. Pesavento has written several books on the subject of harmonic patterns and Fibonacci ratios in trading. Another notable contributor to harmonic patterns is Scott Carney, who developed his own approach to harmonic trading in the late 1990s and also popularised the use of Fibonacci ratios to measure harmonic patterns. Carney expanded on Gartley's work and also introduced several new harmonic patterns, such as the Shark pattern and the 5-0 pattern.
The bullish and bearish Gartley patterns are the oldest recognized harmonic patterns in trading and all the other harmonic patterns are ultimately modifications of the original Gartley patterns. Gartley patterns are fundamentally composed of 5 points, or 4 waves.
Bullish and Bearish 5-0 Patterns
• Bullish 5-0 patterns are fundamentally composed of three peaks and three troughs, with the second peak being lower than the first peak and the third peak being higher than the first peak. And similarly, the second trough being lower than the first trough and the third trough being higher than both the first and second troughs.
• Bearish 5-0 patterns are fundamentally composed of three troughs and three peaks, with the second trough being higher than the first trough and the third trough being lower than the first trough. And similarly, the second peak being higher than the first peak and the third peak being lower than both the first and second peaks.
The ratio measurements recommended by Scott Carney, who originated the pattern, are as follows:
• Wave 1 of the pattern, referred to as OX, has no specific ratio requirements.
• Wave 2 of the pattern, referred to as XA, has no specific ratio requirements.
• Wave 3 of the pattern, referred to as AB, should extend to at least 113%, but no further than 161.8% of the range set by wave 2.
• Wave 4 of the pattern, referred to as BC, should extend to at least 161.8%, but no further than 224% of the range set by wave 3.
• Wave 5 of the pattern, referred to as CD, should retrace to 50.0% of the range set by wave 4.
Measurement Tolerances
In general, tolerance in measurements refers to the allowable variation or deviation from a specific value or dimension. It is the range within which a particular measurement is considered to be acceptable or accurate. In this script I have applied this concept to the measurement of harmonic pattern ratios to increase to the frequency of pattern occurrences.
For example, the AB measurement of Gartley patterns is generally set at around 61.8%, but with such specificity in the measuring requirements the patterns are very rare. We can increase the frequency of pattern occurrences by setting a tolerance. A tolerance of 10% to both downside and upside, which is the default setting for all tolerances, means we would have a tolerable measurement range between 51.8-71.8%, thus increasing the frequency of occurrence.
█ FEATURES
Inputs
• AB Lower Tolerance
• AB Upper Tolerance
• BC Lower Tolerance
• BC Upper Tolerance
• CD Lower Tolerance
• CD Upper Tolerance
• Pattern Color
• Label Color
• Show Projections
• Extend Current Projection Lines
█ LIMITATIONS
All green and red candle calculations are based on differences between open and close prices, as such I have made no attempt to account for green candles that gap lower and close below the close price of the preceding candle, or red candles that gap higher and close above the close price of the preceding candle. This may cause some unexpected behaviour on some markets and timeframes. I can only recommend using 24-hour markets, if and where possible, as there are far fewer gaps and, generally, more data to work with.
█ NOTES
Here is a link to Scott's harmonic patterns webpage for those who may be interested: harmonictrader.com
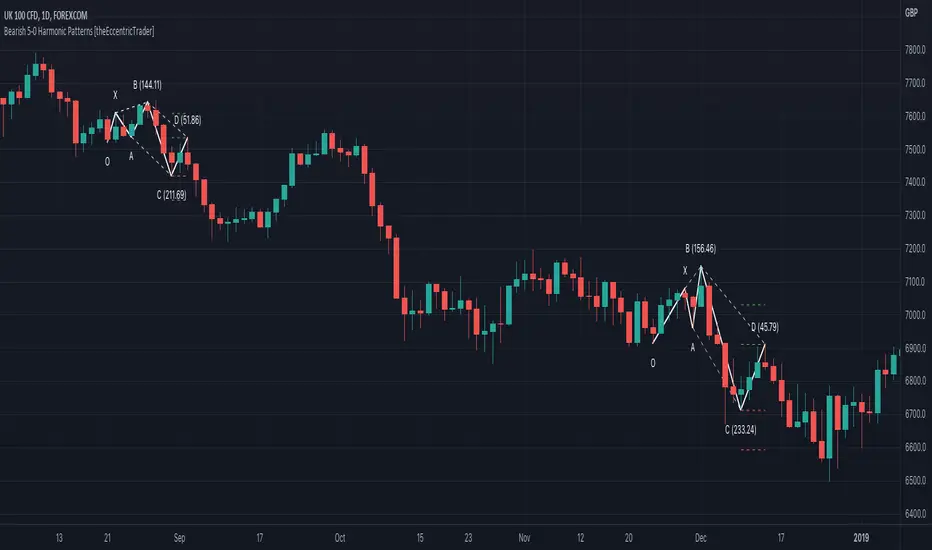
Bullish 5-0 Harmonic Patterns [theEccentricTrader]█ OVERVIEW
This indicator automatically draws bullish 5-0 harmonic patterns and price projections derived from the ranges that constitute the patterns.
█ CONCEPTS
Green and Red Candles
• A green candle is one that closes with a close price equal to or above the price it opened.
• A red candle is one that closes with a close price that is lower than the price it opened.
Swing Highs and Swing Lows
• A swing high is a green candle or series of consecutive green candles followed by a single red candle to complete the swing and form the peak.
• A swing low is a red candle or series of consecutive red candles followed by a single green candle to complete the swing and form the trough.
Peak and Trough Prices (Basic)
• The peak price of a complete swing high is the high price of either the red candle that completes the swing high or the high price of the preceding green candle, depending on which is higher.
• The trough price of a complete swing low is the low price of either the green candle that completes the swing low or the low price of the preceding red candle, depending on which is lower.
Historic Peaks and Troughs
The current, or most recent, peak and trough occurrences are referred to as occurrence zero. Previous peak and trough occurrences are referred to as historic and ordered numerically from right to left, with the most recent historic peak and trough occurrences being occurrence one.
Range
The range is simply the difference between the current peak and current trough prices, generally expressed in terms of points or pips.
Support and Resistance
• Support refers to a price level where the demand for an asset is strong enough to prevent the price from falling further.
• Resistance refers to a price level where the supply of an asset is strong enough to prevent the price from rising further.
Support and resistance levels are important because they can help traders identify where the price of an asset might pause or reverse its direction, offering potential entry and exit points. For example, a trader might look to buy an asset when it approaches a support level , with the expectation that the price will bounce back up. Alternatively, a trader might look to sell an asset when it approaches a resistance level , with the expectation that the price will drop back down.
It's important to note that support and resistance levels are not always relevant, and the price of an asset can also break through these levels and continue moving in the same direction.
Upper Trends
• A return line uptrend is formed when the current peak price is higher than the preceding peak price.
• A downtrend is formed when the current peak price is lower than the preceding peak price.
• A double-top is formed when the current peak price is equal to the preceding peak price.
Lower Trends
• An uptrend is formed when the current trough price is higher than the preceding trough price.
• A return line downtrend is formed when the current trough price is lower than the preceding trough price.
• A double-bottom is formed when the current trough price is equal to the preceding trough price.
Muti-Part Upper and Lower Trends
• A multi-part return line uptrend begins with the formation of a new return line uptrend, or higher peak, and continues until a new downtrend, or lower peak, completes the trend.
• A multi-part downtrend begins with the formation of a new downtrend, or lower peak, and continues until a new return line uptrend, or higher peak, completes the trend.
• A multi-part uptrend begins with the formation of a new uptrend, or higher trough, and continues until a new return line downtrend, or lower trough, completes the trend.
• A multi-part return line downtrend begins with the formation of a new return line downtrend, or lower trough, and continues until a new uptrend, or higher trough, completes the trend.
Wave Cycles
A wave cycle is here defined as a complete two-part move between a swing high and a swing low, or a swing low and a swing high. The first swing high or swing low will set the course for the sequence of wave cycles that follow; for example a chart that begins with a swing low will form its first complete wave cycle upon the formation of the first complete swing high and vice versa.
Figure 1.
Fibonacci Retracement and Extension Ratios
The Fibonacci sequence is a series of numbers in which each number is the sum of the two preceding numbers, starting with 0 and 1. For example 0 + 1 = 1, 1 + 1 = 2, 1 + 2 = 3, and so on. Ultimately, we could go on forever but the first few numbers in the sequence are as follows: 0 , 1, 1, 2, 3, 5, 8, 13, 21, 34, 55, 89, 144.
The extension ratios are calculated by dividing each number in the sequence by the number preceding it. For example 0/1 = 0, 1/1 = 1, 2/1 = 2, 3/2 = 1.5, 5/3 = 1.6666..., 8/5 = 1.6, 13/8 = 1.625, 21/13 = 1.6153..., 34/21 = 1.6190..., 55/34 = 1.6176..., 89/55 = 1.6181..., 144/89 = 1.6179..., and so on. The retracement ratios are calculated by inverting this process and dividing each number in the sequence by the number proceeding it. For example 0/1 = 0, 1/1 = 1, 1/2 = 0.5, 2/3 = 0.666..., 3/5 = 0.6, 5/8 = 0.625, 8/13 = 0.6153..., 13/21 = 0.6190..., 21/34 = 0.6176..., 34/55 = 0.6181..., 55/89 = 0.6179..., 89/144 = 0.6180..., and so on.
1.618 is considered to be the 'golden ratio', found in many natural phenomena such as the growth of seashells and the branching of trees. Some now speculate the universe oscillates at a frequency of 0,618 Hz, which could help to explain such phenomena, but this theory has yet to be proven.
Traders and analysts use Fibonacci retracement and extension indicators, consisting of horizontal lines representing different Fibonacci ratios, for identifying potential levels of support and resistance. Fibonacci ranges are typically drawn from left to right, with retracement levels representing ratios inside of the current range and extension levels representing ratios extended outside of the current range. If the current wave cycle ends on a swing low, the Fibonacci range is drawn from peak to trough. If the current wave cycle ends on a swing high the Fibonacci range is drawn from trough to peak.
Harmonic Patterns
The concept of harmonic patterns in trading was first introduced by H.M. Gartley in his book "Profits in the Stock Market", published in 1935. Gartley observed that markets have a tendency to move in repetitive patterns, and he identified several specific patterns that he believed could be used to predict future price movements.
Since then, many other traders and analysts have built upon Gartley's work and developed their own variations of harmonic patterns. One such contributor is Larry Pesavento, who developed his own methods for measuring harmonic patterns using Fibonacci ratios. Pesavento has written several books on the subject of harmonic patterns and Fibonacci ratios in trading. Another notable contributor to harmonic patterns is Scott Carney, who developed his own approach to harmonic trading in the late 1990s and also popularised the use of Fibonacci ratios to measure harmonic patterns. Carney expanded on Gartley's work and also introduced several new harmonic patterns, such as the Shark pattern and the 5-0 pattern.
The bullish and bearish Gartley patterns are the oldest recognized harmonic patterns in trading and all the other harmonic patterns are ultimately modifications of the original Gartley patterns. Gartley patterns are fundamentally composed of 5 points, or 4 waves.
Bullish and Bearish 5-0 Patterns
• Bullish 5-0 patterns are fundamentally composed of three peaks and three troughs, with the second peak being lower than the first peak and the third peak being higher than the first peak. And similarly, the second trough being lower than the first trough and the third trough being higher than both the first and second troughs.
• Bearish 5-0 patterns are fundamentally composed of three troughs and three peaks, with the second trough being higher than the first trough and the third trough being lower than the first trough. And similarly, the second peak being higher than the first peak and the third peak being lower than both the first and second peaks.
The ratio measurements recommended by Scott Carney, who originated the pattern, are as follows:
• Wave 1 of the pattern, referred to as OX, has no specific ratio requirements.
• Wave 2 of the pattern, referred to as XA, has no specific ratio requirements.
• Wave 3 of the pattern, referred to as AB, should extend to at least 113%, but no further than 161.8% of the range set by wave 2.
• Wave 4 of the pattern, referred to as BC, should extend to at least 161.8%, but no further than 224% of the range set by wave 3.
• Wave 5 of the pattern, referred to as CD, should retrace to 50.0% of the range set by wave 4.
Measurement Tolerances
In general, tolerance in measurements refers to the allowable variation or deviation from a specific value or dimension. It is the range within which a particular measurement is considered to be acceptable or accurate. In this script I have applied this concept to the measurement of harmonic pattern ratios to increase to the frequency of pattern occurrences.
For example, the AB measurement of Gartley patterns is generally set at around 61.8%, but with such specificity in the measuring requirements the patterns are very rare. We can increase the frequency of pattern occurrences by setting a tolerance. A tolerance of 10% to both downside and upside, which is the default setting for all tolerances, means we would have a tolerable measurement range between 51.8-71.8%, thus increasing the frequency of occurrence.
█ FEATURES
Inputs
• AB Lower Tolerance
• AB Upper Tolerance
• BC Lower Tolerance
• BC Upper Tolerance
• CD Lower Tolerance
• CD Upper Tolerance
• Pattern Color
• Label Color
• Show Projections
• Extend Current Projection Lines
█ LIMITATIONS
All green and red candle calculations are based on differences between open and close prices, as such I have made no attempt to account for green candles that gap lower and close below the close price of the preceding candle, or red candles that gap higher and close above the close price of the preceding candle. This may cause some unexpected behaviour on some markets and timeframes. I can only recommend using 24-hour markets, if and where possible, as there are far fewer gaps and, generally, more data to work with.
█ NOTES
Here is a link to Scott's harmonic patterns webpage for those who may be interested: harmonictrader.com

Bearish Shark Harmonic Patterns [theEccentricTrader]█ OVERVIEW
This indicator automatically draws bearish Shark harmonic patterns and price projections derived from the ranges that constitute the patterns.
█ CONCEPTS
Green and Red Candles
• A green candle is one that closes with a close price equal to or above the price it opened.
• A red candle is one that closes with a close price that is lower than the price it opened.
Swing Highs and Swing Lows
• A swing high is a green candle or series of consecutive green candles followed by a single red candle to complete the swing and form the peak.
• A swing low is a red candle or series of consecutive red candles followed by a single green candle to complete the swing and form the trough.
Peak and Trough Prices (Basic)
• The peak price of a complete swing high is the high price of either the red candle that completes the swing high or the high price of the preceding green candle, depending on which is higher.
• The trough price of a complete swing low is the low price of either the green candle that completes the swing low or the low price of the preceding red candle, depending on which is lower.
Historic Peaks and Troughs
The current, or most recent, peak and trough occurrences are referred to as occurrence zero. Previous peak and trough occurrences are referred to as historic and ordered numerically from right to left, with the most recent historic peak and trough occurrences being occurrence one.
Range
The range is simply the difference between the current peak and current trough prices, generally expressed in terms of points or pips.
Support and Resistance
• Support refers to a price level where the demand for an asset is strong enough to prevent the price from falling further.
• Resistance refers to a price level where the supply of an asset is strong enough to prevent the price from rising further.
Support and resistance levels are important because they can help traders identify where the price of an asset might pause or reverse its direction, offering potential entry and exit points. For example, a trader might look to buy an asset when it approaches a support level , with the expectation that the price will bounce back up. Alternatively, a trader might look to sell an asset when it approaches a resistance level , with the expectation that the price will drop back down.
It's important to note that support and resistance levels are not always relevant, and the price of an asset can also break through these levels and continue moving in the same direction.
Upper Trends
• A return line uptrend is formed when the current peak price is higher than the preceding peak price.
• A downtrend is formed when the current peak price is lower than the preceding peak price.
• A double-top is formed when the current peak price is equal to the preceding peak price.
Lower Trends
• An uptrend is formed when the current trough price is higher than the preceding trough price.
• A return line downtrend is formed when the current trough price is lower than the preceding trough price.
• A double-bottom is formed when the current trough price is equal to the preceding trough price.
Muti-Part Upper and Lower Trends
• A multi-part return line uptrend begins with the formation of a new return line uptrend, or higher peak, and continues until a new downtrend, or lower peak, completes the trend.
• A multi-part downtrend begins with the formation of a new downtrend, or lower peak, and continues until a new return line uptrend, or higher peak, completes the trend.
• A multi-part uptrend begins with the formation of a new uptrend, or higher trough, and continues until a new return line downtrend, or lower trough, completes the trend.
• A multi-part return line downtrend begins with the formation of a new return line downtrend, or lower trough, and continues until a new uptrend, or higher trough, completes the trend.
Wave Cycles
A wave cycle is here defined as a complete two-part move between a swing high and a swing low, or a swing low and a swing high. The first swing high or swing low will set the course for the sequence of wave cycles that follow; for example a chart that begins with a swing low will form its first complete wave cycle upon the formation of the first complete swing high and vice versa.
Figure 1.
Fibonacci Retracement and Extension Ratios
The Fibonacci sequence is a series of numbers in which each number is the sum of the two preceding numbers, starting with 0 and 1. For example 0 + 1 = 1, 1 + 1 = 2, 1 + 2 = 3, and so on. Ultimately, we could go on forever but the first few numbers in the sequence are as follows: 0 , 1, 1, 2, 3, 5, 8, 13, 21, 34, 55, 89, 144.
The extension ratios are calculated by dividing each number in the sequence by the number preceding it. For example 0/1 = 0, 1/1 = 1, 2/1 = 2, 3/2 = 1.5, 5/3 = 1.6666..., 8/5 = 1.6, 13/8 = 1.625, 21/13 = 1.6153..., 34/21 = 1.6190..., 55/34 = 1.6176..., 89/55 = 1.6181..., 144/89 = 1.6179..., and so on. The retracement ratios are calculated by inverting this process and dividing each number in the sequence by the number proceeding it. For example 0/1 = 0, 1/1 = 1, 1/2 = 0.5, 2/3 = 0.666..., 3/5 = 0.6, 5/8 = 0.625, 8/13 = 0.6153..., 13/21 = 0.6190..., 21/34 = 0.6176..., 34/55 = 0.6181..., 55/89 = 0.6179..., 89/144 = 0.6180..., and so on.
1.618 is considered to be the 'golden ratio', found in many natural phenomena such as the growth of seashells and the branching of trees. Some now speculate the universe oscillates at a frequency of 0,618 Hz, which could help to explain such phenomena, but this theory has yet to be proven.
Traders and analysts use Fibonacci retracement and extension indicators, consisting of horizontal lines representing different Fibonacci ratios, for identifying potential levels of support and resistance. Fibonacci ranges are typically drawn from left to right, with retracement levels representing ratios inside of the current range and extension levels representing ratios extended outside of the current range. If the current wave cycle ends on a swing low, the Fibonacci range is drawn from peak to trough. If the current wave cycle ends on a swing high the Fibonacci range is drawn from trough to peak.
Harmonic Patterns
The concept of harmonic patterns in trading was first introduced by H.M. Gartley in his book "Profits in the Stock Market", published in 1935. Gartley observed that markets have a tendency to move in repetitive patterns, and he identified several specific patterns that he believed could be used to predict future price movements.
Since then, many other traders and analysts have built upon Gartley's work and developed their own variations of harmonic patterns. One such contributor is Larry Pesavento, who developed his own methods for measuring harmonic patterns using Fibonacci ratios. Pesavento has written several books on the subject of harmonic patterns and Fibonacci ratios in trading. Another notable contributor to harmonic patterns is Scott Carney, who developed his own approach to harmonic trading in the late 1990s and also popularised the use of Fibonacci ratios to measure harmonic patterns. Carney expanded on Gartley's work and also introduced several new harmonic patterns, such as the Shark pattern and the 5-0 pattern.
The bullish and bearish Gartley patterns are the oldest recognized harmonic patterns in trading and all the other harmonic patterns are ultimately modifications of the original Gartley patterns. Gartley patterns are fundamentally composed of 5 points, or 4 waves.
Bullish and Bearish Shark Patterns
• Bullish shark patterns are fundamentally composed of three troughs and two peaks, with the second peak being higher than the first peak and the second trough being higher than the first trough. The third trough must be lower than the second trough but can be above or below the first trough providing it meets the ratio requirements.
• Bearish shark patterns are fundamentally composed of three peaks and two troughs, with the second trough being lower than the first trough and the second peak being lower than the first peak. The third peak must be higher than the second peak but can be above or below the first peak providing it meets the ratio requirements.
The ratio measurements recommended by Scott Carney, who originated the pattern, are as follows:
• Wave 1 of the pattern, referred to as OX, has no specific ratio requirements.
• Wave 2 of the pattern, referred to as XA, has no specific ratio requirements.
• Wave 3 of the pattern, referred to as AB, should extend to at least 113%, but no further than 161.8% of the range set by wave 2.
• Wave 4 of the pattern, referred to as BC, should extend to at least 161.8%, but no further than 224% of the range set by wave 3.
• The last measure, referred to as XC, is that of wave 4 as a ratio of the range set by wave 1, which should extend to at least 88.6%, but no further than 113%.
Measurement Tolerances
In general, tolerance in measurements refers to the allowable variation or deviation from a specific value or dimension. It is the range within which a particular measurement is considered to be acceptable or accurate. In this script I have applied this concept to the measurement of harmonic pattern ratios to increase to the frequency of pattern occurrences.
For example, the AB measurement of Gartley patterns is generally set at around 61.8%, but with such specificity in the measuring requirements the patterns are very rare. We can increase the frequency of pattern occurrences by setting a tolerance. A tolerance of 10% to both downside and upside, which is the default setting for all tolerances, means we would have a tolerable measurement range between 51.8-71.8%, thus increasing the frequency of occurrence.
█ FEATURES
Inputs
• AB Lower Tolerance
• AB Upper Tolerance
• BC Lower Tolerance
• BC Upper Tolerance
• XC Lower Tolerance
• XC Upper Tolerance
• Pattern Color
• Label Color
• Show Projections
• Extend Current Projection Lines
█ LIMITATIONS
All green and red candle calculations are based on differences between open and close prices, as such I have made no attempt to account for green candles that gap lower and close below the close price of the preceding candle, or red candles that gap higher and close above the close price of the preceding candle. This may cause some unexpected behaviour on some markets and timeframes. I can only recommend using 24-hour markets, if and where possible, as there are far fewer gaps and, generally, more data to work with.
█ NOTES
Here is a link to Scott's harmonic patterns webpage for those who may be interested: harmonictrader.com
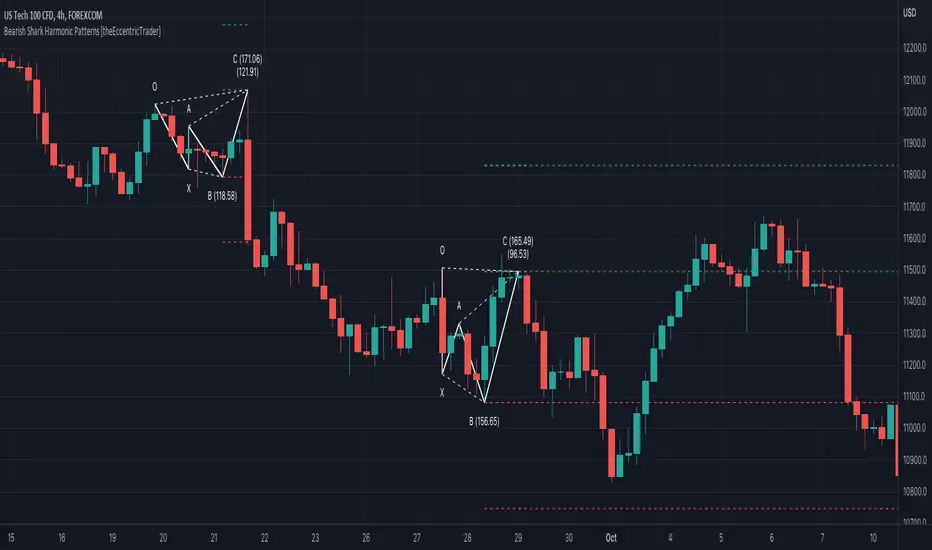
Bullish Shark Harmonic Patterns [theEccentricTrader]█ OVERVIEW
This indicator automatically draws bullish Shark harmonic patterns and price projections derived from the ranges that constitute the patterns.
█ CONCEPTS
Green and Red Candles
• A green candle is one that closes with a close price equal to or above the price it opened.
• A red candle is one that closes with a close price that is lower than the price it opened.
Swing Highs and Swing Lows
• A swing high is a green candle or series of consecutive green candles followed by a single red candle to complete the swing and form the peak.
• A swing low is a red candle or series of consecutive red candles followed by a single green candle to complete the swing and form the trough.
Peak and Trough Prices (Basic)
• The peak price of a complete swing high is the high price of either the red candle that completes the swing high or the high price of the preceding green candle, depending on which is higher.
• The trough price of a complete swing low is the low price of either the green candle that completes the swing low or the low price of the preceding red candle, depending on which is lower.
Historic Peaks and Troughs
The current, or most recent, peak and trough occurrences are referred to as occurrence zero. Previous peak and trough occurrences are referred to as historic and ordered numerically from right to left, with the most recent historic peak and trough occurrences being occurrence one.
Range
The range is simply the difference between the current peak and current trough prices, generally expressed in terms of points or pips.
Support and Resistance
• Support refers to a price level where the demand for an asset is strong enough to prevent the price from falling further.
• Resistance refers to a price level where the supply of an asset is strong enough to prevent the price from rising further.
Support and resistance levels are important because they can help traders identify where the price of an asset might pause or reverse its direction, offering potential entry and exit points. For example, a trader might look to buy an asset when it approaches a support level , with the expectation that the price will bounce back up. Alternatively, a trader might look to sell an asset when it approaches a resistance level , with the expectation that the price will drop back down.
It's important to note that support and resistance levels are not always relevant, and the price of an asset can also break through these levels and continue moving in the same direction.
Upper Trends
• A return line uptrend is formed when the current peak price is higher than the preceding peak price.
• A downtrend is formed when the current peak price is lower than the preceding peak price.
• A double-top is formed when the current peak price is equal to the preceding peak price.
Lower Trends
• An uptrend is formed when the current trough price is higher than the preceding trough price.
• A return line downtrend is formed when the current trough price is lower than the preceding trough price.
• A double-bottom is formed when the current trough price is equal to the preceding trough price.
Muti-Part Upper and Lower Trends
• A multi-part return line uptrend begins with the formation of a new return line uptrend, or higher peak, and continues until a new downtrend, or lower peak, completes the trend.
• A multi-part downtrend begins with the formation of a new downtrend, or lower peak, and continues until a new return line uptrend, or higher peak, completes the trend.
• A multi-part uptrend begins with the formation of a new uptrend, or higher trough, and continues until a new return line downtrend, or lower trough, completes the trend.
• A multi-part return line downtrend begins with the formation of a new return line downtrend, or lower trough, and continues until a new uptrend, or higher trough, completes the trend.
Wave Cycles
A wave cycle is here defined as a complete two-part move between a swing high and a swing low, or a swing low and a swing high. The first swing high or swing low will set the course for the sequence of wave cycles that follow; for example a chart that begins with a swing low will form its first complete wave cycle upon the formation of the first complete swing high and vice versa.
Figure 1.
Fibonacci Retracement and Extension Ratios
The Fibonacci sequence is a series of numbers in which each number is the sum of the two preceding numbers, starting with 0 and 1. For example 0 + 1 = 1, 1 + 1 = 2, 1 + 2 = 3, and so on. Ultimately, we could go on forever but the first few numbers in the sequence are as follows: 0 , 1, 1, 2, 3, 5, 8, 13, 21, 34, 55, 89, 144.
The extension ratios are calculated by dividing each number in the sequence by the number preceding it. For example 0/1 = 0, 1/1 = 1, 2/1 = 2, 3/2 = 1.5, 5/3 = 1.6666..., 8/5 = 1.6, 13/8 = 1.625, 21/13 = 1.6153..., 34/21 = 1.6190..., 55/34 = 1.6176..., 89/55 = 1.6181..., 144/89 = 1.6179..., and so on. The retracement ratios are calculated by inverting this process and dividing each number in the sequence by the number proceeding it. For example 0/1 = 0, 1/1 = 1, 1/2 = 0.5, 2/3 = 0.666..., 3/5 = 0.6, 5/8 = 0.625, 8/13 = 0.6153..., 13/21 = 0.6190..., 21/34 = 0.6176..., 34/55 = 0.6181..., 55/89 = 0.6179..., 89/144 = 0.6180..., and so on.
1.618 is considered to be the 'golden ratio', found in many natural phenomena such as the growth of seashells and the branching of trees. Some now speculate the universe oscillates at a frequency of 0,618 Hz, which could help to explain such phenomena, but this theory has yet to be proven.
Traders and analysts use Fibonacci retracement and extension indicators, consisting of horizontal lines representing different Fibonacci ratios, for identifying potential levels of support and resistance. Fibonacci ranges are typically drawn from left to right, with retracement levels representing ratios inside of the current range and extension levels representing ratios extended outside of the current range. If the current wave cycle ends on a swing low, the Fibonacci range is drawn from peak to trough. If the current wave cycle ends on a swing high the Fibonacci range is drawn from trough to peak.
Harmonic Patterns
The concept of harmonic patterns in trading was first introduced by H.M. Gartley in his book "Profits in the Stock Market", published in 1935. Gartley observed that markets have a tendency to move in repetitive patterns, and he identified several specific patterns that he believed could be used to predict future price movements.
Since then, many other traders and analysts have built upon Gartley's work and developed their own variations of harmonic patterns. One such contributor is Larry Pesavento, who developed his own methods for measuring harmonic patterns using Fibonacci ratios. Pesavento has written several books on the subject of harmonic patterns and Fibonacci ratios in trading. Another notable contributor to harmonic patterns is Scott Carney, who developed his own approach to harmonic trading in the late 1990s and also popularised the use of Fibonacci ratios to measure harmonic patterns. Carney expanded on Gartley's work and also introduced several new harmonic patterns, such as the Shark pattern and the 5-0 pattern.
The bullish and bearish Gartley patterns are the oldest recognized harmonic patterns in trading and all the other harmonic patterns are ultimately modifications of the original Gartley patterns. Gartley patterns are fundamentally composed of 5 points, or 4 waves.
Bullish and Bearish Shark Patterns
• Bullish shark patterns are fundamentally composed of three troughs and two peaks, with the second peak being higher than the first peak and the second trough being higher than the first trough. The third trough must be lower than the second trough but can be above or below the first trough providing it meets the ratio requirements.
• Bearish shark patterns are fundamentally composed of three peaks and two troughs, with the second trough being lower than the first trough and the second peak being lower than the first peak. The third peak must be higher than the second peak but can be above or below the first peak providing it meets the ratio requirements.
The ratio measurements recommended by Scott Carney, who originated the pattern, are as follows:
• Wave 1 of the pattern, referred to as OX, has no specific ratio requirements.
• Wave 2 of the pattern, referred to as XA, has no specific ratio requirements.
• Wave 3 of the pattern, referred to as AB, should extend to at least 113%, but no further than 161.8% of the range set by wave 2.
• Wave 4 of the pattern, referred to as BC, should extend to at least 161.8%, but no further than 224% of the range set by wave 3.
• The last measure, referred to as XC, is that of wave 4 as a ratio of the range set by wave 1, which should extend to at least 88.6%, but no further than 113%.
Measurement Tolerances
In general, tolerance in measurements refers to the allowable variation or deviation from a specific value or dimension. It is the range within which a particular measurement is considered to be acceptable or accurate. In this script I have applied this concept to the measurement of harmonic pattern ratios to increase to the frequency of pattern occurrences.
For example, the AB measurement of Gartley patterns is generally set at around 61.8%, but with such specificity in the measuring requirements the patterns are very rare. We can increase the frequency of pattern occurrences by setting a tolerance. A tolerance of 10% to both downside and upside, which is the default setting for all tolerances, means we would have a tolerable measurement range between 51.8-71.8%, thus increasing the frequency of occurrence.
█ FEATURES
Inputs
• AB Lower Tolerance
• AB Upper Tolerance
• BC Lower Tolerance
• BC Upper Tolerance
• XC Lower Tolerance
• XC Upper Tolerance
• Pattern Color
• Label Color
• Show Projections
• Extend Current Projection Lines
█ LIMITATIONS
All green and red candle calculations are based on differences between open and close prices, as such I have made no attempt to account for green candles that gap lower and close below the close price of the preceding candle, or red candles that gap higher and close above the close price of the preceding candle. This may cause some unexpected behaviour on some markets and timeframes. I can only recommend using 24-hour markets, if and where possible, as there are far fewer gaps and, generally, more data to work with.
█ NOTES
Here is a link to Scott's harmonic patterns webpage for those who may be interested: harmonictrader.com
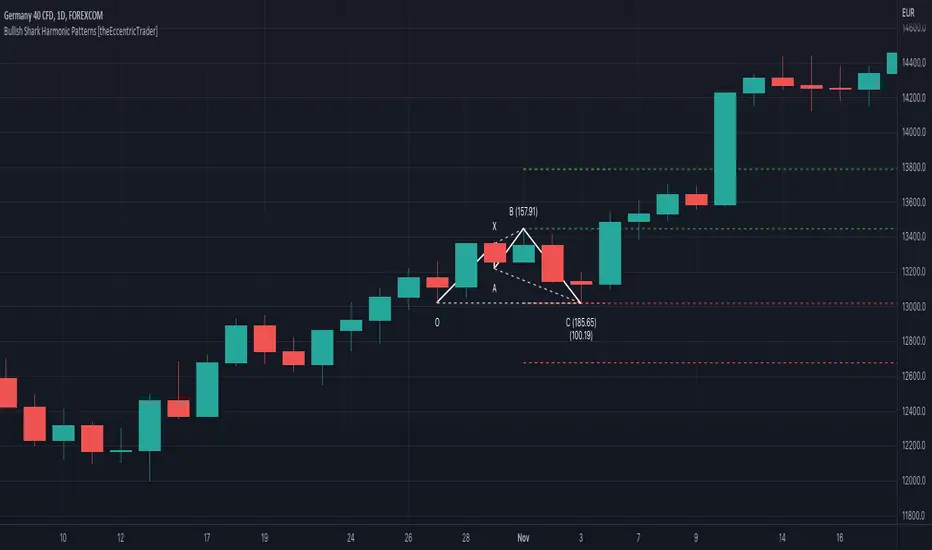
Bearish ABCD Harmonic Patterns [theEccentricTrader]█ OVERVIEW
This indicator automatically draws bearish ABCD harmonic patterns and price projections derived from the ranges that constitute the patterns.
█ CONCEPTS
Green and Red Candles
• A green candle is one that closes with a close price equal to or above the price it opened.
• A red candle is one that closes with a close price that is lower than the price it opened.
Swing Highs and Swing Lows
• A swing high is a green candle or series of consecutive green candles followed by a single red candle to complete the swing and form the peak.
• A swing low is a red candle or series of consecutive red candles followed by a single green candle to complete the swing and form the trough.
Peak and Trough Prices (Basic)
• The peak price of a complete swing high is the high price of either the red candle that completes the swing high or the high price of the preceding green candle, depending on which is higher.
• The trough price of a complete swing low is the low price of either the green candle that completes the swing low or the low price of the preceding red candle, depending on which is lower.
Historic Peaks and Troughs
The current, or most recent, peak and trough occurrences are referred to as occurrence zero. Previous peak and trough occurrences are referred to as historic and ordered numerically from right to left, with the most recent historic peak and trough occurrences being occurrence one.
Range
The range is simply the difference between the current peak and current trough prices, generally expressed in terms of points or pips.
Support and Resistance
• Support refers to a price level where the demand for an asset is strong enough to prevent the price from falling further.
• Resistance refers to a price level where the supply of an asset is strong enough to prevent the price from rising further.
Support and resistance levels are important because they can help traders identify where the price of an asset might pause or reverse its direction, offering potential entry and exit points. For example, a trader might look to buy an asset when it approaches a support level , with the expectation that the price will bounce back up. Alternatively, a trader might look to sell an asset when it approaches a resistance level , with the expectation that the price will drop back down.
It's important to note that support and resistance levels are not always relevant, and the price of an asset can also break through these levels and continue moving in the same direction.
Upper Trends
• A return line uptrend is formed when the current peak price is higher than the preceding peak price.
• A downtrend is formed when the current peak price is lower than the preceding peak price.
• A double-top is formed when the current peak price is equal to the preceding peak price.
Lower Trends
• An uptrend is formed when the current trough price is higher than the preceding trough price.
• A return line downtrend is formed when the current trough price is lower than the preceding trough price.
• A double-bottom is formed when the current trough price is equal to the preceding trough price.
Muti-Part Upper and Lower Trends
• A multi-part return line uptrend begins with the formation of a new return line uptrend, or higher peak, and continues until a new downtrend, or lower peak, completes the trend.
• A multi-part downtrend begins with the formation of a new downtrend, or lower peak, and continues until a new return line uptrend, or higher peak, completes the trend.
• A multi-part uptrend begins with the formation of a new uptrend, or higher trough, and continues until a new return line downtrend, or lower trough, completes the trend.
• A multi-part return line downtrend begins with the formation of a new return line downtrend, or lower trough, and continues until a new uptrend, or higher trough, completes the trend.
Double Trends
• A double uptrend is formed when the current trough price is higher than the preceding trough price and the current peak price is higher than the preceding peak price.
• A double downtrend is formed when the current peak price is lower than the preceding peak price and the current trough price is lower than the preceding trough price.
Muti-Part Double Trends
• A multi-part double uptrend begins with the formation of a new uptrend that proceeds a new return line uptrend, and continues until a new downtrend or return line downtrend ends the trend.
• A multi-part double downtrend begins with the formation of a new downtrend that proceeds a new return line downtrend, and continues until a new uptrend or return line uptrend ends the trend.
Wave Cycles
A wave cycle is here defined as a complete two-part move between a swing high and a swing low, or a swing low and a swing high. The first swing high or swing low will set the course for the sequence of wave cycles that follow; for example a chart that begins with a swing low will form its first complete wave cycle upon the formation of the first complete swing high and vice versa.
Figure 1.
Fibonacci Retracement and Extension Ratios
The Fibonacci sequence is a series of numbers in which each number is the sum of the two preceding numbers, starting with 0 and 1. For example 0 + 1 = 1, 1 + 1 = 2, 1 + 2 = 3, and so on. Ultimately, we could go on forever but the first few numbers in the sequence are as follows: 0 , 1, 1, 2, 3, 5, 8, 13, 21, 34, 55, 89, 144.
The extension ratios are calculated by dividing each number in the sequence by the number preceding it. For example 0/1 = 0, 1/1 = 1, 2/1 = 2, 3/2 = 1.5, 5/3 = 1.6666..., 8/5 = 1.6, 13/8 = 1.625, 21/13 = 1.6153..., 34/21 = 1.6190..., 55/34 = 1.6176..., 89/55 = 1.6181..., 144/89 = 1.6179..., and so on. The retracement ratios are calculated by inverting this process and dividing each number in the sequence by the number proceeding it. For example 0/1 = 0, 1/1 = 1, 1/2 = 0.5, 2/3 = 0.666..., 3/5 = 0.6, 5/8 = 0.625, 8/13 = 0.6153..., 13/21 = 0.6190..., 21/34 = 0.6176..., 34/55 = 0.6181..., 55/89 = 0.6179..., 89/144 = 0.6180..., and so on.
1.618 is considered to be the 'golden ratio', found in many natural phenomena such as the growth of seashells and the branching of trees. Some now speculate the universe oscillates at a frequency of 0,618 Hz, which could help to explain such phenomena, but this theory has yet to be proven.
Traders and analysts use Fibonacci retracement and extension indicators, consisting of horizontal lines representing different Fibonacci ratios, for identifying potential levels of support and resistance. Fibonacci ranges are typically drawn from left to right, with retracement levels representing ratios inside of the current range and extension levels representing ratios extended outside of the current range. If the current wave cycle ends on a swing low, the Fibonacci range is drawn from peak to trough. If the current wave cycle ends on a swing high the Fibonacci range is drawn from trough to peak.
Harmonic Patterns
The concept of harmonic patterns in trading was first introduced by H.M. Gartley in his book "Profits in the Stock Market", published in 1935. Gartley observed that markets have a tendency to move in repetitive patterns, and he identified several specific patterns that he believed could be used to predict future price movements.
Since then, many other traders and analysts have built upon Gartley's work and developed their own variations of harmonic patterns. One such contributor is Larry Pesavento, who developed his own methods for measuring harmonic patterns using Fibonacci ratios. Pesavento has written several books on the subject of harmonic patterns and Fibonacci ratios in trading. Another notable contributor to harmonic patterns is Scott Carney, who developed his own approach to harmonic trading in the late 1990s and also popularised the use of Fibonacci ratios to measure harmonic patterns. Carney expanded on Gartley's work and also introduced several new harmonic patterns, such as the Shark pattern and the 5-0 pattern.
The bullish and bearish Gartley patterns are the oldest recognized harmonic patterns in trading and all the other harmonic patterns are ultimately modifications of the original Gartley patterns. Gartley patterns are fundamentally composed of 5 points, or 4 waves.
Bullish and Bearish ABCD Patterns
• Bullish ABCD patterns are fundamentally composed of two peaks and two troughs, with the second peak being lower than the first peak and the second trough being lower than the first trough. Which is the same as a double downtrend.
• Bearish ABCD patterns are fundamentally composed of two troughs and two peaks, with the second trough being higher than the first trough and the second peak being higher than the first peak. Which is the same as a double uptrend.
The most commonly recognised ratio measurements used by traders today are as follows:
• Wave 1 of the pattern, generally referred to as AB, has no specific ratio requirements.
• Wave 2 of the pattern, generally referred to as BC, should retrace by at least 61.8%, but no further than 78.6% of the range set by wave 1.
• Wave 3 of the pattern, generally referred to as CD, should extend to at least 127.2%, but no further than 161.8% of the range set by wave 2.
Measurement Tolerances
In general, tolerance in measurements refers to the allowable variation or deviation from a specific value or dimension. It is the range within which a particular measurement is considered to be acceptable or accurate. In this script I have applied this concept to the measurement of harmonic pattern ratios to increase to the frequency of pattern occurrences.
For example, the AB measurement of Gartley patterns is generally set at around 61.8%, but with such specificity in the measuring requirements the patterns are very rare. We can increase the frequency of pattern occurrences by setting a tolerance. A tolerance of 10% to both downside and upside, which is the default setting for all tolerances, means we would have a tolerable measurement range between 51.8-71.8%, thus increasing the frequency of occurrence.
█ FEATURES
Inputs
• BC Lower Tolerance
• BC Upper Tolerance
• CD Lower Tolerance
• CD Upper Tolerance
• Pattern Color
• Label Color
• Show Projections
• Extend Current Projection Lines
█ LIMITATIONS
All green and red candle calculations are based on differences between open and close prices, as such I have made no attempt to account for green candles that gap lower and close below the close price of the preceding candle, or red candles that gap higher and close above the close price of the preceding candle. This may cause some unexpected behaviour on some markets and timeframes. I can only recommend using 24-hour markets, if and where possible, as there are far fewer gaps and, generally, more data to work with.

Bullish ABCD Harmonic Patterns [theEccentricTrader]█ OVERVIEW
This indicator automatically draws bullish ABCD harmonic patterns and price projections derived from the ranges that constitute the patterns.
█ CONCEPTS
Green and Red Candles
• A green candle is one that closes with a close price equal to or above the price it opened.
• A red candle is one that closes with a close price that is lower than the price it opened.
Swing Highs and Swing Lows
• A swing high is a green candle or series of consecutive green candles followed by a single red candle to complete the swing and form the peak.
• A swing low is a red candle or series of consecutive red candles followed by a single green candle to complete the swing and form the trough.
Peak and Trough Prices (Basic)
• The peak price of a complete swing high is the high price of either the red candle that completes the swing high or the high price of the preceding green candle, depending on which is higher.
• The trough price of a complete swing low is the low price of either the green candle that completes the swing low or the low price of the preceding red candle, depending on which is lower.
Historic Peaks and Troughs
The current, or most recent, peak and trough occurrences are referred to as occurrence zero. Previous peak and trough occurrences are referred to as historic and ordered numerically from right to left, with the most recent historic peak and trough occurrences being occurrence one.
Range
The range is simply the difference between the current peak and current trough prices, generally expressed in terms of points or pips.
Support and Resistance
• Support refers to a price level where the demand for an asset is strong enough to prevent the price from falling further.
• Resistance refers to a price level where the supply of an asset is strong enough to prevent the price from rising further.
Support and resistance levels are important because they can help traders identify where the price of an asset might pause or reverse its direction, offering potential entry and exit points. For example, a trader might look to buy an asset when it approaches a support level , with the expectation that the price will bounce back up. Alternatively, a trader might look to sell an asset when it approaches a resistance level , with the expectation that the price will drop back down.
It's important to note that support and resistance levels are not always relevant, and the price of an asset can also break through these levels and continue moving in the same direction.
Upper Trends
• A return line uptrend is formed when the current peak price is higher than the preceding peak price.
• A downtrend is formed when the current peak price is lower than the preceding peak price.
• A double-top is formed when the current peak price is equal to the preceding peak price.
Lower Trends
• An uptrend is formed when the current trough price is higher than the preceding trough price.
• A return line downtrend is formed when the current trough price is lower than the preceding trough price.
• A double-bottom is formed when the current trough price is equal to the preceding trough price.
Muti-Part Upper and Lower Trends
• A multi-part return line uptrend begins with the formation of a new return line uptrend, or higher peak, and continues until a new downtrend, or lower peak, completes the trend.
• A multi-part downtrend begins with the formation of a new downtrend, or lower peak, and continues until a new return line uptrend, or higher peak, completes the trend.
• A multi-part uptrend begins with the formation of a new uptrend, or higher trough, and continues until a new return line downtrend, or lower trough, completes the trend.
• A multi-part return line downtrend begins with the formation of a new return line downtrend, or lower trough, and continues until a new uptrend, or higher trough, completes the trend.
Double Trends
• A double uptrend is formed when the current trough price is higher than the preceding trough price and the current peak price is higher than the preceding peak price.
• A double downtrend is formed when the current peak price is lower than the preceding peak price and the current trough price is lower than the preceding trough price.
Muti-Part Double Trends
• A multi-part double uptrend begins with the formation of a new uptrend that proceeds a new return line uptrend, and continues until a new downtrend or return line downtrend ends the trend.
• A multi-part double downtrend begins with the formation of a new downtrend that proceeds a new return line downtrend, and continues until a new uptrend or return line uptrend ends the trend.
Wave Cycles
A wave cycle is here defined as a complete two-part move between a swing high and a swing low, or a swing low and a swing high. The first swing high or swing low will set the course for the sequence of wave cycles that follow; for example a chart that begins with a swing low will form its first complete wave cycle upon the formation of the first complete swing high and vice versa.
Figure 1.
Fibonacci Retracement and Extension Ratios
The Fibonacci sequence is a series of numbers in which each number is the sum of the two preceding numbers, starting with 0 and 1. For example 0 + 1 = 1, 1 + 1 = 2, 1 + 2 = 3, and so on. Ultimately, we could go on forever but the first few numbers in the sequence are as follows: 0 , 1, 1, 2, 3, 5, 8, 13, 21, 34, 55, 89, 144.
The extension ratios are calculated by dividing each number in the sequence by the number preceding it. For example 0/1 = 0, 1/1 = 1, 2/1 = 2, 3/2 = 1.5, 5/3 = 1.6666..., 8/5 = 1.6, 13/8 = 1.625, 21/13 = 1.6153..., 34/21 = 1.6190..., 55/34 = 1.6176..., 89/55 = 1.6181..., 144/89 = 1.6179..., and so on. The retracement ratios are calculated by inverting this process and dividing each number in the sequence by the number proceeding it. For example 0/1 = 0, 1/1 = 1, 1/2 = 0.5, 2/3 = 0.666..., 3/5 = 0.6, 5/8 = 0.625, 8/13 = 0.6153..., 13/21 = 0.6190..., 21/34 = 0.6176..., 34/55 = 0.6181..., 55/89 = 0.6179..., 89/144 = 0.6180..., and so on.
1.618 is considered to be the 'golden ratio', found in many natural phenomena such as the growth of seashells and the branching of trees. Some now speculate the universe oscillates at a frequency of 0,618 Hz, which could help to explain such phenomena, but this theory has yet to be proven.
Traders and analysts use Fibonacci retracement and extension indicators, consisting of horizontal lines representing different Fibonacci ratios, for identifying potential levels of support and resistance. Fibonacci ranges are typically drawn from left to right, with retracement levels representing ratios inside of the current range and extension levels representing ratios extended outside of the current range. If the current wave cycle ends on a swing low, the Fibonacci range is drawn from peak to trough. If the current wave cycle ends on a swing high the Fibonacci range is drawn from trough to peak.
Harmonic Patterns
The concept of harmonic patterns in trading was first introduced by H.M. Gartley in his book "Profits in the Stock Market", published in 1935. Gartley observed that markets have a tendency to move in repetitive patterns, and he identified several specific patterns that he believed could be used to predict future price movements.
Since then, many other traders and analysts have built upon Gartley's work and developed their own variations of harmonic patterns. One such contributor is Larry Pesavento, who developed his own methods for measuring harmonic patterns using Fibonacci ratios. Pesavento has written several books on the subject of harmonic patterns and Fibonacci ratios in trading. Another notable contributor to harmonic patterns is Scott Carney, who developed his own approach to harmonic trading in the late 1990s and also popularised the use of Fibonacci ratios to measure harmonic patterns. Carney expanded on Gartley's work and also introduced several new harmonic patterns, such as the Shark pattern and the 5-0 pattern.
The bullish and bearish Gartley patterns are the oldest recognized harmonic patterns in trading and all the other harmonic patterns are ultimately modifications of the original Gartley patterns. Gartley patterns are fundamentally composed of 5 points, or 4 waves.
Bullish and Bearish ABCD Patterns
• Bullish ABCD patterns are fundamentally composed of two peaks and two troughs, with the second peak being lower than the first peak and the second trough being lower than the first trough. Which is the same as a double downtrend.
• Bearish ABCD patterns are fundamentally composed of two troughs and two peaks, with the second trough being higher than the first trough and the second peak being higher than the first peak. Which is the same as a double uptrend.
The most commonly recognised ratio measurements used by traders today are as follows:
• Wave 1 of the pattern, generally referred to as AB, has no specific ratio requirements.
• Wave 2 of the pattern, generally referred to as BC, should retrace by at least 61.8%, but no further than 78.6% of the range set by wave 1.
• Wave 3 of the pattern, generally referred to as CD, should extend to at least 127.2%, but no further than 161.8% of the range set by wave 2.
Measurement Tolerances
In general, tolerance in measurements refers to the allowable variation or deviation from a specific value or dimension. It is the range within which a particular measurement is considered to be acceptable or accurate. In this script I have applied this concept to the measurement of harmonic pattern ratios to increase to the frequency of pattern occurrences.
For example, the AB measurement of Gartley patterns is generally set at around 61.8%, but with such specificity in the measuring requirements the patterns are very rare. We can increase the frequency of pattern occurrences by setting a tolerance. A tolerance of 10% to both downside and upside, which is the default setting for all tolerances, means we would have a tolerable measurement range between 51.8-71.8%, thus increasing the frequency of occurrence.
█ FEATURES
Inputs
• BC Lower Tolerance
• BC Upper Tolerance
• CD Lower Tolerance
• CD Upper Tolerance
• Pattern Color
• Label Color
• Show Projections
• Extend Current Projection Lines
█ LIMITATIONS
All green and red candle calculations are based on differences between open and close prices, as such I have made no attempt to account for green candles that gap lower and close below the close price of the preceding candle, or red candles that gap higher and close above the close price of the preceding candle. This may cause some unexpected behaviour on some markets and timeframes. I can only recommend using 24-hour markets, if and where possible, as there are far fewer gaps and, generally, more data to work with.
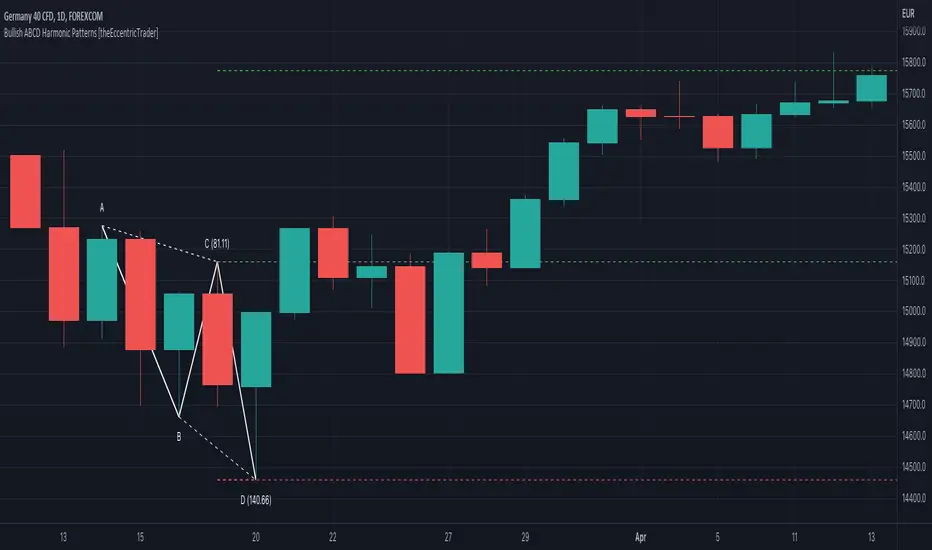
Bearish Three-Drive Harmonic Patterns [theEccentricTrader]█ OVERVIEW
This indicator automatically draws bearish three-drive harmonic patterns and price projections derived from the ranges that constitute the patterns.
█ CONCEPTS
Green and Red Candles
• A green candle is one that closes with a close price equal to or above the price it opened.
• A red candle is one that closes with a close price that is lower than the price it opened.
Swing Highs and Swing Lows
• A swing high is a green candle or series of consecutive green candles followed by a single red candle to complete the swing and form the peak.
• A swing low is a red candle or series of consecutive red candles followed by a single green candle to complete the swing and form the trough.
Peak and Trough Prices (Basic)
• The peak price of a complete swing high is the high price of either the red candle that completes the swing high or the high price of the preceding green candle, depending on which is higher.
• The trough price of a complete swing low is the low price of either the green candle that completes the swing low or the low price of the preceding red candle, depending on which is lower.
Historic Peaks and Troughs
The current, or most recent, peak and trough occurrences are referred to as occurrence zero. Previous peak and trough occurrences are referred to as historic and ordered numerically from right to left, with the most recent historic peak and trough occurrences being occurrence one.
Range
The range is simply the difference between the current peak and current trough prices, generally expressed in terms of points or pips.
Support and Resistance
• Support refers to a price level where the demand for an asset is strong enough to prevent the price from falling further.
• Resistance refers to a price level where the supply of an asset is strong enough to prevent the price from rising further.
Support and resistance levels are important because they can help traders identify where the price of an asset might pause or reverse its direction, offering potential entry and exit points. For example, a trader might look to buy an asset when it approaches a support level , with the expectation that the price will bounce back up. Alternatively, a trader might look to sell an asset when it approaches a resistance level , with the expectation that the price will drop back down.
It's important to note that support and resistance levels are not always relevant, and the price of an asset can also break through these levels and continue moving in the same direction.
Upper Trends
• A return line uptrend is formed when the current peak price is higher than the preceding peak price.
• A downtrend is formed when the current peak price is lower than the preceding peak price.
• A double-top is formed when the current peak price is equal to the preceding peak price.
Lower Trends
• An uptrend is formed when the current trough price is higher than the preceding trough price.
• A return line downtrend is formed when the current trough price is lower than the preceding trough price.
• A double-bottom is formed when the current trough price is equal to the preceding trough price.
Muti-Part Upper and Lower Trends
• A multi-part return line uptrend begins with the formation of a new return line uptrend, or higher peak, and continues until a new downtrend, or lower peak, completes the trend.
• A multi-part downtrend begins with the formation of a new downtrend, or lower peak, and continues until a new return line uptrend, or higher peak, completes the trend.
• A multi-part uptrend begins with the formation of a new uptrend, or higher trough, and continues until a new return line downtrend, or lower trough, completes the trend.
• A multi-part return line downtrend begins with the formation of a new return line downtrend, or lower trough, and continues until a new uptrend, or higher trough, completes the trend.
Double Trends
• A double uptrend is formed when the current trough price is higher than the preceding trough price and the current peak price is higher than the preceding peak price.
• A double downtrend is formed when the current peak price is lower than the preceding peak price and the current trough price is lower than the preceding trough price.
Muti-Part Double Trends
• A multi-part double uptrend begins with the formation of a new uptrend that proceeds a new return line uptrend, and continues until a new downtrend or return line downtrend ends the trend.
• A multi-part double downtrend begins with the formation of a new downtrend that proceeds a new return line downtrend, and continues until a new uptrend or return line uptrend ends the trend.
Wave Cycles
A wave cycle is here defined as a complete two-part move between a swing high and a swing low, or a swing low and a swing high. The first swing high or swing low will set the course for the sequence of wave cycles that follow; for example a chart that begins with a swing low will form its first complete wave cycle upon the formation of the first complete swing high and vice versa.
Figure 1.
Fibonacci Retracement and Extension Ratios
The Fibonacci sequence is a series of numbers in which each number is the sum of the two preceding numbers, starting with 0 and 1. For example 0 + 1 = 1, 1 + 1 = 2, 1 + 2 = 3, and so on. Ultimately, we could go on forever but the first few numbers in the sequence are as follows: 0 , 1, 1, 2, 3, 5, 8, 13, 21, 34, 55, 89, 144.
The extension ratios are calculated by dividing each number in the sequence by the number preceding it. For example 0/1 = 0, 1/1 = 1, 2/1 = 2, 3/2 = 1.5, 5/3 = 1.6666..., 8/5 = 1.6, 13/8 = 1.625, 21/13 = 1.6153..., 34/21 = 1.6190..., 55/34 = 1.6176..., 89/55 = 1.6181..., 144/89 = 1.6179..., and so on. The retracement ratios are calculated by inverting this process and dividing each number in the sequence by the number proceeding it. For example 0/1 = 0, 1/1 = 1, 1/2 = 0.5, 2/3 = 0.666..., 3/5 = 0.6, 5/8 = 0.625, 8/13 = 0.6153..., 13/21 = 0.6190..., 21/34 = 0.6176..., 34/55 = 0.6181..., 55/89 = 0.6179..., 89/144 = 0.6180..., and so on.
1.618 is considered to be the 'golden ratio', found in many natural phenomena such as the growth of seashells and the branching of trees. Some now speculate the universe oscillates at a frequency of 0,618 Hz, which could help to explain such phenomena, but this theory has yet to be proven.
Traders and analysts use Fibonacci retracement and extension indicators, consisting of horizontal lines representing different Fibonacci ratios, for identifying potential levels of support and resistance. Fibonacci ranges are typically drawn from left to right, with retracement levels representing ratios inside of the current range and extension levels representing ratios extended outside of the current range. If the current wave cycle ends on a swing low, the Fibonacci range is drawn from peak to trough. If the current wave cycle ends on a swing high the Fibonacci range is drawn from trough to peak.
Harmonic Patterns
The concept of harmonic patterns in trading was first introduced by H.M. Gartley in his book "Profits in the Stock Market", published in 1935. Gartley observed that markets have a tendency to move in repetitive patterns, and he identified several specific patterns that he believed could be used to predict future price movements.
Since then, many other traders and analysts have built upon Gartley's work and developed their own variations of harmonic patterns. One such contributor is Larry Pesavento, who developed his own methods for measuring harmonic patterns using Fibonacci ratios. Pesavento has written several books on the subject of harmonic patterns and Fibonacci ratios in trading. Another notable contributor to harmonic patterns is Scott Carney, who developed his own approach to harmonic trading in the late 1990s and also popularised the use of Fibonacci ratios to measure harmonic patterns. Carney expanded on Gartley's work and also introduced several new harmonic patterns, such as the Shark pattern and the 5-0 pattern.
The bullish and bearish Gartley patterns are the oldest recognized harmonic patterns in trading and all the other harmonic patterns are ultimately modifications of the original Gartley patterns. Gartley patterns are fundamentally composed of 5 points, or 4 waves.
Bullish and Bearish Three-Drive Patterns
• Bullish three-drive patterns are fundamentally composed of three peaks and three troughs, with the second peak being lower than the first peak and the third peak being lower than the second peak. And similarly, the second trough being lower than the first trough and the third trough being lower than the second trough.
• Bearish three-drive patterns are fundamentally composed of three troughs and three peaks, with the second trough being higher than the first trough and the third trough being higher than the second troughs. And similarly, the second peak being higher than the first peak and the third peak being higher than the second peak.
The most commonly recognised ratio measurements used by traders today are as follows:
• Wave 1 of the pattern, referred to as X1, should extend to at least 127.2% of the preceding range.
• Wave 2 of the pattern, referred to as 1A, should retrace to 61.8% of the range set by wave 1.
• Wave 3 of the pattern, referred to as drive A2, should extend to at least 127.2%, but no further than 161.8% of the range set by wave 2.
• Wave 4 of the pattern, referred to drive 2B, should retrace to 61.8% of the range set by wave 3.
• Wave 5, generally referred to as drive B3, should extend to at least 127.2%, but no further than 161.8% of the range set by wave 4.
Measurement Tolerances
In general, tolerance in measurements refers to the allowable variation or deviation from a specific value or dimension. It is the range within which a particular measurement is considered to be acceptable or accurate. In this script I have applied this concept to the measurement of harmonic pattern ratios to increase to the frequency of pattern occurrences.
For example, the AB measurement of Gartley patterns is generally set at around 61.8%, but with such specificity in the measuring requirements the patterns are very rare. We can increase the frequency of pattern occurrences by setting a tolerance. A tolerance of 10% to both downside and upside, for example, means we would have a tolerable measurement range between 51.8-71.8%, thus increasing the frequency of occurrence.
█ FEATURES
Inputs
• X1 Lower Tolerance
• 1A Lower Tolerance
• 1A Upper Tolerance
• A2 Lower Tolerance
• A2 Upper Tolerance
• 2B Lower Tolerance
• 2B Upper Tolerance
• B3 Lower Tolerance
• B3 Upper Tolerance
• Pattern Color
• Label Color
• Show Projections
• Extend Current Projection Lines
█ LIMITATIONS
All green and red candle calculations are based on differences between open and close prices, as such I have made no attempt to account for green candles that gap lower and close below the close price of the preceding candle, or red candles that gap higher and close above the close price of the preceding candle. This may cause some unexpected behaviour on some markets and timeframes. I can only recommend using 24-hour markets, if and where possible, as there are far fewer gaps and, generally, more data to work with.
█ NOTES
Please note I have set the default tolerances to 20% for this indicator as the patterns seem to be pretty rare.

Bullish Three-Drive Harmonic Patterns [theEccentricTrader]█ OVERVIEW
This indicator automatically draws bullish three-drive harmonic patterns and price projections derived from the ranges that constitute the patterns.
█ CONCEPTS
Green and Red Candles
• A green candle is one that closes with a close price equal to or above the price it opened.
• A red candle is one that closes with a close price that is lower than the price it opened.
Swing Highs and Swing Lows
• A swing high is a green candle or series of consecutive green candles followed by a single red candle to complete the swing and form the peak.
• A swing low is a red candle or series of consecutive red candles followed by a single green candle to complete the swing and form the trough.
Peak and Trough Prices (Basic)
• The peak price of a complete swing high is the high price of either the red candle that completes the swing high or the high price of the preceding green candle, depending on which is higher.
• The trough price of a complete swing low is the low price of either the green candle that completes the swing low or the low price of the preceding red candle, depending on which is lower.
Historic Peaks and Troughs
The current, or most recent, peak and trough occurrences are referred to as occurrence zero. Previous peak and trough occurrences are referred to as historic and ordered numerically from right to left, with the most recent historic peak and trough occurrences being occurrence one.
Range
The range is simply the difference between the current peak and current trough prices, generally expressed in terms of points or pips.
Support and Resistance
• Support refers to a price level where the demand for an asset is strong enough to prevent the price from falling further.
• Resistance refers to a price level where the supply of an asset is strong enough to prevent the price from rising further.
Support and resistance levels are important because they can help traders identify where the price of an asset might pause or reverse its direction, offering potential entry and exit points. For example, a trader might look to buy an asset when it approaches a support level , with the expectation that the price will bounce back up. Alternatively, a trader might look to sell an asset when it approaches a resistance level , with the expectation that the price will drop back down.
It's important to note that support and resistance levels are not always relevant, and the price of an asset can also break through these levels and continue moving in the same direction.
Upper Trends
• A return line uptrend is formed when the current peak price is higher than the preceding peak price.
• A downtrend is formed when the current peak price is lower than the preceding peak price.
• A double-top is formed when the current peak price is equal to the preceding peak price.
Lower Trends
• An uptrend is formed when the current trough price is higher than the preceding trough price.
• A return line downtrend is formed when the current trough price is lower than the preceding trough price.
• A double-bottom is formed when the current trough price is equal to the preceding trough price.
Muti-Part Upper and Lower Trends
• A multi-part return line uptrend begins with the formation of a new return line uptrend, or higher peak, and continues until a new downtrend, or lower peak, completes the trend.
• A multi-part downtrend begins with the formation of a new downtrend, or lower peak, and continues until a new return line uptrend, or higher peak, completes the trend.
• A multi-part uptrend begins with the formation of a new uptrend, or higher trough, and continues until a new return line downtrend, or lower trough, completes the trend.
• A multi-part return line downtrend begins with the formation of a new return line downtrend, or lower trough, and continues until a new uptrend, or higher trough, completes the trend.
Double Trends
• A double uptrend is formed when the current trough price is higher than the preceding trough price and the current peak price is higher than the preceding peak price.
• A double downtrend is formed when the current peak price is lower than the preceding peak price and the current trough price is lower than the preceding trough price.
Muti-Part Double Trends
• A multi-part double uptrend begins with the formation of a new uptrend that proceeds a new return line uptrend, and continues until a new downtrend or return line downtrend ends the trend.
• A multi-part double downtrend begins with the formation of a new downtrend that proceeds a new return line downtrend, and continues until a new uptrend or return line uptrend ends the trend.
Wave Cycles
A wave cycle is here defined as a complete two-part move between a swing high and a swing low, or a swing low and a swing high. The first swing high or swing low will set the course for the sequence of wave cycles that follow; for example a chart that begins with a swing low will form its first complete wave cycle upon the formation of the first complete swing high and vice versa.
Figure 1.
Fibonacci Retracement and Extension Ratios
The Fibonacci sequence is a series of numbers in which each number is the sum of the two preceding numbers, starting with 0 and 1. For example 0 + 1 = 1, 1 + 1 = 2, 1 + 2 = 3, and so on. Ultimately, we could go on forever but the first few numbers in the sequence are as follows: 0 , 1, 1, 2, 3, 5, 8, 13, 21, 34, 55, 89, 144.
The extension ratios are calculated by dividing each number in the sequence by the number preceding it. For example 0/1 = 0, 1/1 = 1, 2/1 = 2, 3/2 = 1.5, 5/3 = 1.6666..., 8/5 = 1.6, 13/8 = 1.625, 21/13 = 1.6153..., 34/21 = 1.6190..., 55/34 = 1.6176..., 89/55 = 1.6181..., 144/89 = 1.6179..., and so on. The retracement ratios are calculated by inverting this process and dividing each number in the sequence by the number proceeding it. For example 0/1 = 0, 1/1 = 1, 1/2 = 0.5, 2/3 = 0.666..., 3/5 = 0.6, 5/8 = 0.625, 8/13 = 0.6153..., 13/21 = 0.6190..., 21/34 = 0.6176..., 34/55 = 0.6181..., 55/89 = 0.6179..., 89/144 = 0.6180..., and so on.
1.618 is considered to be the 'golden ratio', found in many natural phenomena such as the growth of seashells and the branching of trees. Some now speculate the universe oscillates at a frequency of 0,618 Hz, which could help to explain such phenomena, but this theory has yet to be proven.
Traders and analysts use Fibonacci retracement and extension indicators, consisting of horizontal lines representing different Fibonacci ratios, for identifying potential levels of support and resistance. Fibonacci ranges are typically drawn from left to right, with retracement levels representing ratios inside of the current range and extension levels representing ratios extended outside of the current range. If the current wave cycle ends on a swing low, the Fibonacci range is drawn from peak to trough. If the current wave cycle ends on a swing high the Fibonacci range is drawn from trough to peak.
Harmonic Patterns
The concept of harmonic patterns in trading was first introduced by H.M. Gartley in his book "Profits in the Stock Market", published in 1935. Gartley observed that markets have a tendency to move in repetitive patterns, and he identified several specific patterns that he believed could be used to predict future price movements.
Since then, many other traders and analysts have built upon Gartley's work and developed their own variations of harmonic patterns. One such contributor is Larry Pesavento, who developed his own methods for measuring harmonic patterns using Fibonacci ratios. Pesavento has written several books on the subject of harmonic patterns and Fibonacci ratios in trading. Another notable contributor to harmonic patterns is Scott Carney, who developed his own approach to harmonic trading in the late 1990s and also popularised the use of Fibonacci ratios to measure harmonic patterns. Carney expanded on Gartley's work and also introduced several new harmonic patterns, such as the Shark pattern and the 5-0 pattern.
The bullish and bearish Gartley patterns are the oldest recognized harmonic patterns in trading and all the other harmonic patterns are ultimately modifications of the original Gartley patterns. Gartley patterns are fundamentally composed of 5 points, or 4 waves.
Bullish and Bearish Three-Drive Patterns
• Bullish three-drive patterns are fundamentally composed of three peaks and three troughs, with the second peak being lower than the first peak and the third peak being lower than the second peak. And similarly, the second trough being lower than the first trough and the third trough being lower than the second trough.
• Bearish three-drive patterns are fundamentally composed of three troughs and three peaks, with the second trough being higher than the first trough and the third trough being higher than the second troughs. And similarly, the second peak being higher than the first peak and the third peak being higher than the second peak.
The most commonly recognised ratio measurements used by traders today are as follows:
• Wave 1 of the pattern, referred to as X1, should extend to at least 127.2% of the preceding range.
• Wave 2 of the pattern, referred to as 1A, should retrace to 61.8% of the range set by wave 1.
• Wave 3 of the pattern, referred to as A2, should extend to at least 127.2%, but no further than 161.8% of the range set by wave 2.
• Wave 4 of the pattern, referred to as 2B, should retrace to 61.8% of the range set by wave 3.
• Wave 5 of the pattern, referred to as B3, should extend to at least 127.2%, but no further than 161.8% of the range set by wave 4.
Measurement Tolerances
In general, tolerance in measurements refers to the allowable variation or deviation from a specific value or dimension. It is the range within which a particular measurement is considered to be acceptable or accurate. In this script I have applied this concept to the measurement of harmonic pattern ratios to increase to the frequency of pattern occurrences.
For example, the AB measurement of Gartley patterns is generally set at around 61.8%, but with such specificity in the measuring requirements the patterns are very rare. We can increase the frequency of pattern occurrences by setting a tolerance. A tolerance of 10% to both downside and upside, for example, means we would have a tolerable measurement range between 51.8-71.8%, thus increasing the frequency of occurrence.
█ FEATURES
Inputs
• X1 Lower Tolerance
• 1A Lower Tolerance
• 1A Upper Tolerance
• A2 Lower Tolerance
• A2 Upper Tolerance
• 2B Lower Tolerance
• 2B Upper Tolerance
• B3 Lower Tolerance
• B3 Upper Tolerance
• Pattern Color
• Label Color
• Show Projections
• Extend Current Projection Lines
█ LIMITATIONS
All green and red candle calculations are based on differences between open and close prices, as such I have made no attempt to account for green candles that gap lower and close below the close price of the preceding candle, or red candles that gap higher and close above the close price of the preceding candle. This may cause some unexpected behaviour on some markets and timeframes. I can only recommend using 24-hour markets, if and where possible, as there are far fewer gaps and, generally, more data to work with.
█ NOTES
Please note I have set the default tolerances to 20% for this indicator as the patterns seem to be pretty rare.

Bearish Butterfly Harmonic Patterns [theEccentricTrader]█ OVERVIEW
This indicator automatically draws bearish butterfly harmonic patterns and price projections derived from the ranges that constitute the patterns.
█ CONCEPTS
Green and Red Candles
• A green candle is one that closes with a close price equal to or above the price it opened.
• A red candle is one that closes with a close price that is lower than the price it opened.
Swing Highs and Swing Lows
• A swing high is a green candle or series of consecutive green candles followed by a single red candle to complete the swing and form the peak.
• A swing low is a red candle or series of consecutive red candles followed by a single green candle to complete the swing and form the trough.
Peak and Trough Prices (Basic)
• The peak price of a complete swing high is the high price of either the red candle that completes the swing high or the high price of the preceding green candle, depending on which is higher.
• The trough price of a complete swing low is the low price of either the green candle that completes the swing low or the low price of the preceding red candle, depending on which is lower.
Historic Peaks and Troughs
The current, or most recent, peak and trough occurrences are referred to as occurrence zero. Previous peak and trough occurrences are referred to as historic and ordered numerically from right to left, with the most recent historic peak and trough occurrences being occurrence one.
Range
The range is simply the difference between the current peak and current trough prices, generally expressed in terms of points or pips.
Support and Resistance
• Support refers to a price level where the demand for an asset is strong enough to prevent the price from falling further.
• Resistance refers to a price level where the supply of an asset is strong enough to prevent the price from rising further.
Support and resistance levels are important because they can help traders identify where the price of an asset might pause or reverse its direction, offering potential entry and exit points. For example, a trader might look to buy an asset when it approaches a support level , with the expectation that the price will bounce back up. Alternatively, a trader might look to sell an asset when it approaches a resistance level , with the expectation that the price will drop back down.
It's important to note that support and resistance levels are not always relevant, and the price of an asset can also break through these levels and continue moving in the same direction.
Upper Trends
• A return line uptrend is formed when the current peak price is higher than the preceding peak price.
• A downtrend is formed when the current peak price is lower than the preceding peak price.
• A double-top is formed when the current peak price is equal to the preceding peak price.
Lower Trends
• An uptrend is formed when the current trough price is higher than the preceding trough price.
• A return line downtrend is formed when the current trough price is lower than the preceding trough price.
• A double-bottom is formed when the current trough price is equal to the preceding trough price.
Muti-Part Upper and Lower Trends
• A multi-part return line uptrend begins with the formation of a new return line uptrend, or higher peak, and continues until a new downtrend, or lower peak, completes the trend.
• A multi-part downtrend begins with the formation of a new downtrend, or lower peak, and continues until a new return line uptrend, or higher peak, completes the trend.
• A multi-part uptrend begins with the formation of a new uptrend, or higher trough, and continues until a new return line downtrend, or lower trough, completes the trend.
• A multi-part return line downtrend begins with the formation of a new return line downtrend, or lower trough, and continues until a new uptrend, or higher trough, completes the trend.
Wave Cycles
A wave cycle is here defined as a complete two-part move between a swing high and a swing low, or a swing low and a swing high. The first swing high or swing low will set the course for the sequence of wave cycles that follow; for example a chart that begins with a swing low will form its first complete wave cycle upon the formation of the first complete swing high and vice versa.
Figure 1.
Fibonacci Retracement and Extension Ratios
The Fibonacci sequence is a series of numbers in which each number is the sum of the two preceding numbers, starting with 0 and 1. For example 0 + 1 = 1, 1 + 1 = 2, 1 + 2 = 3, and so on. Ultimately, we could go on forever but the first few numbers in the sequence are as follows: 0 , 1, 1, 2, 3, 5, 8, 13, 21, 34, 55, 89, 144.
The extension ratios are calculated by dividing each number in the sequence by the number preceding it. For example 0/1 = 0, 1/1 = 1, 2/1 = 2, 3/2 = 1.5, 5/3 = 1.6666..., 8/5 = 1.6, 13/8 = 1.625, 21/13 = 1.6153..., 34/21 = 1.6190..., 55/34 = 1.6176..., 89/55 = 1.6181..., 144/89 = 1.6179..., and so on. The retracement ratios are calculated by inverting this process and dividing each number in the sequence by the number proceeding it. For example 0/1 = 0, 1/1 = 1, 1/2 = 0.5, 2/3 = 0.666..., 3/5 = 0.6, 5/8 = 0.625, 8/13 = 0.6153..., 13/21 = 0.6190..., 21/34 = 0.6176..., 34/55 = 0.6181..., 55/89 = 0.6179..., 89/144 = 0.6180..., and so on.
1.618 is considered to be the 'golden ratio', found in many natural phenomena such as the growth of seashells and the branching of trees. Some now speculate the universe oscillates at a frequency of 0,618 Hz, which could help to explain such phenomena, but this theory has yet to be proven.
Traders and analysts use Fibonacci retracement and extension indicators, consisting of horizontal lines representing different Fibonacci ratios, for identifying potential levels of support and resistance. Fibonacci ranges are typically drawn from left to right, with retracement levels representing ratios inside of the current range and extension levels representing ratios extended outside of the current range. If the current wave cycle ends on a swing low, the Fibonacci range is drawn from peak to trough. If the current wave cycle ends on a swing high the Fibonacci range is drawn from trough to peak.
Harmonic Patterns
The concept of harmonic patterns in trading was first introduced by H.M. Gartley in his book "Profits in the Stock Market", published in 1935. Gartley observed that markets have a tendency to move in repetitive patterns, and he identified several specific patterns that he believed could be used to predict future price movements.
Since then, many other traders and analysts have built upon Gartley's work and developed their own variations of harmonic patterns. One such contributor is Larry Pesavento, who developed his own methods for measuring harmonic patterns using Fibonacci ratios. Pesavento has written several books on the subject of harmonic patterns and Fibonacci ratios in trading. Another notable contributor to harmonic patterns is Scott Carney, who developed his own approach to harmonic trading in the late 1990s and also popularised the use of Fibonacci ratios to measure harmonic patterns. Carney expanded on Gartley's work and also introduced several new harmonic patterns, such as the Shark pattern and the 5-0 pattern.
The bullish and bearish Gartley patterns are the oldest recognized harmonic patterns in trading and all the other harmonic patterns are ultimately modifications of the original Gartley patterns. Gartley patterns are fundamentally composed of 5 points, or 4 waves.
Bullish and Bearish Butterfly Patterns
• Bullish butterfly patterns are fundamentally composed of two peaks and three troughs, with the second peak being lower than the first peak. And the third trough being lower than both the second and first troughs, while the second trough is higher than the first.
• Bearish butterfly patterns are fundamentally composed of two troughs and three peaks, with the second trough being higher than the first trough. And the third peak being higher than both the second and first peaks, while the second peak is lower than the first.
The most commonly recognised ratio measurements used by traders today are as follows:
• Wave 1 of the pattern, generally referred to as XA, has no specific ratio requirements.
• Wave 2 of the pattern, generally referred to as AB, should retrace by 78.6% of the range set by wave 1.
• Wave 3 of the pattern, generally referred to as BC, should retrace by at least 38.2%, but no further than 88.6% of the range set by wave 2.
• Wave 4 of the pattern, generally referred to as CD, should extend to at least 161.8%, but no further than 261.8% of the range set by wave 3.
• The last measure, generally referred to as AD, is that of wave 4 as a ratio of the range set by wave 1, which should extend to 127%.
Measurement Tolerances
In general, tolerance in measurements refers to the allowable variation or deviation from a specific value or dimension. It is the range within which a particular measurement is considered to be acceptable or accurate. In this script I have applied this concept to the measurement of harmonic pattern ratios to increase to the frequency of pattern occurrences.
For example, the AB measurement of Gartley patterns is generally set at around 61.8%, but with such specificity in the measuring requirements the patterns are very rare. We can increase the frequency of pattern occurrences by setting a tolerance. A tolerance of 10% to both downside and upside, which is the default setting for all tolerances, means we would have a tolerable measurement range between 51.8-71.8%, thus increasing the frequency of occurrence.
█ FEATURES
Inputs
• AB Lower Tolerance
• AB Upper Tolerance
• BC Lower Tolerance
• BC Upper Tolerance
• CD Lower Tolerance
• CD Upper Tolerance
• AD Lower Tolerance
• AD Upper Tolerance
• Pattern Color
• Label Color
• Show Projections
• Extend Current Projection Lines
█ LIMITATIONS
All green and red candle calculations are based on differences between open and close prices, as such I have made no attempt to account for green candles that gap lower and close below the close price of the preceding candle, or red candles that gap higher and close above the close price of the preceding candle. This may cause some unexpected behaviour on some markets and timeframes. I can only recommend using 24-hour markets, if and where possible, as there are far fewer gaps and, generally, more data to work with.

Bullish Butterfly Harmonic Patterns [theEccentricTrader]█ OVERVIEW
This indicator automatically draws bullish butterfly harmonic patterns and price projections derived from the ranges that constitute the patterns.
█ CONCEPTS
Green and Red Candles
• A green candle is one that closes with a close price equal to or above the price it opened.
• A red candle is one that closes with a close price that is lower than the price it opened.
Swing Highs and Swing Lows
• A swing high is a green candle or series of consecutive green candles followed by a single red candle to complete the swing and form the peak.
• A swing low is a red candle or series of consecutive red candles followed by a single green candle to complete the swing and form the trough.
Peak and Trough Prices (Basic)
• The peak price of a complete swing high is the high price of either the red candle that completes the swing high or the high price of the preceding green candle, depending on which is higher.
• The trough price of a complete swing low is the low price of either the green candle that completes the swing low or the low price of the preceding red candle, depending on which is lower.
Historic Peaks and Troughs
The current, or most recent, peak and trough occurrences are referred to as occurrence zero. Previous peak and trough occurrences are referred to as historic and ordered numerically from right to left, with the most recent historic peak and trough occurrences being occurrence one.
Range
The range is simply the difference between the current peak and current trough prices, generally expressed in terms of points or pips.
Support and Resistance
• Support refers to a price level where the demand for an asset is strong enough to prevent the price from falling further.
• Resistance refers to a price level where the supply of an asset is strong enough to prevent the price from rising further.
Support and resistance levels are important because they can help traders identify where the price of an asset might pause or reverse its direction, offering potential entry and exit points. For example, a trader might look to buy an asset when it approaches a support level , with the expectation that the price will bounce back up. Alternatively, a trader might look to sell an asset when it approaches a resistance level , with the expectation that the price will drop back down.
It's important to note that support and resistance levels are not always relevant, and the price of an asset can also break through these levels and continue moving in the same direction.
Upper Trends
• A return line uptrend is formed when the current peak price is higher than the preceding peak price.
• A downtrend is formed when the current peak price is lower than the preceding peak price.
• A double-top is formed when the current peak price is equal to the preceding peak price.
Lower Trends
• An uptrend is formed when the current trough price is higher than the preceding trough price.
• A return line downtrend is formed when the current trough price is lower than the preceding trough price.
• A double-bottom is formed when the current trough price is equal to the preceding trough price.
Muti-Part Upper and Lower Trends
• A multi-part return line uptrend begins with the formation of a new return line uptrend, or higher peak, and continues until a new downtrend, or lower peak, completes the trend.
• A multi-part downtrend begins with the formation of a new downtrend, or lower peak, and continues until a new return line uptrend, or higher peak, completes the trend.
• A multi-part uptrend begins with the formation of a new uptrend, or higher trough, and continues until a new return line downtrend, or lower trough, completes the trend.
• A multi-part return line downtrend begins with the formation of a new return line downtrend, or lower trough, and continues until a new uptrend, or higher trough, completes the trend.
Wave Cycles
A wave cycle is here defined as a complete two-part move between a swing high and a swing low, or a swing low and a swing high. The first swing high or swing low will set the course for the sequence of wave cycles that follow; for example a chart that begins with a swing low will form its first complete wave cycle upon the formation of the first complete swing high and vice versa.
Figure 1.
Fibonacci Retracement and Extension Ratios
The Fibonacci sequence is a series of numbers in which each number is the sum of the two preceding numbers, starting with 0 and 1. For example 0 + 1 = 1, 1 + 1 = 2, 1 + 2 = 3, and so on. Ultimately, we could go on forever but the first few numbers in the sequence are as follows: 0 , 1, 1, 2, 3, 5, 8, 13, 21, 34, 55, 89, 144.
The extension ratios are calculated by dividing each number in the sequence by the number preceding it. For example 0/1 = 0, 1/1 = 1, 2/1 = 2, 3/2 = 1.5, 5/3 = 1.6666..., 8/5 = 1.6, 13/8 = 1.625, 21/13 = 1.6153..., 34/21 = 1.6190..., 55/34 = 1.6176..., 89/55 = 1.6181..., 144/89 = 1.6179..., and so on. The retracement ratios are calculated by inverting this process and dividing each number in the sequence by the number proceeding it. For example 0/1 = 0, 1/1 = 1, 1/2 = 0.5, 2/3 = 0.666..., 3/5 = 0.6, 5/8 = 0.625, 8/13 = 0.6153..., 13/21 = 0.6190..., 21/34 = 0.6176..., 34/55 = 0.6181..., 55/89 = 0.6179..., 89/144 = 0.6180..., and so on.
1.618 is considered to be the 'golden ratio', found in many natural phenomena such as the growth of seashells and the branching of trees. Some now speculate the universe oscillates at a frequency of 0,618 Hz, which could help to explain such phenomena, but this theory has yet to be proven.
Traders and analysts use Fibonacci retracement and extension indicators, consisting of horizontal lines representing different Fibonacci ratios, for identifying potential levels of support and resistance. Fibonacci ranges are typically drawn from left to right, with retracement levels representing ratios inside of the current range and extension levels representing ratios extended outside of the current range. If the current wave cycle ends on a swing low, the Fibonacci range is drawn from peak to trough. If the current wave cycle ends on a swing high the Fibonacci range is drawn from trough to peak.
Harmonic Patterns
The concept of harmonic patterns in trading was first introduced by H.M. Gartley in his book "Profits in the Stock Market", published in 1935. Gartley observed that markets have a tendency to move in repetitive patterns, and he identified several specific patterns that he believed could be used to predict future price movements.
Since then, many other traders and analysts have built upon Gartley's work and developed their own variations of harmonic patterns. One such contributor is Larry Pesavento, who developed his own methods for measuring harmonic patterns using Fibonacci ratios. Pesavento has written several books on the subject of harmonic patterns and Fibonacci ratios in trading. Another notable contributor to harmonic patterns is Scott Carney, who developed his own approach to harmonic trading in the late 1990s and also popularised the use of Fibonacci ratios to measure harmonic patterns. Carney expanded on Gartley's work and also introduced several new harmonic patterns, such as the Shark pattern and the 5-0 pattern.
The bullish and bearish Gartley patterns are the oldest recognized harmonic patterns in trading and all the other harmonic patterns are ultimately modifications of the original Gartley patterns. Gartley patterns are fundamentally composed of 5 points, or 4 waves.
Bullish and Bearish Butterfly Patterns
• Bullish butterfly patterns are fundamentally composed of two peaks and three troughs, with the second peak being lower than the first peak. And the third trough being lower than both the second and first troughs, while the second trough is higher than the first.
• Bearish butterfly patterns are fundamentally composed of two troughs and three peaks, with the second trough being higher than the first trough. And the third peak being higher than both the second and first peaks, while the second peak is lower than the first.
The most commonly recognised ratio measurements used by traders today are as follows:
• Wave 1 of the pattern, generally referred to as XA, has no specific ratio requirements.
• Wave 2 of the pattern, generally referred to as AB, should retrace by 78.6% of the range set by wave 1.
• Wave 3 of the pattern, generally referred to as BC, should retrace by at least 38.2%, but no further than 88.6% of the range set by wave 2.
• Wave 4 of the pattern, generally referred to as CD, should extend to at least 161.8%, but no further than 261.8% of the range set by wave 3.
• The last measure, generally referred to as AD, is that of wave 4 as a ratio of the range set by wave 1, which should extend to 127%.
Measurement Tolerances
In general, tolerance in measurements refers to the allowable variation or deviation from a specific value or dimension. It is the range within which a particular measurement is considered to be acceptable or accurate. In this script I have applied this concept to the measurement of harmonic pattern ratios to increase to the frequency of pattern occurrences.
For example, the AB measurement of Gartley patterns is generally set at around 61.8%, but with such specificity in the measuring requirements the patterns are very rare. We can increase the frequency of pattern occurrences by setting a tolerance. A tolerance of 10% to both downside and upside, which is the default setting for all tolerances, means we would have a tolerable measurement range between 51.8-71.8%, thus increasing the frequency of occurrence.
█ FEATURES
Inputs
• AB Lower Tolerance
• AB Upper Tolerance
• BC Lower Tolerance
• BC Upper Tolerance
• CD Lower Tolerance
• CD Upper Tolerance
• AD Lower Tolerance
• AD Upper Tolerance
• Pattern Color
• Label Color
• Show Projections
• Extend Current Projection Lines
█ LIMITATIONS
All green and red candle calculations are based on differences between open and close prices, as such I have made no attempt to account for green candles that gap lower and close below the close price of the preceding candle, or red candles that gap higher and close above the close price of the preceding candle. This may cause some unexpected behaviour on some markets and timeframes. I can only recommend using 24-hour markets, if and where possible, as there are far fewer gaps and, generally, more data to work with.
