WaveTrend Oscillator (Dark Mode) [Krypt]My WaveTrend Oscillator indicator optimized for dark backgrounds. The light mode is available here:
Cari dalam skrip untuk "wave"

WaveTrend Oscillator [Krypt]This is similar to regular WaveTrend Oscillator except:
- replaces hlc3 input with a weighted log formula for better stability/performance on high volatility charts
- zero-centered scaling
- SMA crossovers above and below OB/OS thresholds are marked as buy/sell signals
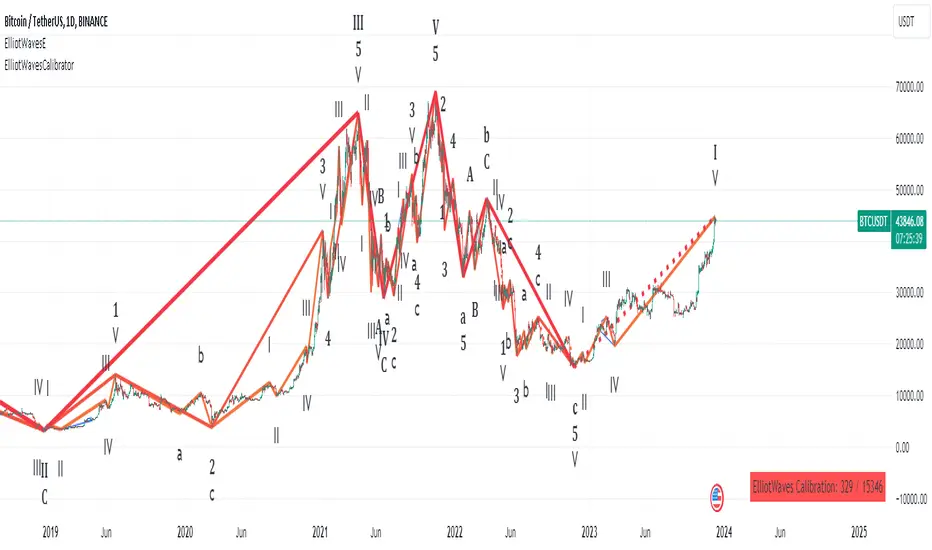
Elliot waves calibratorThis script is a part of the "Elliot waves" toolkit and need to be used with the "Elliot waves" script", because it's generating input parameters for the "Elliot waves" scripts.
You need to add script to chart and on the right bottom corner you can see table with calibration params. Those values you need to copy to "Elliot waves" script settings to see Elliot waves visualization on that chart.
Script settings:
Vertex filter - Value used in the "Elliot waves" script to filter highs and lows that are not an extreme over area width equal to vertex filter value. In edge cases it can change calbiration params. Both scripts should have set the same values of this param.
Troubleshooting:
In case of any problems, please send error details to the author of the script.
Wave Fusion By CryptoScriptsThe Wave Fusion indicator is finally here! This indicator is a combination of the Wave Strength Oscillator and RSVP Extractor. It used a combination of momentum waves, volume, price, RSI, and statistical analysis to help nail down whenever the current price is overextended and due for a reversal. I'm currently using the 1D timeframe for BTC but feel free to experiment on different timeframes to see what works best for you. In the description below, I'll go over each signal, how it's derived, and how to use them!
Oversold (Green shaded area) - The oversold indication appears whenever all oscillators are oversold and is usually a good indicator that a reversal to the upside is around the corner (at least for a short period). Be advised these are the weakest of the three signals so I recommend using this signal with other indicators (such as my MFI Pro).
Overbought (Red shaded area) - The overbought indication appears whenever all oscillators are overbought and is usually a good indicator that a reversal to the downside is around the corner (at least for a short period). Be advised these are the weakest of the three signals so I recommend using this signal with other indicators (such as my MFI Pro).
Green Diamond - The green diamonds indicate whenever one or more oscillators are oversold AND one or more oscillators are outside of the bollinger bands, which is great for catching reversals to the upside. These may come two or three at a time so it may be best to wait until they have all printed before entering.
Red Diamond - The red diamonds indicate whenever one or more oscillators are overbought AND one or more oscillators are outside of the bollinger bands which is great for catching reversals to the downside (as seen in the chart). These may come two or three at a time so it may be best to wait until they have all printed before entering.
Rocket - The rocket symbol occurs whenever ALL oscillators are oversold and one or more oscillators are outside of the bollinger bands . This is great for catching reversals to the upside but may come two or three at a time so it may be best to wait until they have all printed before entering.
Red Alarm - The red alarm symbol occurs whenever ALL oscillators are overbought and one or more oscillators are outside of the bollinger bands . This is great for catching reversals to the downside but may come two or three at a time so it may be best to wait until they have all printed before entering.
Moon - The Moon symbol occurs whenever ALL oscillators are oversold and ALL oscillators are outside of the bollinger bands . This is great for catching reversals to the upside but may come two or three at a time so it may be best to wait until they have all printed before entering.
Blood Moon - The red alarm symbol occurs whenever ALL oscillators are overbought and ALL oscillators are outside of the bollinger bands . This is great for catching reversals to the downside but may come two or three at a time so it may be best to wait until they have all printed before entering.
Strongest to Weakest Buy Signals - Moon --> Rocket --> Green Diamond --> Green Shaded Area
Strongest to Weakest Sell Signals - Blood Moon --> Red Alarm --> Red Diamond --> Red Shaded Area
Input Options
Show Histogram - I also included a Histogram in the indicator to help gauge the level of buys/sell strength but kept it hidden for the default levels (i.e a green diamond with a red histogram bar is usually a good sign a reversal is about to happen to the upside whereas a green diamond with a green histogram bar may indicate a false reversal and there's still more room to the downside until a red bar appears. Always backtest this!)
Show Overbought/Oversold Levels - This is if you want to ignore all of the green/red shaded areas and only focus on the diamonds and rocket/alarm signals
Wave Overbought/Oversold Levels - Free free to change to value of the overbought/oversold levels to change where the green/red shades areas print
Momentum Overbought/Oversold Levels - Free free to change to value of the overbought/oversold levels to change where the green/red shades areas print
Histogram Length - This will not change anything with the signals but I included it so you can change the visuals if it helps you
Momentum Length - This will change where the signals plot
Momentum Signal - This only changes the yellow signal line and nothing else. It's not incorporated into any equation
Average Length - This will change where the signals plot
Alerts
I've set alerts on this indicator for each icon (Oversold, Overbought, Green Diamond, Red Diamond, Rocket, Red Alarm, Moon , Blood Moon). I HIGHLY recommend setting the alerts for Candle Close so that you can be sure the signal is confirmed.
You may notice that the indicator can give multiple signals back-to-back or be overbought/oversold for multiple candles. When this happens, it's best to look at other indicators such as the MFI Pro, MACD, etc to nail the best entry and have confluence with your decision. With that said, having multiple signals back-to-back can also be an indication that the move is close to happening. This indicator works with crypto and stocks as well.
If you have any questions or would like to purchase this indicator, please comment below or PM me. I also made a video tutorial for the indicator on my Youtube channel (link is next to my profile pic)
Be advised past performance is not indicative of future returns. Backtest EVERY timeframe and NEVER blindly take signals! Also, never invest more than you can afford to lose.
Enjoy :)

Wave Cycle StochasticThis is based of a modified stochastic numbers. The settings come from Barry Burn's foundation and advanced courses.
There are two stochastic indicators one on top of another. at the same time, you can turn off the lines and show the moving averages of percent D and percent K, this is something I added personally to farther investigate if they can be helpful or not.
Those who went through Barry's courses know that is oscillator is being used to find cycle high and cycle low in waves. Also Barry teaches what he calls mini-divergence and for that he uses this same oscillator. If you switch to weekly chart, the settings will automatically switch to those Barry teach for non 1 to 3 ratio situations so you don't need to worry about that. If seeing the higher time frame cycle indicator on the same oscillator is bothering you, you can again add another copy and only keep that one and turn off the rest.

Elliott Wave Noise FilterElliott Wave Noise Filter
Overview
The Elliott Wave Noise Filter is a specialized indicator for TradingView, designed to solve one of the biggest challenges in Elliott Wave analysis on lower timeframes: the identification of market noise. By combining multiple advanced filtering techniques, this indicator helps distinguish meaningful price action from random fluctuations.
The Problem
On lower timeframes—especially below 15 minutes—Elliott Wave analysis is significantly impacted by excessive market noise. This noise can lead to misinterpretation of wave structures, making it difficult to execute reliable trading decisions.
The Solution
The Elliott Wave Noise Filter utilizes four powerful methods to detect and filter noise:
ATR-Based Volatility Analysis: Identifies price movements too small to be structurally meaningful
Volume Confirmation: Filters out price moves that occur with insufficient volume
Trend Strength Measurement (ADX): Detects periods of weak trend activity, where noise tends to dominate
Fractal Pattern Recognition: Marks significant turning points that could be relevant for Elliott Wave analysis
Features
Visual Indicators
Background Coloring: Red indicates noise; green signifies a clear signal
Hull Moving Average: Smooths price action and highlights the prevailing trend
Fractal Markers: Triangles mark significant highs and lows
Status Panel: Displays current noise status and ADX value
Customization Options
ATR Period: Adjust the lookback period for ATR calculations
Noise Threshold: Defines the percentage of ATR below which a movement is considered noise
Volume Filter: Can be enabled or disabled
Volume Threshold: Sets the ratio to average volume for a move to be deemed significant
Hull MA Display and Length: Configure the moving average settings
ADX Parameters: Adjust trend strength sensitivity
Use Cases
For Elliott Wave Analysis
Eliminate noise to identify cleaner wave structures
Use fractal markers as potential wave endpoints
Reference the Hull MA for determining the broader trend
For General Trading
Identify high-noise periods to avoid low-quality setups
Spot clearer market phases for better entries
Assess price action quality through visual cues
Multi-Timeframe Approach
Apply the indicator across different timeframes for a comprehensive view
Prefer trading when both higher and lower timeframes align with consistent signals
Optimal Settings
For Very Short Timeframes (1–5 minutes)
Higher Noise Threshold (0.4–0.5)
Longer ATR Period (20–30)
Higher Volume Threshold (1.0–1.2)
For Medium Timeframes (15–60 minutes)
Medium Noise Threshold (0.2–0.3)
Standard ATR Period (14)
Standard Volume Threshold (0.8)
For Higher Timeframes (4h and above)
Lower Noise Threshold (0.1–0.2)
Shorter ATR Period (10)
Lower Volume Threshold (0.6–0.7)
Conclusion
The Elliott Wave Noise Filter is an essential tool for any Elliott Wave analyst or trader working on lower timeframes. By reducing noise and emphasizing significant market movements, it enables more precise analysis and potentially more profitable trading decisions.
Note: As with any technical indicator, the Elliott Wave Noise Filter should be used as part of a broader trading strategy and not as a standalone signal for trade execution.

Waves and Harmonic Patterns by BULL┃NETThe B | N WAHA (Waves and Harmonic Patterns by BULL | NET)
indicator provides traders using CFD brokers with the most significant price and time events from the stock exchange of the underlying original index or security. For example traders are able to easily identify the price at the Daily Open and Close time of up to three additional stock exchanges. Traders can choose from a huge list of options including the values from the current and previous Day, Week, Month and Year. In addition traders can enable the display of the Expected Move by either implied or historical volatility. The indicator can show Open Gaps (gap between close and open of two trading sessions) also which traders would usually see only on the original chart of an index or security.
The B | N WAHA indicator can help traders to make better entry decisions based on the real market sessions.
█ ⚠️ DISCLAIMER – READ BEFORE YOU USE ⚠️
█ FEATURES
— PATTERN OPTIONS
● Deviation for ratio calculation
Any pattern has a unique set of ratios for different retracements. In a perfect world each ratio would be hit exactly. But the stock market is far from perfect and especially in volatile markets ratios have to be adjusted. The default is 5%. The maximum is 10%
● (Name of pattern)
The list of patters recognized will grow with new versions of the indicator. The settings for each pattern are the same.
Each available pattern will be recognized and drawn by default. If you disable the checkbox in front of the pattern name the indicator will ignore this pattern completely no matter if another checkbox for this pattern is active.
● Developing
As soon as a new possible pattern is recognized, the indicator will draw a label at the starting point (0, A or X) of the pattern. For the indicator “possible” means there is only the last point missing, which is D in case of ABCD and XABCD patterns. Once the last point has reached the completion price range, the indicator will draw the pattern. If you enable this checkbox the indicator will draw a zickzack line between the already existing points.
● Projection
If there is a new possible pattern the indicator will draw a projection box to indicate the price range where the final point has to be located for completion of the pattern. Don’t confuse this with a buy or sell signal! The appearance of the box doesn’t tell anything about the chance of a pattern to get completed. It simply tells you that the price has to reach the box and to retrace within the box to form a valid pattern. This allows you to prepare a strategy if the price hits the box. If you disable the checkbox no box will be drawn.
● History
For backtesting or learning purpose you can display all historical occurrences of a pattern. Best practice is to disable all other patterns and enable the history checkbox only together with the checkbox of the patten name.
— PIVOPOINT OPTIONS
To identify patterns you need pivot points. True high and lows in the chart. If you use B | N GABO or B | N DESC you already know about this concept. The indicator is using three different levels of pivot points in parallel for better detection of patterns.
● Level 1
This is the fast running pivot level. You can choose from 2 to 4. Default is 3.
● Level 2
This is the pivot level with medium pace. Selectable levels are 5 to 9. Default is 5.
● Level 3
This is the slow running pivot level. The minimum level is 10, the maximum is 20. The default is 15.
● Pivotpoints
By default pivot points are not displayed on the chart because this ads a lot of noise. For backtesting and learning purposes you can enable this option.
● Label
● Text
● Size
This three settings define the appearance of the pivot points.
— HARMONIC PATTERN OPTIONS
The settings in this section control how the zickzack line of a pattern gets drawn on the chart. The settings for bullish and bearish pattern are identical.
● Show bullish/bearish pattern
By default both types of patterns are drawn on the chart. For backtesting or learning purpose you can disable it.
● Line
The color of the zickzack lines.
● ABC
The line style to connect points A, B and C.
● CD
The line style to connect points C and D.
● (Line Width)
The width of lines ABC and CD.
● Label
The color of the label for a completed pattern. This label marks starting point.
● Developing
The color of the label while a pattern is developing.
● Text
The color of the text in the label.
● (Text size)
The size of the text.
— HARMONIC PATTERN LABEL OPTIONS
The label which marks the start of a pattern can contain multiple information. To reduce noise on the chart you can disable each information separately. If you disable them all, the label will display the designation of the pattern starting point, e.g. “A” for an ABCD or “X” for an XABCD.
● Title
The title identifies the type of pattern. E.g. a possibly developing ABCD pattern will display ABC at the beginning to denote the point A, B and C have been detected. If this pattern completes the title would change to ABCD in case of a standard ABCD pattern or to AB=CD if the pattern matches all criteria needed for this ‘perfect’ type of ABCD.
● Number
Each pattern carries a unique number needed to identify the projection and targets in case there are multiple patterns in parallel.
● Ratio
First this is the retracement level of point C from point B toward point A. It is the decimal value of the percentage. In a perfect world this would be 0.618 (61.8%). In volatile markets this can be as low as 0.382 and as high as 0.786. If Ratio is enabled BD ratio will get displayed as well once point D is about to complete a ABCD pattern.
● Tooltip
Enabled by default the tooltip shows all the information and more if you hover the mouse pointer over the label.
● Perfect
If the pattern is formed “perfect” it will change its color to denote a possibly strong trend reversal. E.g. a perfect AB=CD is formed if the time and price difference between A and B is equal to the time and price difference between C and D. The calculation contains a 5% deviation to reflect usual market conditions.
— PROJECTION OPTIONS
If the “Projection” checkbox of a pattern is enabled (See PATTERN OPTIONS) the indicator will display the price range where the final point must sit to form a valid pattern. You can customize the box that marks this price range or disable it at all.
● Bull / Bear
The color of the box border.
● (Style)
The line style of the box border.
● Background
The background color of the box.
● Text
The color of the text in the box.
● (Text size)
The size of the text.
— PROJECTION DESCRIPTION OPTIONS
The box which marks the possible landing zone for pattern completion can contain multiple information. To reduce noise on the chart you can disable each information separately.
● Price Range
To complete a pattern successfully point D needs to be located within the minimum and maximum price of the range. For bullish pattern the price range is increasing (e.g. 100 – 120) and for bearish pattern it is decreasing (e.g. 100 – 80).
● Title
The title identifies the type of pattern. E.g. a possibly developing ABCD pattern will display ABC at the beginning to denote the point A, B and C have been detected. If this pattern completes the title would change to ABCD in case of a standard ABCD pattern or to AB=CD if the pattern matches all criteria needed for this ‘perfect’ type of ABCD.
● Number
Each pattern carries a unique number needed to identify the projection and targets in case there are multiple patterns in parallel.
— TARGET OPTIONS
● Display ABCD Targets
Once a pattern is completed the indicator will display multiple price lines for targets or other important price levels. This is enabled by default.
The cosmetic setting are separated for bullish and bearish pattern targets. However they are identical.
● Bull / Bear Line
The color of the target lines.
● (Line style)
The style of the target lines.
● Label
The color of the label which contains information about the target.
● Text
The color of the text in the label.
● (Text size)
The size of the text.
— TARGET LABEL OPTIONS
The target label can contain multiple information. To reduce noise on the chart you can disable each information separately. If you disable all information a blank label will be displayed necessary to hold the tooltip.
● Price
The target price.
● Number
The unique number of the pattern.
● Title
The target identifier.
● Direction
New traders often get confused with bullish and bearish pattern. A small arrow facing down or up will tell them the expected price move to reach the targets.
● Tooltip
If enabled the tooltip shows all the information and more if you hover the mouse pointer over the label.
● Remove if hit
By default target lines and labels will get removed one bar after the price has hit the target. If you disable this option target lines will stay together with the pattern until it gets invalidated.
— DISPLAY OPTIONS
● 2 Decimals
To streamline the appearance of prices they are set to display two decimals only. Numbers get rounded! However, trading currency pairs or crypto assets might need to display the full amount of decimals. In this case simply disable the setting “2 Decimals”.
— ALERT OPTIONS
Bevor you can use alerts in TradingView you have to activate them.
1. Click on the alert button
2. From the first drop down in conditions select B | N WAHA
3. From the third drop down (the one below the first one) select Any alert() function call
4. Skip the expiration if you want the alerts to be active for ever
5. Give The Alert a name or keep the default
6. Click on create
You have to repeat this procedure in every timeframe you use. This is not a limitation of the indicator. This is how TradingView alerts work.
Now you can select the events in the alert options of B | N WAHA you want to get noticed about. Alerts get fired when a bar gets confirmed which is the last close of a bar.
-------------------------------------------------------
Disclaimer BullNet: The information provided in this document is for educational and informational purposes only and does not constitute financial, investment, or trading advice. Any use of the content is at your own risk. No liability is assumed for any losses or damages resulting from reliance on this information. Trading financial instruments involves significant risks, including the potential loss of all invested capital. There is no guarantee of profits or specific outcomes. Please conduct your own research and consult a professional financial advisor if needed.
Disclaimer TradingView: According to the www.tradingview.com
Copyright: 2025-BULLNET - All rights reserved.
Roadmap:
Version 1.0 03.03.2025

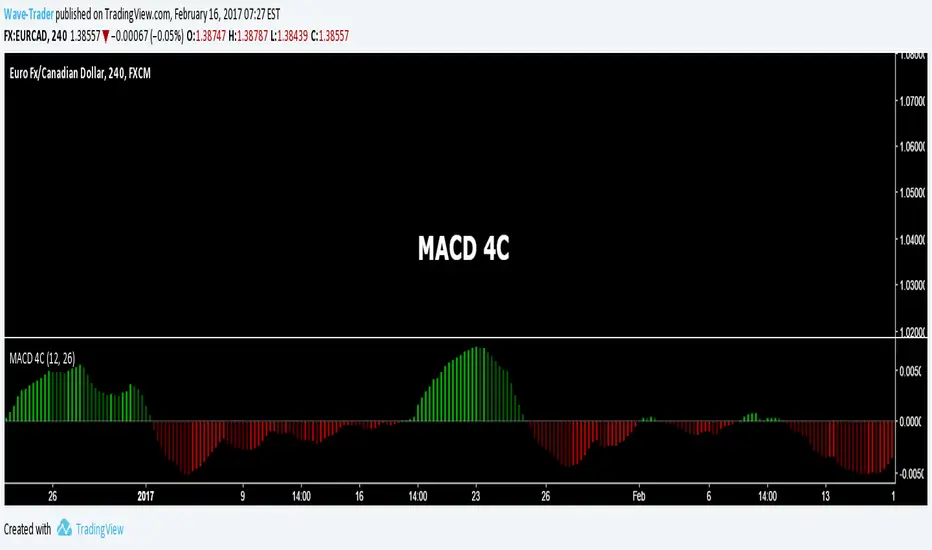
Volume Wave Trend ConfirmationUtility of the Indicator
The core utility of this indicator lies in its ability to utilize volume, a less frequently exploited metric in MACD analysis, providing several strategic advantages:
Trend Confirmation: By focusing on volume, the indicator confirms whether movements in price are backed by significant trading activity. A rising MACD line above the signal line, paired with increasing volume, can confirm the strength of an uptrend. Conversely, if the histogram turns negative while the MACD line falls below the signal line during a price drop, it confirms a robust downtrend.
Early Warning Signals: Changes in the histogram and divergences between the MACD and Signal lines can serve as early warnings of potential reversals or slowdowns in market momentum. For instance, a shrinking histogram in an uptrend might suggest that the upward movement is losing steam.
Market Sentiment: The integration of volume into the MACD framework allows the indicator to provide insights into underlying market sentiment. Higher volumes during price movements indicate stronger conviction among traders, making the trend more reliable.
Indicator Functionality
The "Volume Wave Trend Confirmation" indicator is built on the Moving Average Convergence Divergence (MACD) framework, but with a unique twist: it uses the smoothed moving averages (SMA) of trading volumes instead of price. The indicator calculates two specific SMAs of the volume — a shorter 33-period SMA and a longer 100-period SMA — and computes their difference. This difference is then used as the input for the MACD calculation, with typical parameters set at 12, 26, and a signal line of 9.
MACD Line (Blue): Represents the main line, calculated as the difference between the 12-period and 26-period exponential moving averages (EMA) of the volume difference.
Signal Line (Orange): A 9-period EMA of the MACD line, acting as a trigger for buy or sell signals.
Histogram (Blue/Purple): Measures the distance between the MACD line and the Signal line, colored blue when positive (above the Signal line) and purple when negative (below the Signal line).

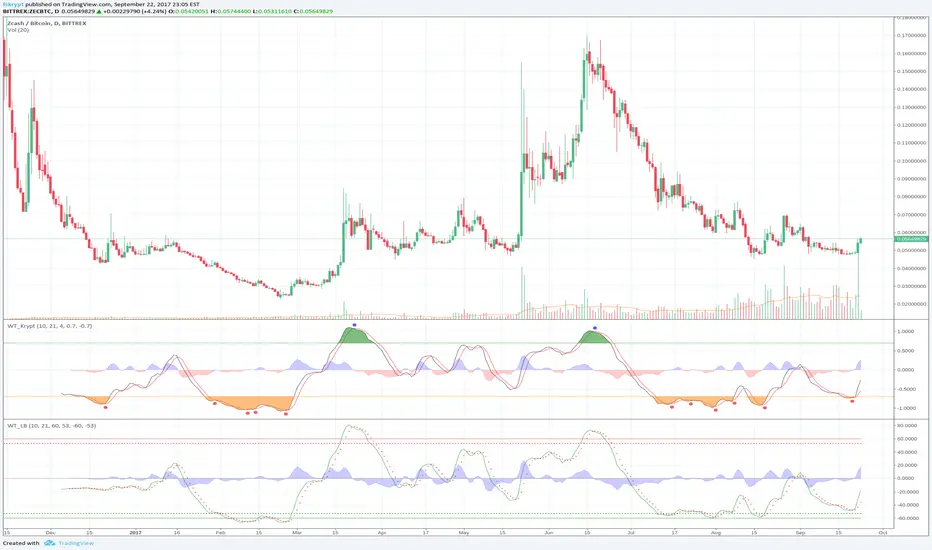
Wave TrendThe Wave Trend indicator is based on the Mason’s Line Indicator.
This indicator is a sentiment analysis tool designed to help traders understand and analyze market trends. It works by calculating the average investor satisfaction of a group of investors. The results are displayed as colored squares at the bottom of the chart. For more information, read the description of the Mason's Line Indicator.
This indicator is not developed for use on short timeframes. It is an indicator that is best suited for longer timeframes, ideal for swing trading or long-term trading.
There are two main display parameters:
Display the coloured squares according to the distance to the sma (default value).
Display the squares according to the position of satisfaction in relation to the scale of the indicator.
there are two secondary settings for each of these options:
Display the squares by normalizing the values of the dataset between 0 and 1.
Display the squares without normalizing the value of the dataset between 0 and 1 (default value).
Please note that the Wave Trend Indicator is not a guarantee of future market performance and should be used in conjunction with proper risk management. Always ensure that you have a thorough understanding of the indicator’s methodology and its limitations before making any investment decisions. Additionally, past performance is not indicative of future results.

Wave Strength Oscillator By CryptoScriptsThe Wave Strength Oscillator uses a combination of wave strength and momentum to help catch the best entries for reversals and does so using a few methods. I'm currently using the 1h timeframe for BTC but feel free to experiment on different timeframes to see what works best for you. In the description below, I'll go over each signal, how it's derived, and how to use them!
Oversold (Green shaded area) - The oversold indication appears whenever both oscillators are oversold and is usually a good indicator that a reversal to the upside is around the corner (at least for a short period). Be advised these are the weakest of the three signals so I recommend using this signal with other indicators.
Overbought (Red shaded area) - The overbought indication appears whenever both oscillators are overbought and is usually a good indicator that a reversal to the downside is around the corner (at least for a short period). Be advised these are the weakest of the three signals so I recommend using this signal with other indicators.
Green Diamond - The green diamonds indicate whenever one or both of the oscillators are oversold AND they are both outside of the bollinger bands which is great for catching reversals to the upside (as seen in the chart). These may come two or three at a time so it may be best to wait until they have all printed before entering.
Red Diamond - The red diamonds indicate whenever one or both of the oscillators are overbought AND they are both outside of the bollinger bands which is great for catching reversals to the downside (as seen in the chart). These may come two or three at a time so it may be best to wait until they have all printed before entering.
Rocket - The rocket symbol occurs whenever BOTH oscillators are oversold and BOTH oscillators are outside of the bollinger bands. This is great for catching reversals to the upside but may come two or three at a time so it may be best to wait until they have all printed before entering.
Red Alarm - The red alarm symbol occurs whenever BOTH oscillators are oversold and BOTH oscillators are outside of the bollinger bands. This is great for catching reversals to the downside but may come two or three at a time so it may be best to wait until they have all printed before entering.
Input Options
Show Histogram - I also included a Histogram in the indicator to help gauge the level of buys/sell strength but kept it hidden for the default levels (i.e a green diamond with a red histogram bar is usually a good sign a reversal is about to happen to the upside whereas a green diamond with a green histogram bar may indicate a false reversal and there's still more room to the downside until a red bar appears. Always backtest this!)
Show Overbought/Oversold Levels - This is if you want to ignore all of the green/red shaded areas and only focus on the diamonds and rocket/alarm signals
Wave Overbought/Oversold Levels - Free free to change to value of the overbought/oversold levels to change where the green/red shades areas print
Momentum Overbought/Oversold Levels - Free free to change to value of the overbought/oversold levels to change where the green/red shades areas print
Histogram Length - This will not change anything with the signals but I included it so you can change the visuals if it helps you
Momentum Length - This will change where the signals plot
Momentum Signal - This only changes the yellow signal line and nothing else. It's not incorporated into any equation
Average Length - This will change where the signals plot
Alerts
I've set alerts on this indicator for each icon (Oversold, Overbought, Green Diamond, Red Diamond, Rocket, Red Alarm). I HIGHLY recommend setting the alerts for Candle Close so that you can be sure the signal is confirmed.
You may notice that the indicator can give multiple signals back-to-back or be overbought/oversold for multiple candles. When this happens, it's best to look at other indicators such as the RSI , MFI Pro, etc to nail the best entry and have confluence with your decision. With that said, having multiple signals back-to-back can also be an indication that the move is close to happening. This indicator works with crypto and stocks as well.
If you have any questions or would like to purchase this indicator, please comment below or PM me. I also made a video tutorial for the indicator on my Youtube channel (link is next to my profile pic)
Be advised past performance is not indicative of future returns. Backtest EVERY timeframe and NEVER blindly take signals! Also, never invest more than you can afford to lose.
Enjoy :)

Waves Market CapHello traders!
This is Market Cap chart of Waves cryptocurrency with some additional features.
What is included
Dynamic market capitalization chart
Customizable SMA of the market capitalization
Crossovers highlighting
Alerts for crossovers
Alert for the specified positive % change
Alert for the specified negative % change
How to get access
Buy for only 20$ to get lifetime access to this indicator
Like and follow for more cool indicators!
Happy Trading!

Wave Consolidation [LuxAlgo]The Wave Consolidation indicator uses market profiles to highlight consolidation zones based on upward and downward moves determined when a Higher-High or Lower-Low is created.
Users can control the amount of consolidation zones to display and the sensitivity of the swing point detection used to return those zones.
🔶 USAGE
These zones are intended as areas of interest to traders where price has seen historical interactions, which can be interpreted as support and resistance. By identifying these areas of interest before the price returns to them, traders are able to anticipate and prepare for various scenarios and respond dynamically to the behavior of the market, as seen below.
Rejection: A quick move away from the zone may indicate that the area is either overvalued or undervalued, leading to a fast movement in the opposite direction.
Breakthrough: Moving beyond a zone could indicate acceptance at that specific price, potentially signaling a shift in momentum or the start of a new trend. In a strong major trend, zones created from smaller trends could be used as price targets for taking profit and managing risk.
Consolidation: Holding these zones might suggest a market in balance at these levels, this could lead to opportunities for range-bound trading.
Below is an example of the Rejection and Consolidation scenarios described above.
Note: By analyzing the tests and retests of these zones, traders can also gain further insight into where participants are interacting in the market.
🔶 DETAILS
The full process for acquiring and managing these zones is described in the sub-sections below.
🔹 Creation
By only considering market movements creating a higher-high or lower-low, we can identify meaningful, directional, moves which can then be used to calculate zones.
Once a move is identified, the script calculates a volume profile spanning the length of the given move.
The width of the zones is determined starting from the POC of the profile and expanding outwards until the value of the profile's row falls below the profile's average.
Note: By increasing the "Multiplier" Input, Users can increase the threshold the script uses to determine zone width in multiples of Standard Deviations above the Average.
While this area is similar to a VP Value Area, it is not intended to replicate a value zone. The calculation is not concerned with capturing any % of the total profile's volume within the zone and only analyzes based on a fixed inclusion threshold.
🔹 Management
To keep clutter to a minimum, If a new zone overlaps a recently created zone, the zones are grouped as one. This is especially helpful in areas where prices are ranging, creating multiple zones in a very similar area.
Zones before management:
Zones after management:
🔹 Deletion
Just because a zone is crossed, does not make it immediately unimportant!
Once a Zone is mitigated (crossed in the opposite direction of its bias) it is reduced to a single dotted line representing the outer threshold for the zone. These lines are important to watch, as the price will often retest a break. For this reason, they will stay on the chart until the next swing point is detected when they will finally be deleted for good.
Below is an example of activity around a broken zone before it is deleted.
Below is the same example 2bBars later , once the new swing is confirmed, the dotted lines are deleted and new zones are created.
Notice how the newly formed resistance zone is in the same area where we noticed sellers previously.
🔶 SETTINGS
🔹 Structure
Display Structure: Determines if swing structures are displayed.
Structure Length: Sets Length for structure identification.
🔹 Zones
Volume-Based Calculations: Opt to use a "Volume" based Profile Calculation instead of the default "Price Action" based Calculation.
Display Count: Sets the specific number of bullish and bearish zones to display on the chart.
Multiplier: Sets the multiplier to use for the value cut-off for determining zone boundaries.
🔹 Style
Display Average Lines: Toggles on/off the average (mid) lines for the zones.

Wave Trend Momentum OscillatorThis momentum oscillator is instantaneous and also extremely accurate. For use on all timeframes. Shows wave trend momentum as well as reliable diversions. A secondary crossover (Wave Trend Crossover) can be turned on to give even earlier entries and exits. This indicator has the ability to show changes in trend before it happens. Diversions can be turned off in settings.
There are 3 different smoothing options to tune the indicator to your chart/timeframe. Default setting is HULL.
Wave trend has 4 coloring options: sold, dual color 1, dual color 2 or none (dont show wave trend).
A J line can be turned on in settings as well as the wave trend crossover.

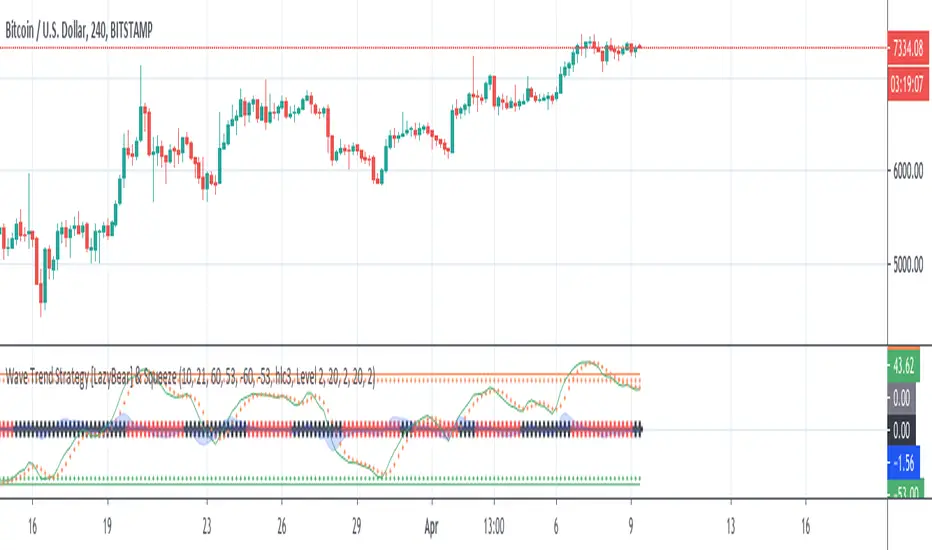
Wave Trend Strategy [LazyBear] & SqueezeThis strategy is a port of famous script Wave Trend Oscillator with a plus: squeeze indicator (LazyBear).
@author LazyBear
Original study from LazyBear
Scope of this port is to identify corrects inputs to get best results from signals that indicator gives.
The squeeze gives a further filter before orders and avoid to enter in a flat market period.
I attached it to chart with heikin ashi candles to have a better result and remove noise: results are good.
Please use comment section for any feedback.
Next improvement (only to whom is interested to this script and follows me): study with alerts on multiple tickers all at one. Leave a comment if you want to have access to study.
********************************** IMPORTANT*******************************
I have developed an expert advisor for metatrader4 (MT4): results of expert advisor form 2015-01-01 to 2018-11-25 are very good with low drawdown and good profit.
********************************************************************************
Wave & Trend Accompanying Backtesting StrategyVersion 1.0
Purpose
This backtesting strategy indicator is a accompanying tool for use with my popular trading and alert indicator: Wave & Trend Autoview Advanced Indicator & Alerts
Reference Indicator Link:
Features
This strategy has been programmed to act exactly how the accompanying indicator would be used with an automated strategy such as Autoview or through manual trading
Has identical coloured signals with correct icons for reference with the indicators standard alert conditions (BUY/SELL)
The ability to toggle on or off all the logic and UI presets you could previously use to enhance the standard indicator
No short / longs for the most accurate representation of buys and sells, The strategy will keep buying on every optimal signal (+1 order quantity each time) and then sell all assets on a met sell condition (-all quantity), matching exactly how the reference indicator is used to buy/sell on eg. Binance and also give the most accurate statistics.
Fully customisable in the settings regarding trading strategy to match exactly how you have the reference indicator set up with alerts or how you are trading manually with it.
Ability to choose a timeframe, want to ignore the crypto boom at the latter stages of 2017? Sure you can, change the time frames in the settings to see a more recent representation of your trades.
Access
This indicator is free for existing owners of my Wave & Trend Indicator linked above as an accompanying tool to improve their strategy and net more profit. If you would like access to any of my indicators or would like to know more please find me on my community discord channel where you can find indicator details/documentation and general help:
Discord Link: discord.gg
Thank you for the immense support everyone, happy trading!
- Falco

Wave & Trend Autoview Advanced Indicator & AlertsWave & Trend Autoview Advanced Indicator & Alerts - Version 1.0
Overview
This Lazybear inspired indicator is a complex and deeply customisable wave based oscillator that allows for full customisation of parameters and 3 toggleable strategies to allow the user to shape their trading methods to their preferences. The indicator was built for use with Autoview using all functionality or in conjunction with Profit Trailer 2.0 to handle the buying side of logic at an even more advanced level. The creation of this was fuelled by the need to create a cheaper alternative to those that charge monthly for similar signals, which I am deeply against.
Features
Wave Based Buying - those familiar with buying based with RSI based approaches will feel very comfortable with this signal as it detects areas of deeply oversold / overbought and buys on the reversal
Fully customisation - All parameters are open for customising to allow the trader to build their own strategy and adapt from market to market
3 Built In Signal Strategies - Clearly labelled in the parameters as A/B/C are the built in strategies that all have completely unique buying / selling logic and are based on different risk / reward levels. Include all 3 or focus on one or two to build your perfect strategy
Downtrend Detection - This indicator has an in-built downtrend detection that is modifiable in the parameters meaning no more deep bags - the strategies will always try to buy on the uptrend.
Access
48H Trial Period By Request
Full Access is 0.15 ETH , one time fee for full unlimited access to the indicator and future updates but also my well received support and mentoring on my work afterwards to help you built a perfect strategy.
Previous owners of my work get 50% off the price for being one of my supporters.


Auto Motive Wave [Trendoscope]Earlier we created an interactive script to study Motive Waves by manually selecting the wave patterns on the chart.
You can find the open source script here:
In this indicator, we will try to do it automatically. Hence, you don't need to draw the waves manually to check anymore. The indicator will do it for you.
🎲 Conditions for Motive Wave
Rules for Motive Waves remain same as before. Motive wave can be either Impulse or Diagonal Wave. Diagonal wave can be either expanding or contracting diagonals. To learn more about diagonal waves, please go through this idea.
🎲 Rules for generic motive waves are as below
Pivots in order - Checks wether the pivots selected are in progressive order.
Directions in order - Checks if the pivot directions are correct - either PH, PL, PH, PL, PH, PL or PL, PH, PL, PH, PL, PH
Wave 2 never moves beyond the start of wave 1 - Wave 2 retracement is less than 100% of wave1
Wave 3 always moves beyond the end of wave 1 - Wave 3 retracement is more than 100% of wave2
Wave 3 is never the shortest one - Checks if Wave 3 is bigger than either Wave 1 or wave 5 or both.
🎲 Now, these are the specific rules for Impulse Waves on top of Motive Wave conditions
Wave 4 never moves beyond the end of Wave 1 - meaning wave 1 and wave 4 never overlap on price scale.
Wave 1, 3, 5 are all not extended. We check for retracement ratios of more than 200% to be considered as extended wave.
🎲 Below are the conditions for Diagonal Waves on top of Motive Wave conditions
Wave4 never moves beyond the start of Wave 3 - Wave 4 retracement is less than 100%
Wave 4 always ends within the price territory of Wave 1 - Unlike impulse wave, wave 4 intersects with wave 1 in case of diagonal waves. This is the major difference between impulse and diagonal wave.
Waves are progressively expanding or contracting - Wave1 > Wave3 > Wave5 and Wave2 > Wave4 to be contracting diagonal. Wave1 < Wave3 < Wave5 and Wave2 < Wave4 to be expanding diagonal wave.
Settings are for the indicator include option to select zigzag length, theme color, and few constraints about the waves to be scanned. You can use the tooltips to find more about them

Interactive Motive Wave ChecklistHere is an interactive tool that can be used for learning a bit about Elliott Waves
🎲 How it works?
The script upon load asks users to enter 6 pivots in an order. Once all 6 pivots are selected on the interactive chart, the script will calculate if the structure is a valid motive wave.
When you load the script, you will see a prompt on the chart to select points on the chart to form 6 pivots.
When you select the 6 pivots, the checklists are populated on the chart to notify users which conditions for qualifying the selection has passed and which of them are failed.
🎲 Conditions for Motive Wave
Motive wave can be either Impulse or Diagonal Wave. Diagonal wave can be either expanding or contracting diagonals. To learn more about diagonal waves, please go through this idea.
Rules for generic motive waves are as below
Pivots in order - Checks wether the pivots selected are in progressive order.
Directions in order - Checks if the pivot directions are correct - either PH, PL, PH, PL, PH, PL or PL, PH, PL, PH, PL, PH
Wave 2 never moves beyond the start of wave 1 - Wave 2 retracement is less than 100% of wave1
Wave 3 always moves beyond the end of wave 1 - Wave 3 retracement is more than 100% of wave2
Wave 3 is never the shortest one - Checks if Wave 3 is bigger than either Wave 1 or wave 5 or both.
Now, these are the specific rules for Impulse Waves on top of Motive Wave conditions
Wave 4 never moves beyond the end of Wave 1 - meaning wave 1 and wave 4 never overlap on price scale.
Wave 1, 3, 5 are all not extended. We check for retracement ratios of more than 200% to be considered as extended wave.
Below are the conditions for Diagonal Waves on top of Motive Wave conditions
Wave4 never moves beyond the start of Wave 3 - Wave 4 retracement is less than 100%
Wave 4 always ends within the price territory of Wave 1 - Unlike impulse wave, wave 4 intersects with wave 1 in case of diagonal waves. This is the major difference between impulse and diagonal wave.
Waves are progressively expanding or contracting - Wave1 > Wave3 > Wave5 and Wave2 > Wave4 to be contracting diagonal. Wave1 < Wave3 < Wave5 and Wave2 < Wave4 to be expanding diagonal wave.
Here is an example of diagonal wave projection
Here is an example of impulse wave projection

Motive Wave Scanner [Trendoscope®]Motive Wave Scanner is a simple algorithm to find out motive waves as per the rules of Elliott Wave theory.
It is an extension to our previous open source script Interactive Motive Wave Checklist which provides interactive capability to select six points of a five wave formation. Once users select them, the rules of motive waves are applied to manually selected points to highlight them as either diagonal wave, motive wave or none.
This indicator does the same. But, instead of requesting the pivots manually from the user, the indicator automatically picks and scans them through zigzag.
We have already published a similar script as protected source. But, due to some changes in the pine engine, there have been few issues in the runtime. In this publication, we not only address those runtime issues but also making it open source for the users to make use of the source code and enhance it further.
🎲 What are motive waves
Motive waves are strong upward or downward movement with 5 subwaves.
Motive Wave in the upward direction will start with Swing High, Ends with Swing High and consists of 3 Higher Highs and 2 Higher Lows representing strong upward trend.
Motive Wave in the downward direction will start with Swing Low, Ends with Swing low and consists of 3 Lower Lows and 2 Lower Highs representing strong downward trend.
🎲 Types of Motive Waves
Motive Waves are broadly classified by two types:
Impulse Waves
Diagonal Waves
Diagonal Waves are further classified into Contracting and Expanding Diagonals. These can fall into the category of either leading diagonal and ending diagonal.
🎲 Rules of Motive Waves
🎯 Generic Rule of any motive waves are as follows
Should consist of 5 alternating waves. (Swing High followed by Swing low and vice versa)
This can start from Swing High and end in Swing High or start from Swing Low and end in Swing Low of a zigzag.
Wave-2 should not move beyond Wave-1. This means, the Wave-2 is always shorter than Wave-1 with respect to distance between the price of start and end.
Wave-3 always moves beyond Wave-1. This means, the Wave-3 is always longer than Wave-2 in terms of price
Among Wave-1, Wave-3, and Wave-5, Wave-3 is never the shortest one. This means, either Wave-1 or Wave-5 can be longer than Wave-3 but not both. Wave-3 can also be longest among the three.
Here is the pictorial representation of the rules of the Motive Waves
For a wave to be considered as motive wave, it also needs to follow the rules of either impulse or diagonal waves.
🎯 Rules for a 5 wave pattern to be considered as Impulse Wave are:
Wave-4 never overlaps with Wave-1 price range
Wave-1, Wave-3 and Wave-5 should not be either expanding or contracting. Meaning, we cannot have Wave-1 > Wave-3 > Wave-5 , and we cannot have Wave-1 < Wave-3 < Wave-5
Pictorial representation of the impulse wave rules are as below:
🎯 Rules for the Diagonal Waves are as follows
Contrary to the first rule of impulse wave, in case of diagonal wave, Wave-4 always overlaps with Wave-1 price range. But, it will not go beyond Wave-3
Waves are progressively expanding or contracting - Wave1 > Wave3 > Wave5 and Wave2 > Wave4 to be contracting diagonal. Wave1 < Wave3 < Wave5 and Wave2 < Wave4 to be expanding diagonal wave.
Pictorial representation of the Contracting Diagonal Wave is as below. Here, the Wave-1, Wave-3 and Wave-5 are in contracting formation.
Pictorial representation of the Expanding Diagonal Wave is as below. Here, the Wave-1, Wave-3 and Wave-5 are in expanding formation.
🎲 Indicator Settings
Indicator settings are defined as below:
Repaint Warning : If Repaint is selected, the indicator will throw a runtime error after certain bars or when alerts are set. This is due to some pine internal issue. At present, we do not have any solution for this until the internal issue is resolved by Tradingview Pine Team.
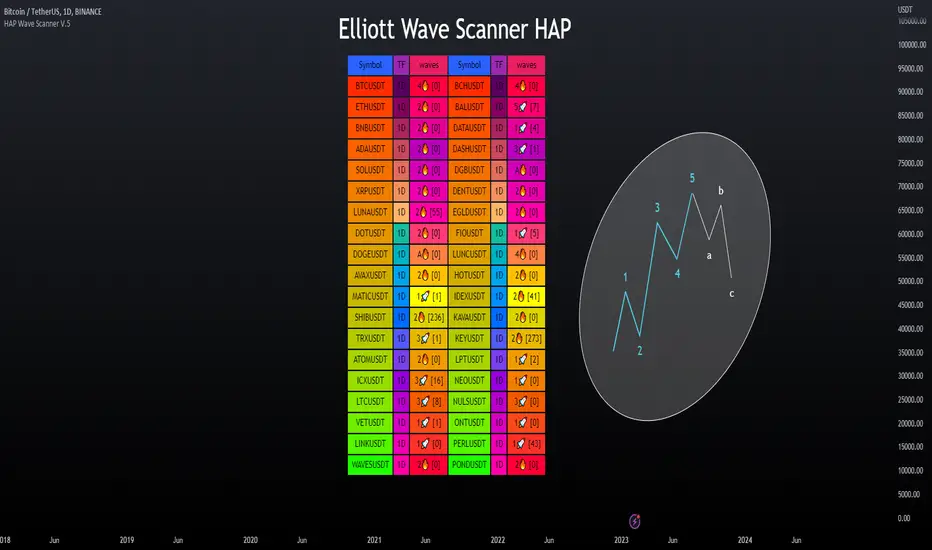
Elliott Wave Scanner - HAP [PRO] ▶Elliott Wave Scanner
This is an added feature of the wave drawing version, but this version is used for scanning multiple currency pairs simultaneously, based on the custom list you have specified as your preferred ones, making it more convenient for you.
This :
════════════════════════
This will be an adjustment of the number bars to be similar to the version in the drawing wave, with the only difference being that this version will be a scan of multiple waveforms simultaneously, including the input data format. It is recommended to only change the numbers, maintaining the original structure to avoid any errors, as demonstrated in the example below.
This is a valid example.👇
Wave0= (21),
Wave1= (13),
Wave2= (8),
Wave3= (21),
Wave4= (13),
Wave5= (34),
WaveA= (13),
WaveB= (8),
WaveC= (21)
**Kindly note to specify the numerical sequence of each wave. Parentheses should always be preceded by a comma and conclude on the final line without one.
════════════════════════
▶Let's take a look at the different parts of the scanned version.
════════════════════════
🎯 Bringing in the RSI to help make decisions, as referenced in the book by "Jason Perl".
if the market is advancing as part of a bullish HAP WAVE up sequence, then the RSI should remain above `40` during corrective setbacks for HAP WAVEs 2 and 4. Similarly, if the market is declining as part of a bearish HAP WAVE down sequence, then the RSI should remain beneath 60 during corrective for HAP WAVEs 2 and 4
For example, an uptrend in Wave tends to cause an RSI divergence between Wave 5 and Wave 3. When Wave 5 exceeds Wave 3, the RSI is often seen at Wave 5, which is lower than Wave 3.