Phase Cross Strategy with Zone### Introduction to the Strategy
Welcome to the **Phase Cross Strategy with Zone and EMA Analysis**. This strategy is designed to help traders identify potential buy and sell opportunities based on the crossover of smoothed oscillators (referred to as "phases") and exponential moving averages (EMAs). By combining these two methods, the strategy offers a versatile tool for both trend-following and short-term trading setups.
### Key Features
1. **Phase Cross Signals**:
- The strategy uses two smoothed oscillators:
- **Leading Phase**: A simple moving average (SMA) with an upward offset.
- **Lagging Phase**: An exponential moving average (EMA) with a downward offset.
- Buy and sell signals are generated when these phases cross over or under each other, visually represented on the chart with green (buy) and red (sell) labels.
2. **Phase Zone Visualization**:
- The area between the two phases is filled with a green or red zone, indicating bullish or bearish conditions:
- Green zone: Leading phase is above the lagging phase (potential uptrend).
- Red zone: Leading phase is below the lagging phase (potential downtrend).
3. **EMA Analysis**:
- Includes five commonly used EMAs (13, 26, 50, 100, and 200) for additional trend analysis.
- Crossovers of the EMA 13 and EMA 26 act as secondary buy/sell signals to confirm or enhance the phase-based signals.
4. **Customizable Parameters**:
- You can adjust the smoothing length, source (price data), and offset to fine-tune the strategy for your preferred trading style.
### What to Pay Attention To
1. **Phases and Zones**:
- Use the green/red phase zone as an overall trend guide.
- Avoid taking trades when the phases are too close or choppy, as it may indicate a ranging market.
2. **EMA Trends**:
- Align your trades with the longer-term trend shown by the EMAs. For example:
- In an uptrend (price above EMA 50 or EMA 200), prioritize buy signals.
- In a downtrend (price below EMA 50 or EMA 200), prioritize sell signals.
3. **Signal Confirmation**:
- Consider combining phase cross signals with EMA crossovers for higher-confidence trades.
- Look for confluence between the phase signals and EMA trends.
4. **Risk Management**:
- Always set stop-loss and take-profit levels to manage risk.
- Use the phase and EMA zones to estimate potential support/resistance areas for exits.
5. **Whipsaws and False Signals**:
- Be cautious in low-volatility or sideways markets, as the strategy may generate false signals.
- Use additional indicators or filters to avoid entering trades during unclear market conditions.
### How to Use
1. Add the strategy to your chart in TradingView.
2. Adjust the input settings (e.g., smoothing length, offsets) to suit your trading preferences.
3. Enable the strategy tester to evaluate its performance on historical data.
4. Combine the signals with your own analysis and risk management plan for best results.
This strategy is a versatile tool, but like any trading method, it requires proper understanding and discretion. Always backtest thoroughly and trade with discipline. Let me know if you need further assistance or adjustments to the strategy!
Cari dalam skrip untuk "zone"

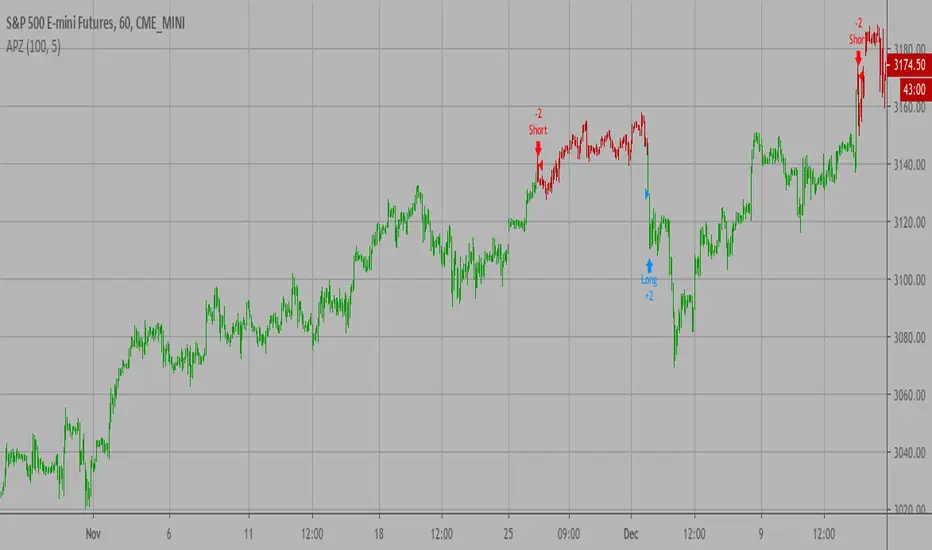
Adaptive Price Zone Backtest The adaptive price zone (APZ) is a volatility-based technical indicator that helps investors
identify possible market turning points, which can be especially useful in a sideways-moving
market. It was created by technical analyst Lee Leibfarth in the article “Identify the
Turning Point: Trading With An Adaptive Price Zone,” which appeared in the September 2006 issue
of the journal Technical Analysis of Stocks and Commodities.
This indicator attempts to signal significant price movements by using a set of bands based on
short-term, double-smoothed exponential moving averages that lag only slightly behind price changes.
It can help short-term investors and day traders profit in volatile markets by signaling price
reversal points, which can indicate potentially lucrative times to buy or sell. The APZ can be
implemented as part of an automated trading system and can be applied to the charts of all tradeable assets.
WARNING:
- For purpose educate only
- This script to change bars colors.
Supply/Demand Zones + Engulfment-based ExecutionSupply/Demand Zones + Engulfment-Based Execution
Strategy Overview
This strategy combines institutional trading concepts—supply/demand zones and engulfing candle patterns—to generate high-probability long and short trade setups. The system uses aggregated price action to identify potential reversal zones and confirms entries with engulfing candle patterns, ensuring trades are only taken when market structure shows commitment in the direction of the trade.
Core Concepts
• Supply & Demand Zones: These are automatically detected by analyzing aggregated bullish and bearish candle structures over user-defined intervals. Supply zones are formed after bearish continuation patterns; demand zones appear after bullish continuation patterns.
• Engulfing Entries: Once price enters a zone, the strategy waits for a bullish engulfing pattern (in a demand zone) or a bearish engulfing pattern (in a supply zone) before executing a trade. This adds confirmation and reduces false signals.
• Risk Management: Stop-loss is placed at the low (for long trades) or high (for short trades) of the engulfed candle. Take-profit can be calculated using a fixed R-multiple (risk-to-reward ratio) or a user-defined target price.
Key Features
Fully customizable aggregation factor for zone detection
Visual zone boxes, entry/SL/TP boxes, and engulfing pattern labels
Optional removal of mitigated zones for cleaner charting
Configurable trade mode (Long only, Short only, or Both)
Support for trading sessions and date filtering
Alerts for price entering supply or demand zones
How to Use
Select Aggregation Factor: Choose how many candles to group together for identifying key zones (e.g., 4x timeframe).
Enable Zones: Turn on supply and/or demand zones as needed.
Set Execution Parameters:
– Choose R-multiple (e.g., 2:1 risk-reward)
– Or use a fixed take-profit price
Define Trade Time Window:
– Set the date and time ranges to restrict execution
– Use Start Hour and End Hour to limit trades to specific sessions (e.g., London/New York)
Run on Desired Timeframe: Typically used on 15m–4H charts, depending on your strategy and the asset’s volatility.
Ideal For
• Traders using Smart Money Concepts (SMC)
• Those who value high-confluence entries
• Intraday to swing traders looking for structure-based automation
⚠️ Important Notes
• The strategy requires engulfing confirmation within the zone to enter a position.
• This script does not repaint and executes trades on a bar close basis.
• Backtest results may vary based on session filters and aggregation factor.
© Attribution
This strategy was developed by The_Forex_Steward and is licensed under the Mozilla Public License 2.0.
You are free to use, modify, and distribute it under the terms of that license.

Dual Fibonacci Zone & Ranged Vol DCA Strategy - R3c0nTraderWhat does this do?
This is for educational purposes and allows one to backtest two Fibonacci Zones simultaneously. This also includes an option for Ranged Volume as a parameter.
Pre-requisites:
First off, this is a Long only strategy as I wrote it with DCA in mind. It cannot be used for shorting. Shorting defeats the purpose of a DCA bot which has a goal that is Long a position not Short a position. If you want to short, there are plenty of free scripts out there that do this.
You must have some base knowledge or experience with Fibonacci trading, understanding what is ADX, +DI (and -DI), etc.
You can use this script without a 3Commas account and see how 3Commas DCA Bot would perform. However, I highly recommend inexperienced uses get a free account and going through the tutorials, FAQ's and knowledgebase. This would give you a base understanding of the settings you will see in this strategy and why you will need to know them. Only then should you try testing this strategy with a paper bot.
Background
After I had created and released "Fibonacci Zone DCA Strategy", I began expanding and testing other ideas.
The first idea was to add Ranged Volume to the Fibonacci Zone DCA strategy which I wanted for providing further confirmation before entering a trade. The second idea was to add a second Fibonacci Zone that was just as configurable as the first Fibonacci Zone. I managed to add both and they can be easily enabled or disabled via the strategy settings menu.
Things Got Real Interesting
Things got real interesting when I started testing strategies with two Fibonacci zones. Here's a quick list of what I found I was able to do:
Mix and match exit strategies. I could set the Fib-1 zone strategy to exit with a take profit % and separately set the Fib-2 zone strategy to exit when the price crosses the top-high fib border
Trade the trend. A common phrase amongst traders is "the Trend is your friend" and with the help of an additional Fib Zone, I was able to trade the trend more often by using two different Fib Zone strategies which if configured properly can shorten time to re-deploy capital, increase number of closed trades, and in some cases increase net profit.
Trade both bull market uptrends and bear market downtrends in the same strategy. I found I could configure one Fib Zone strategy to be really good in uptrends and another Fib Zone strategy to be really good in downtrends. In some cases, with both Fib Zone strategies enabled together in a single strategy I got better results than if the strategies were backtested separately.
There are many other trade strategies I am finding with this. One could be to trade a convergence or divergence of the two different Fib Zones. This could possibly be achieved by setting one strategy to have different Fibonacci length.
Credits:
Thank you "EvoCrypto" for granting me permission to use "Ranged Volume" to create this strategy
Thank you "eykpunter" for granting me permission to use "Fibonacci Zones" to create this strategy
Thank you "junyou0424" for granting me permission to use "DCA Bot with SuperTrend Emulator" which I used for adding bot inputs, calculations, and strategy

AO/AC Trading Zones Strategy [Skyrexio] Overview
AO/AC Trading Zones Strategy leverages the combination of Awesome Oscillator (AO), Acceleration/Deceleration Indicator (AC), Williams Fractals, Williams Alligator and Exponential Moving Average (EMA) to obtain the high probability long setups. Moreover, strategy uses multi trades system, adding funds to long position if it considered that current trend has likely became stronger. Combination of AO and AC is used for creating so-called trading zones to create the signals, while Alligator and Fractal are used in conjunction as an approximation of short-term trend to filter them. At the same time EMA (default EMA's period = 100) is used as high probability long-term trend filter to open long trades only if it considers current price action as an uptrend. More information in "Methodology" and "Justification of Methodology" paragraphs. The strategy opens only long trades.
Unique Features
No fixed stop-loss and take profit: Instead of fixed stop-loss level strategy utilizes technical condition obtained by Fractals and Alligator to identify when current uptrend is likely to be over. In some special cases strategy uses AO and AC combination to trail profit (more information in "Methodology" and "Justification of Methodology" paragraphs)
Configurable Trading Periods: Users can tailor the strategy to specific market windows, adapting to different market conditions.
Multilayer trades opening system: strategy uses only 10% of capital in every trade and open up to 5 trades at the same time if script consider current trend as strong one.
Short and long term trend trade filters: strategy uses EMA as high probability long-term trend filter and Alligator and Fractal combination as a short-term one.
Methodology
The strategy opens long trade when the following price met the conditions:
1. Price closed above EMA (by default, period = 100). Crossover is not obligatory.
2. Combination of Alligator and Williams Fractals shall consider current trend as an upward (all details in "Justification of Methodology" paragraph)
3. Both AC and AO shall print two consecutive increasing values. At the price candle close which corresponds to this condition algorithm opens the first long trade with 10% of capital.
4. If combination of Alligator and Williams Fractals shall consider current trend has been changed from up to downtrend, all long trades will be closed, no matter how many trades has been opened.
5. If AO and AC both continue printing the rising values strategy opens the long trade on each candle close with 10% of capital while number of opened trades reaches 5.
6. If AO and AC both has printed 5 rising values in a row algorithm close all trades if candle's low below the low of the 5-th candle with rising AO and AC values in a row.
Script also has additional visuals. If second long trade has been opened simultaneously the Alligator's teeth line is plotted with the green color. Also for every trade in a row from 2 to 5 the label "Buy More" is also plotted just below the teeth line. With every next simultaneously opened trade the green color of the space between teeth and price became less transparent.
Strategy settings
In the inputs window user can setup strategy setting:
EMA Length (by default = 100, period of EMA, used for long-term trend filtering EMA calculation).
User can choose the optimal parameters during backtesting on certain price chart.
Justification of Methodology
Let's explore the key concepts of this strategy and understand how they work together. We'll begin with the simplest: the EMA.
The Exponential Moving Average (EMA) is a type of moving average that assigns greater weight to recent price data, making it more responsive to current market changes compared to the Simple Moving Average (SMA). This tool is widely used in technical analysis to identify trends and generate buy or sell signals. The EMA is calculated as follows:
1.Calculate the Smoothing Multiplier:
Multiplier = 2 / (n + 1), Where n is the number of periods.
2. EMA Calculation
EMA = (Current Price) × Multiplier + (Previous EMA) × (1 − Multiplier)
In this strategy, the EMA acts as a long-term trend filter. For instance, long trades are considered only when the price closes above the EMA (default: 100-period). This increases the likelihood of entering trades aligned with the prevailing trend.
Next, let’s discuss the short-term trend filter, which combines the Williams Alligator and Williams Fractals. Williams Alligator
Developed by Bill Williams, the Alligator is a technical indicator that identifies trends and potential market reversals. It consists of three smoothed moving averages:
Jaw (Blue Line): The slowest of the three, based on a 13-period smoothed moving average shifted 8 bars ahead.
Teeth (Red Line): The medium-speed line, derived from an 8-period smoothed moving average shifted 5 bars forward.
Lips (Green Line): The fastest line, calculated using a 5-period smoothed moving average shifted 3 bars forward.
When the lines diverge and align in order, the "Alligator" is "awake," signaling a strong trend. When the lines overlap or intertwine, the "Alligator" is "asleep," indicating a range-bound or sideways market. This indicator helps traders determine when to enter or avoid trades.
Fractals, another tool by Bill Williams, help identify potential reversal points on a price chart. A fractal forms over at least five consecutive bars, with the middle bar showing either:
Up Fractal: Occurs when the middle bar has a higher high than the two preceding and two following bars, suggesting a potential downward reversal.
Down Fractal: Happens when the middle bar shows a lower low than the surrounding two bars, hinting at a possible upward reversal.
Traders often use fractals alongside other indicators to confirm trends or reversals, enhancing decision-making accuracy.
How do these tools work together in this strategy? Let’s consider an example of an uptrend.
When the price breaks above an up fractal, it signals a potential bullish trend. This occurs because the up fractal represents a shift in market behavior, where a temporary high was formed due to selling pressure. If the price revisits this level and breaks through, it suggests the market sentiment has turned bullish.
The breakout must occur above the Alligator’s teeth line to confirm the trend. A breakout below the teeth is considered invalid, and the downtrend might still persist. Conversely, in a downtrend, the same logic applies with down fractals.
In this strategy if the most recent up fractal breakout occurs above the Alligator's teeth and follows the last down fractal breakout below the teeth, the algorithm identifies an uptrend. Long trades can be opened during this phase if a signal aligns. If the price breaks a down fractal below the teeth line during an uptrend, the strategy assumes the uptrend has ended and closes all open long trades.
By combining the EMA as a long-term trend filter with the Alligator and fractals as short-term filters, this approach increases the likelihood of opening profitable trades while staying aligned with market dynamics.
Now let's talk about the trading zones concept and its signals. To understand this we need to briefly introduce what is AO and AC. The Awesome Oscillator (AO), developed by Bill Williams, is a momentum indicator designed to measure market momentum by contrasting recent price movements with a longer-term historical perspective. It helps traders detect potential trend reversals and assess the strength of ongoing trends.
The formula for AO is as follows:
AO = SMA5(Median Price) − SMA34(Median Price)
where:
Median Price = (High + Low) / 2
SMA5 = 5-period Simple Moving Average of the Median Price
SMA 34 = 34-period Simple Moving Average of the Median Price
The Acceleration/Deceleration (AC) Indicator, introduced by Bill Williams, measures the rate of change in market momentum. It highlights shifts in the driving force of price movements and helps traders spot early signs of trend changes. The AC Indicator is particularly useful for identifying whether the current momentum is accelerating or decelerating, which can indicate potential reversals or continuations. For AC calculation we shall use the AO calculated above is the following formula:
AC = AO − SMA5(AO) , where SMA5(AO)is the 5-period Simple Moving Average of the Awesome Oscillator
When the AC is above the zero line and rising, it suggests accelerating upward momentum.
When the AC is below the zero line and falling, it indicates accelerating downward momentum.
When the AC is below zero line and rising it suggests the decelerating the downtrend momentum. When AC is above the zero line and falling, it suggests the decelerating the uptrend momentum.
Now let's discuss the trading zones concept and how it can create the signal. Zones are created by the combination of AO and AC. We can divide three zone types:
Greed zone: when the AO and AC both are rising
Red zone: when the AO and AC both are decreasing
Gray zone: when one of AO or AC is rising, the other is falling
Gray zone is considered as uncertainty. AC and AO are moving in the opposite direction. Strategy skip such price action to decrease the chance to stuck in the losing trade during potential sideways. Red zone is also not interesting for the algorithm because both indicators consider the trend as bearish, but strategy opens only long trades. It is waiting for the green zone to increase the chance to open trade in the direction of the potential uptrend. When we have 2 candles in a row in the green zone script executes a long trade with 10% of capital.
Two green zone candles in a row is considered by algorithm as a bullish trend, but now so strong, that's the reason why trade is going to be closed when the combination of Alligator and Fractals will consider the the trend change from bullish to bearish. If id did not happens, algorithm starts to count the green zone candles in a row. When we have 5 in a row script change the trade closing condition. Such situation is considered is a high probability strong bull market and all trades will be closed if candle's low will be lower than fifth green zone candle's low. This is used to increase probability to secure the profit. If long trades are initiated, the strategy continues utilizing subsequent signals until the total number of trades reaches a maximum of 5. Each trade uses 10% of capital.
Why we use trading zones signals? If currently strategy algorithm considers the high probability of the short-term uptrend with the Alligator and Fractals combination pointed out above and the long-term trend is also suggested by the EMA filter as bullish. Rising AC and AO values in the direction of the most likely main trend signaling that we have the high probability of the fastest bullish phase on the market. The main idea is to take part in such rapid moves and add trades if this move continues its acceleration according to indicators.
Backtest Results
Operating window: Date range of backtests is 2023.01.01 - 2024.12.31. It is chosen to let the strategy to close all opened positions.
Commission and Slippage: Includes a standard Binance commission of 0.1% and accounts for possible slippage over 5 ticks.
Initial capital: 10000 USDT
Percent of capital used in every trade: 10%
Maximum Single Position Loss: -9.49%
Maximum Single Profit: +24.33%
Net Profit: +4374.70 USDT (+43.75%)
Total Trades: 278 (39.57% win rate)
Profit Factor: 2.203
Maximum Accumulated Loss: 668.16 USDT (-5.43%)
Average Profit per Trade: 15.74 USDT (+1.37%)
Average Trade Duration: 60 hours
How to Use
Add the script to favorites for easy access.
Apply to the desired timeframe and chart (optimal performance observed on 4h BTC/USDT).
Configure settings using the dropdown choice list in the built-in menu.
Set up alerts to automate strategy positions through web hook with the text: {{strategy.order.alert_message}}
Disclaimer:
Educational and informational tool reflecting Skyrex commitment to informed trading. Past performance does not guarantee future results. Test strategies in a simulated environment before live implementation
These results are obtained with realistic parameters representing trading conditions observed at major exchanges such as Binance and with realistic trading portfolio usage parameters.

GQT GPT - Volume-based Support & Resistance Zones V2搞钱兔,搞钱是为了更好的生活。
Title: GQT GPT - Volume-based Support & Resistance Zones V2
Overview:
This strategy is implemented in PineScript v5 and is designed to identify key support and resistance zones based on volume-driven fractal analysis on a 1-hour timeframe. It computes fractal high points (for resistance) and fractal low points (for support) using volume moving averages and specific price action criteria. These zones are visually represented on the chart with customizable lines and zone fills.
Trading Logic:
• Entry: The strategy initiates a long position when the price crosses into the support zone (i.e., when the price drops into a predetermined support area).
• Exit: The long position is closed when the price enters the resistance zone (i.e., when the price rises into a predetermined resistance area).
• Time Frame: Trading signals are generated solely from the 1-hour chart. The strategy is only active within a specified start and end date.
• Note: Only long trades are executed; short selling is not part of the strategy.
Visualization and Parameters:
• Support/Resistance Zones: The zones are drawn based on calculated fractal values, with options to extend the lines to the right for easier tracking.
• Customization: Users can configure the appearance, such as line style (solid, dotted, dashed), line width, colors, and label positions.
• Volume Filtering: A volume moving average threshold is used to confirm the fractal signals, enhancing the reliability of the support and resistance levels.
• Alerts: The strategy includes alert conditions for when the price enters the support or resistance zones, allowing for timely notifications.
⸻
搞钱兔,搞钱是为了更好的生活。
标题: GQT GPT - 基于成交量的支撑与阻力区间 V2
概述:
本策略使用 PineScript v5 实现,旨在基于成交量驱动的分形分析,在1小时级别的图表上识别关键支撑与阻力区间。策略通过成交量移动平均线和特定的价格行为标准计算分形高点(阻力)和分形低点(支撑),并以自定义的线条和区间填充形式直观地显示在图表上。
交易逻辑:
• 进场条件: 当价格进入支撑区间(即价格跌入预设支撑区域)时,策略在没有持仓的情况下发出做多信号。
• 离场条件: 当价格进入阻力区间(即价格上升至预设阻力区域)时,持有多头头寸则会被平仓。
• 时间范围: 策略的信号仅基于1小时级别的图表,并且仅在指定的开始日期与结束日期之间生效。
• 备注: 本策略仅执行多头交易,不进行空头操作。
可视化与参数设置:
• 支撑/阻力区间: 根据计算得出的分形值绘制支撑与阻力线,可选择将线条延伸至右侧,便于后续观察。
• 自定义选项: 用户可以调整线条样式(实线、点线、虚线)、线宽、颜色及标签位置,以满足个性化需求。
• 成交量过滤: 策略使用成交量移动平均阈值来确认分形信号,提高支撑和阻力区间的有效性。
• 警报功能: 当价格进入支撑或阻力区间时,策略会触发警报条件,方便用户及时关注市场变化。
⸻

Mustang Algo - Momentum Trend Zone Backtest🐎 MUSTANG ALGO - Momentum Trend Zone Strategy
A complete trading system combining MACD momentum analysis with visual trend zones, full backtesting capabilities, and advanced risk management tools.
══════════════════════════════════════════════════════════════════════════
🔹 OVERVIEW
Mustang Algo transforms traditional MACD analysis into a powerful visual trading system. It instantly identifies market bias through colored background zones and provides clear entry/exit signals with customizable stop loss and take profit management.
══════════════════════════════════════════════════════════════════════════
🔹 KEY FEATURES
✅ Visual Trend Zones (Green = Bullish | Red = Bearish)
✅ Clear Buy/Sell Triangles on Chart
✅ Full Backtesting Engine
✅ Multiple Stop Loss Types
✅ Multiple Take Profit Types
✅ Trailing Stop Option
✅ Time Filter for Backtesting
✅ Real-time Info Panel
✅ Customizable Alerts
══════════════════════════════════════════════════════════════════════════
🔹 HOW IT WORKS
The strategy uses a smoothed MACD system to detect trend changes:
- MACD Line (White): Fast EMA minus Slow EMA - shows raw momentum
- Signal Line (Yellow): EMA of MACD - shows smoothed trend direction
- Trend Zone: Changes when the smoothed signal line crosses zero
- Entry Signals: Generated at zone transitions
When the trend line crosses above zero → GREEN zone → BUY signal 🔺
When the trend line crosses below zero → RED zone → SELL signal 🔻
══════════════════════════════════════════════════════════════════════════
🔹 STOP LOSS OPTIONS
🛑 Percentage: Fixed percentage from entry price
🛑 ATR-Based: Dynamic SL based on market volatility
🛑 Fixed Points: Set number of points/pips
🛑 Swing Low/High: Uses recent swing levels as stops
══════════════════════════════════════════════════════════════════════════
🔹 TAKE PROFIT OPTIONS
🎯 Percentage: Fixed percentage target
🎯 ATR-Based: Dynamic TP based on volatility
🎯 Fixed Points: Set number of points/pips
🎯 Risk Reward: Automatic TP based on R:R ratio (e.g., 2:1, 3:1)
══════════════════════════════════════════════════════════════════════════
🔹 TRAILING STOP
📈 Percentage-Based: Trail by a fixed percentage
📈 ATR-Based: Trail using ATR multiplier for dynamic adjustment
══════════════════════════════════════════════════════════════════════════
🔹 SETTINGS
MACD Parameters:
- Fast Length (default: 12)
- Slow Length (default: 26)
- Signal Length (default: 9)
- Trend Smoothing (default: 5)
Risk Management:
- Enable/Disable Stop Loss
- Enable/Disable Take Profit
- Enable/Disable Trailing Stop
- Customize all SL/TP parameters
Visual Options:
- Show/Hide Buy/Sell Triangles
- Show/Hide SL/TP Lines
- Show/Hide Labels
Time Filter:
- Set Start Date for backtest
- Set End Date for backtest
══════════════════════════════════════════════════════════════════════════
🔹 SIGNALS EXPLAINED
🟢 GREEN TRIANGLE (Below Bar):
Bullish zone detected - Consider LONG entry
🔴 RED TRIANGLE (Above Bar):
Bearish zone detected - Consider SHORT entry
🟢 GREEN BACKGROUND:
Currently in bullish trend zone
🔴 RED BACKGROUND:
Currently in bearish trend zone
══════════════════════════════════════════════════════════════════════════
🔹 INFO PANEL
The real-time info panel (top right) displays:
- Current Trend Zone status
- MACD value
- Signal Line value
- Active SL Type
- Active TP Type
══════════════════════════════════════════════════════════════════════════
🔹 ALERTS
Set up alerts for:
🔔 Buy Signals: "🐎 Mustang Algo: BUY Signal on {ticker} at {price}"
🔔 Sell Signals: "🐎 Mustang Algo: SELL Signal on {ticker} at {price}"
══════════════════════════════════════════════════════════════════════════
🔹 BEST PRACTICES
1. Use higher timeframes (1H, 4H, Daily) for more reliable signals
2. Combine with price action and support/resistance levels
3. Adjust ATR multipliers based on asset volatility
4. Use Risk Reward ratio for consistent risk management
5. Backtest on your preferred asset before live trading
══════════════════════════════════════════════════════════════════════════
🔹 RECOMMENDED TIMEFRAMES
⏱️ Scalping: 5M, 15M (more signals, more noise)
⏱️ Day Trading: 1H, 4H (balanced signals)
⏱️ Swing Trading: Daily, Weekly (fewer but stronger signals)
══════════════════════════════════════════════════════════════════════════
🔹 MARKETS
Works on all markets:
📈 Forex
📈 Crypto
📈 Stocks
📈 Indices
📈 Commodities
📈 Futures
══════════════════════════════════════════════════════════════════════════
🐎 RIDE THE TREND WITH MUSTANG ALGO!
══════════════════════════════════════════════════════════════════════════
⚠️ DISCLAIMER
This indicator/strategy is for educational and informational purposes only. It is not financial advice. Trading involves substantial risk of loss and is not suitable for all investors. Past performance is not indicative of future results. Always use proper risk management, do your own research, and consider consulting a financial advisor before making any trading decisions. Use at your own risk.
══════════════════════════════════════════════════════════════════════════
📝 VERSION HISTORY
v1.0 - Initial Release
- MACD-based trend detection
- Visual trend zones
- Multiple SL/TP options
- Full backtesting support
- Trailing stop functionality
- Time filter
- Info panel
- Alert system
══════════════════════════════════════════════════════════════════════════
💬 FEEDBACK
If you find this strategy useful, please leave a comment or suggestion!
Your feedback helps improve future updates.
🐎 Happy Trading!

Fibonacci Zone DCA Strategy - R3c0nTraderCredits:
Thank you "eykpunter" for granting me permission to use "Fibonacci Zones" to create this strategy
Thank you "junyou0424" for granting me permission to use "DCA Bot with SuperTrend Emulator" which I used for adding bot inputs, calculations, and strategy
Pre-requisites:
You can use this script without a 3Commas account and see how 3Commas DCA Bot would perform. However, I highly recommend signing up for their free account, going through their training, and testing this strategy with a paper bot. This would give you a base understanding of the settings you will see in this strategy and why you will need to know them.
What can this do?
First off, this is a Long only strategy as I wrote it with DCA in mind. It cannot be used for shorting. Shorting defeats the purpose of a DCA bot which has a goal that is Long a position not Short a position. If you want to short, there are plenty of free scripts out there that do this.
I created this script out of curiosity and I wanted to see how a strategy based on “Fibonacci” levels would work with a 3Commas DCA bot. I came across "eykpunter’s" "Fibonacci Zones" study and in TradingView and I found it to be a very interesting concept. The "Fib Zones" in his study are basically a "Donchian Channel" of 4 Fibonacci lines. These are the High @ 0.236, Center High @ 0.382, Center Low @ 0.618, and Low @ 0.764.
The Fib Zones in this strategy can be used as conditions to open a trade as well as closing a trade. There is also the option to close a trade based on a Target Take Profit (%).
Advanced Fibonacci trading is also supported by specifying additional parameters for Trade Entry and Exit.
For example, for order entry, you can increase the minimum trend strength to open an order via the "minimum ADX value" option. You can also further limit order entry by selecting the option to "Only open trades on bullish +DI" (Positive Directional Index).
Or you can play the contrarian. For example, I would look for "buying the dip" opportunities by doing the following under "Trade Entry Settings":
Set the "Min ADX value to open trade" to zero
Set the option "Open a trade when the price moves" to "1-To the bottom of Downtrend Fib zone" or "2-Higher than the top of the Downtrend Fib zone"
Uncheck option "Only open trades on bullish +DI"
Set the 'Min ADX value to open trade' to Zero
Set the 'Max +DI value to open trade' to a value between 10-20.
For Trade Exit settings, I can use a "Target Take Profit (%)" or one of the High Fib levels to close the trade.
Here's an example result when using a Contrarian-Fibonacci-Zone-DCA strategy:
Explanation of Chart lines and colors on chart
Six Options for Entering a Fibonacci Trade
Open a trade when the price moves:
1-To the bottom of Downtrend Fib zone
2-Higher than the top of the Downtrend Fib zone
3-Higher than the bottom of Ranging Fib Zone
4-Higher than the top of Ranging Fib Zone
5-Higher than the bottom of Uptrend Fib Zone
6-To the top of Uptrend Fib Zone
Three Options for Exiting a Fibonacci Trade
Take profit using:
"Target Take Profit (%)"
"High Fibonacci Border-1"
"High Fibonacci Border-2"

TrendGuard Scalper: SSL + Hama Candle with Consolidation ZonesThis TradingView script brings a powerful scalping strategy that combines the SSL Channel and Hama Candles indicators with a special twist—consolidation detection. Designed for traders looking for consistency in various markets like crypto, forex, and stocks, this strategy highlights clear trend signals, risk management, and helps filter out risky trades during consolidation periods.
Why Use This Strategy?
Clear Trend Detection:
With the SSL Channel, you’ll know exactly when the market is in an uptrend (green) or downtrend (red), giving you straightforward entry points.
Short-Term Trend Precision with Hama Candles:
By calculating unique EMAs for open, high, low, and close, the Hama Candles show the strength and direction of short-term trends. Combined with the Hama Line, it gives you a solid confirmation on whether the trend is strong or about to reverse, allowing for precise entries and exits.
Avoiding Choppy Markets:
Thanks to ATR-based consolidation detection, this strategy identifies low-volatility periods where the market is “choppy” and less predictable. During these times, a yellow background appears on the chart, warning you to hold off on trades, reducing the likelihood of entering losing trades.
Built-In Risk Management:
With adjustable Take Profit and Stop Loss levels based on price movements, you can set and forget your trades, with a safety net if the market turns against you. The strategy automatically closes positions if the price returns to the Hama Candle, keeping your risk low.
How It Works:
Long Position: When both the SSL and Hama indicators show a green trend, and the price is above the Hama Candles, the strategy opens a long position. Take Profit triggers at your chosen risk-to-reward ratio, while Stop Loss protects you just below the Hama Line.
Short Position: When both indicators align in red and the price is below the Hama Candles, the strategy opens a short. Similar to longs, Stop Loss is set just above the Hama Line, and Take Profit is at your defined level.
Start Trading Confidently
Test this strategy with different settings and discover how it can perform across various assets. Whether you're trading Bitcoin, forex pairs, or stocks, this system has the flexibility and robustness to help you spot profitable trends and avoid risky zones. Try it today on a 30-minute timeframe to see how it aligns with your trading goals, and let the consolidation detection guide you away from false signals.
Happy trading, and may the trends be with you! 📈

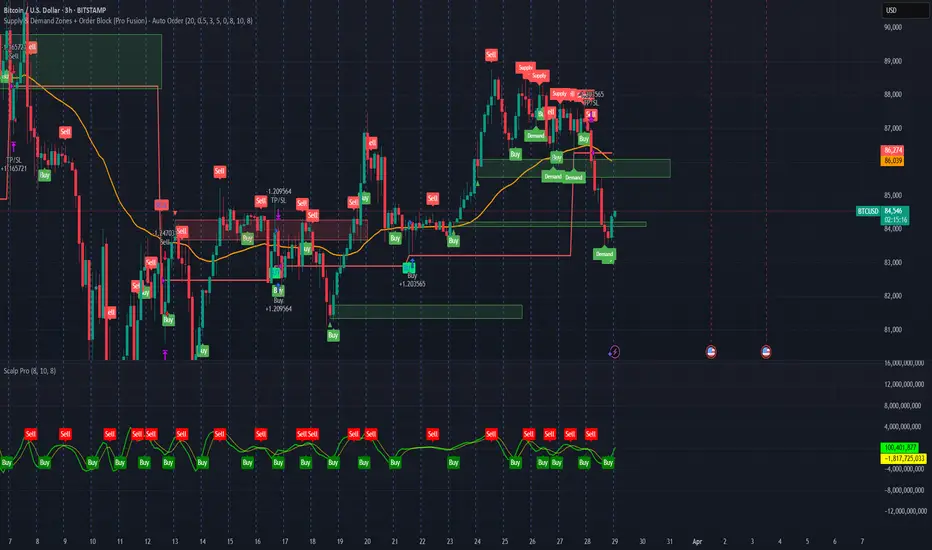
Supply & Demand Zones + Order Block (Pro Fusion) - Auto Order Strategy Title:
Smart Supply & Demand Zones + Order Block Auto Strategy with ScalpPro (Buy-Focused)
📄 Strategy Description:
This strategy combines the power of Supply & Demand Zone analysis, Order Block detection, and an enhanced Scalp Pro momentum filter, specifically designed for automated decision-making based on high-volume breakouts.
✅ Key Features:
Auto Entry (Buy Only) Based on Breakouts
Automatically enters a Buy position when the price breaks out of a valid demand zone, confirmed by EMA 50 trend and volume spike.
Order Block Logic
Identifies bullish and bearish order blocks using consecutive candle structures and significant price movement.
Dynamic Stop Loss & Trailing Stop
Implements a trailing stop once price moves in profit, along with static initial stop loss for risk management.
Clear Visual Labels & Alerts
Displays BUY/SELL, Demand/Supply, and Order Block labels directly on the chart. Alerts trigger on valid breakout signals.
Scalp Pro Momentum Filter (Optimized)
Uses a modified MACD-style momentum indicator to confirm trend strength and filter out weak signals.
ICT NY Kill Zone Auto Trading### **ICT NY Kill Zone Auto Trading Strategy (5-Min Chart)**
#### **Overview:**
This strategy is based on Inner Circle Trader (ICT) concepts, focusing on the **New York Kill Zone**. It is designed for trading GBP/USD exclusively on the **5-minute chart**, automatically entering and exiting trades during the US session.
#### **Key Components:**
1. **Time Filter**
- The strategy only operates during the **New York Kill Zone (9:30 AM - 11:00 AM NY Time)**.
- It ensures execution only on the **5-minute timeframe**.
2. **Fair Value Gaps (FVGs) Detection**
- The script identifies areas where price action left an imbalance, known as Fair Value Gaps (FVGs).
- These gaps indicate potential liquidity zones where price may return before continuing in the original direction.
3. **Order Blocks (OBs) Identification**
- **Bullish Order Block:** Occurs when price forms a strong bullish pattern, suggesting further upside movement.
- **Bearish Order Block:** Identified when a strong bearish formation signals potential downside continuation.
4. **Trade Execution**
- **Long Trade:** Entered when a bullish order block forms within the NY Kill Zone and aligns with an FVG.
- **Short Trade:** Entered when a bearish order block forms within the Kill Zone and aligns with an FVG.
5. **Risk Management**
- **Stop Loss:** Fixed at **30 pips** to limit downside risk.
- **Take Profit:** Set at **60 pips**, providing a **2:1 risk-reward ratio**.
6. **Visual Aids**
- The **Kill Zone is highlighted in blue** to help traders visually confirm the active session.
**Objective:**
This script aims to **capitalize on institutional price movements** within the New York session by leveraging ICT concepts such as FVGs and Order Blocks. By automating trade entries and exits, it eliminates emotions and ensures a disciplined trading approach.

Session Volume Profile Sniffer: HVN & Rejection ZonesA simple tool built for traders who rely on intraday volume structure.
What this script does
This script tracks volume distribution inside a selected session and highlights two key price levels:
High Volume Nodes (HVNs) — areas where price spent time building heavy participation.
Low Volume Nodes (LVNs) — thin zones where price moved quickly with very little interest.
Instead of plotting a full profile, this tool gives you the exact rejection-level lines you usually hunt manually.
Why these levels matter
HVN → price tends to react, stall, or flip direction
LVN → price often rejects strongly since liquidity is thin
Rejection patterns around these areas give clean entry signals
Positioning trades around HVN/LVN helps filter noise in choppy sessions
This script removes the trouble of drawing profiles, counting bins, or guessing node levels. Everything is calculated inside the session you choose.
How the detection works
Inside your session window, the script:
1. Tracks each tick-based price bucket
2. Accumulates raw volume for every bucket
Identifies:
HVNs = buckets with volume above a tier
LVNs = buckets with volume below a tier
3. Prints each level as a single clean line
4. Generates:
Long signal → bounce from LVN
Short signal → rejection from HVN
Built-in exits use ATR-based conditions for quick testing.
Features
Session-based volume mapping
HVN + LVN levels drawn automatically
Entry triggers based on rejection
ATR exits for experimental backtests
Clean, minimal visual output
Best use cases
Intraday futures
Index scalping
FX sessions (London / NY)
Crypto sessions (user-timed)
Anyone who trades around volume structure
Adjustable settings
Session window
Volume bin size
HVN multiplier
LVN multiplier
Enable/disable zone lines
This keeps it flexible enough for both scalpers and slow-paced intraday setups.
Important note
This script is built for study + idea testing.
It is not intended as a final system.
Once you identify how price behaves around these nodes, you can blend this tool into your own setup.

CCI Level ZoneThis strategy uses CCI 1000 as zones Buy sell if greater than level 100. will be seen as an uptrend If it's lower, it's a downtrend.
So we will use RSI. To trade in its zones, using the RSI crosses the level line, and when the RSI crosses the level line, it waits to buy with Stochastic.

MA Crossover with Demand/Supply Zones + Stop Loss/Take ProfitStop Loss and Take Profit Inputs:
Added stopLossPerc and takeProfitPerc as inputs to allow the user to define the stop loss and take profit levels as a percentage of the entry price.
Stop Loss and Take Profit Calculation:
For long positions, the stop loss is calculated as strategy.position_avg_price * (1 - stopLossPerc), and the take profit is calculated as strategy.position_avg_price * (1 + takeProfitPerc).
For short positions, the stop loss is calculated as strategy.position_avg_price * (1 + stopLossPerc), and the take profit is calculated as strategy.position_avg_price * (1 - takeProfitPerc).
Exit Strategy:
Added strategy.exit to define the stop loss and take profit levels for each trade. The from_entry parameter ensures that the exit is tied to the specific entry order.
Flexibility:
The stop loss and take profit levels are dynamic and adjust based on the entry price of the trade.
How It Works:
When a buy signal is generated (MA crossover near a demand zone), the strategy enters a long position and sets a stop loss and take profit level based on the input percentages.
When a sell signal is generated (MA crossunder near a supply zone), the strategy enters a short position and sets a stop loss and take profit level based on the input percentages.
The trade will exit automatically if either the stop loss or take profit level is hit.
Example:
If the entry price for a long position is $100, and the stop loss is set to 1% while the take profit is set to 2%:
Stop loss level =
100
∗
(
1
−
0.01
)
=
100∗(1−0.01)=99
Take profit level =
100
∗
(
1
+
0.02
)
=
100∗(1+0.02)=102
Notes:
You can adjust the stopLossPerc and takeProfitPerc inputs to suit your risk management preferences.
Always backtest the strategy to ensure the stop loss and take profit levels are appropriate for your trading instrument and timeframe.

Noro's Transient Zones Strategy v1.0Uses:
- Transient Zones
- color of a candle as a filter
- body of a candle as a filter

MFI Strategy with Oversold Zone Exit and AveragingThis strategy is based on the Money Flow Index (MFI) and aims to enter a long position when the MFI exits an oversold zone, with specific rules for limit orders, stop-loss, and take-profit settings. Here's a detailed breakdown:
Key Components
1. **Money Flow Index (MFI)**: The strategy uses the MFI, a volume-weighted indicator, to gauge whether the market is in an oversold condition (default threshold of MFI < 20). Once the MFI rises above the oversold threshold, it signals a potential buying opportunity.
2. **Limit Order for Long Entry**: Instead of entering immediately after the oversold condition is cleared, the strategy places a limit order at a price slightly below the current price (by a user-defined percentage). This helps achieve a better entry price.
3. **Stop-Loss and Take-Profit**:
- **Stop-Loss**: A stop-loss is set to protect against significant losses, calculated as a percentage below the entry price.
- **Take-Profit**: A take-profit target is set as a percentage above the entry price to lock in gains.
4. **Order Cancellation**: If the limit order isn’t filled within a specific number of bars (default is 5 bars), it’s automatically canceled to avoid being filled at a potentially suboptimal price as market conditions change.
Strategy Workflow
1. **Identify Oversold Zone**: The strategy checks if the MFI falls below a defined oversold level (default is 20). Once this condition is met, the flag `inOversoldZone` is set to `true`.
2. **Wait for Exit from Oversold Zone**: When the MFI rises back above the oversold level, it’s considered a signal that the market is potentially recovering, and the strategy prepares to enter a position.
3. **Place Limit Order**: Upon exiting the oversold zone, the strategy places a limit order for a long position at a price below the current price, defined by the `Long Entry Percentage` parameter.
4. **Monitor Limit Order**: A counter (`barsSinceEntryOrder`) starts counting the bars since the limit order was placed. If the order isn’t filled within the specified number of bars, it’s canceled automatically.
5. **Set Stop-Loss and Take-Profit**: Once the order is filled, a stop-loss and take-profit are set based on user-defined percentages relative to the entry price.
6. **Exit Strategy**: The trade will close automatically when either the stop-loss or take-profit level is hit.
Advantages
- **Risk Management**: With configurable stop-loss and take-profit, the strategy ensures losses are limited while capturing profits at pre-defined levels.
- **Controlled Entry**: The use of a limit order below the current price helps secure a better entry point, enhancing risk-reward.
- **Oversold Exit Trigger**: Using the exit from an oversold zone as an entry condition can help catch reversals.
Disadvantages
- **Missed Entries**: If the limit order isn’t filled due to insufficient downward movement after the oversold signal, potential opportunities may be missed.
- **Dependency on MFI Sensitivity**: As the MFI is sensitive to both price and volume, its fluctuations might not always accurately represent oversold conditions.
Overall Purpose
The strategy is suited for traders who want to capture potential reversals after oversold conditions in the market, with a focus on precise entries, risk management, and an automated exit plan.

Fine-tune Inputs: Gann + Laplace Smooth Volume Zone OscillatorUse this Strategy to Fine-tune inputs for the GannLSVZ0 Indicator.
Strategy allows you to fine-tune the indicator for 1 TimeFrame at a time; cross Timeframe Input fine-tuning is done manually after exporting the chart data.
I suggest using "Close all" input False when fine-tuning Inputs for 1 TimeFrame. When you export data to Excel/Numbers/GSheets I suggest using "Close all" input as True, except for the lowest TimeFrame.
MEANINGFUL DESCRIPTION:
The Volume Zone oscillator breaks up volume activity into positive and negative categories. It is positive when the current closing price is greater than the prior closing price and negative when it's lower than the prior closing price. The resulting curve plots through relative percentage levels that yield a series of buy and sell signals, depending on level and indicator direction.
The Gann Laplace Smoothed Volume Zone Oscillator GannLSVZO is a refined version of the Volume Zone Oscillator, enhanced by the implementation of the upgraded Discrete Fourier Transform, the Laplace Stieltjes Transform. Its primary function is to streamline price data and diminish market noise, thus offering a clearer and more precise reflection of price trends.
By combining the Laplace with Gann Swing Entries and with Ehler's white noise histogram, users gain a comprehensive perspective on volume-related market conditions.
HOW TO USE THE INDICATOR:
The default period is 2 but can be adjusted after backtesting. (I suggest 5 VZO length and NoiceR max length 8 as-well)
The VZO points to a positive trend when it is rising above the 0% level, and a negative trend when it is falling below the 0% level. 0% level can be adjusted in setting by adjusting VzoDifference. Oscillations rising below 0% level or falling above 0% level result in a natural trend.
HOW TO USE THE STRATEGY:
Here you fine-tune the inputs until you find a combination that works well on all Timeframes you will use when creating your Automated Trade Algorithmic Strategy. I suggest 4h, 12h, 1D, 2D, 3D, 4D, 5D, 6D, W and M.
When Indicator/Strategy returns 0 or natural trend, Strategy Closes All it's positions.
ORIGINALITY & USFULLNESS:
Personal combination of Gann swings and Laplace Stieltjes Transform of a price which results in less noise Volume Zone Oscillator.
The Laplace Stieltjes Transform is a mathematical technique that transforms discrete data from the time domain into its corresponding representation in the frequency domain. This process involves breaking down a signal into its individual frequency components, thereby exposing the amplitude and phase characteristics inherent in each frequency element.
This indicator utilizes the concept of Ehler's Universal Oscillator and displays a histogram, offering critical insights into the prevailing levels of market noise. The Ehler's Universal Oscillator is grounded in a statistical model that captures the erratic and unpredictable nature of market movements. Through the application of this principle, the histogram aids traders in pinpointing times when market volatility is either rising or subsiding.
The Gann swing strategy is developed by meomeo105, this Gann high and low algorithm forms the basis of the EMA modification.
DETAILED DESCRIPTION:
My detailed description of the indicator and use cases which I find very valuable.
What is oscillator?
Oscillators are chart indicators that can assist a trader in determining overbought or oversold conditions in ranging (non-trending) markets.
What is volume zone oscillator?
Price Zone Oscillator measures if the most recent closing price is above or below the preceding closing price.
Volume Zone Oscillator is Volume multiplied by the 1 or -1 depending on the difference of the preceding 2 close prices and smoothed with Exponential moving Average.
What does this mean?
If the VZO is above 0 and VZO is rising. We have a bullish trend. Most likely.
If the VZO is below 0 and VZO is falling. We have a bearish trend. Most likely.
Rising means that VZO on close is higher than the previous day.
Falling means that VZO on close is lower than the previous day.
What if VZO is falling above 0 line?
It means we have a high probability of a bearish trend.
Thus the indicator returns 0 and Strategy closes all it's positions when falling above 0 (or rising bellow 0) and we combine higher and lower timeframes to gauge the trend.
What is approximation and smoothing?
They are mathematical concepts for making a discrete set of numbers a
continuous curved line.
Laplace Stieltjes Transform approximation of a close price are taken from aprox library.
Key Features:
You can tailor the Indicator/Strategy to your preferences with adjustable parameters such as VZO length, noise reduction settings, and smoothing length.
Volume Zone Oscillator (VZO) shows market sentiment with the VZO, enhanced with Exponential Moving Average (EMA) smoothing for clearer trend identification.
Noise Reduction leverages Euler's White noise capabilities for effective noise reduction in the VZO, providing a cleaner and more accurate representation of market dynamics.
Choose between the traditional Fast Laplace Stieltjes Transform (FLT) and the innovative Double Discrete Fourier Transform (DTF32) soothed price series to suit your analytical needs.
Use dynamic calculation of Laplace coefficient or the static one. You may modify those inputs and Strategy entries with Gann swings.
I suggest using "Close all" input False when fine-tuning Inputs for 1 TimeFrame. When you export data to Excel/Numbers/GSheets I suggest using "Close all" input as True, except for the lowest TimeFrame. I suggest using 100% equity as your default quantity for fine-tune purposes. I have to mention that 100% equity may lead to unrealistic backtesting results. Be avare. When backtesting for trading purposes use Contracts or USDT.

Fine-tune Inputs: Fourier Smoothed Volume zone oscillator WFSVZ0Use this Strategy to Fine-tune inputs for the (W&)FSVZ0 Indicator.
Strategy allows you to fine-tune the indicator for 1 TimeFrame at a time; cross Timeframe Input fine-tuning is done manually after exporting the chart data.
I suggest using "Close all" input False when fine-tuning Inputs for 1 TimeFrame. When you export data to Excel/Numbers/GSheets I suggest using "Close all" input as True, except for the lowest TimeFrame.
MEANINGFUL DESCRIPTION:
The Volume Zone oscillator breaks up volume activity into positive and negative categories. It is positive when the current closing price is greater than the prior closing price and negative when it's lower than the prior closing price. The resulting curve plots through relative percentage levels that yield a series of buy and sell signals, depending on level and indicator direction.
The Wavelet & Fourier Smoothed Volume Zone Oscillator (W&)FSVZO is a refined version of the Volume Zone Oscillator, enhanced by the implementation of the Discrete Fourier Transform . Its primary function is to streamline price data and diminish market noise, thus offering a clearer and more precise reflection of price trends.
By combining the Wavalet and Fourier aproximation with Ehler's white noise histogram, users gain a comprehensive perspective on volume-related market conditions.
HOW TO USE THE INDICATOR:
The default period is 2 but can be adjusted after backtesting. (I suggest 5 VZO length and NoiceR max length 8 as-well)
The VZO points to a positive trend when it is rising above the 0% level, and a negative trend when it is falling below the 0% level. 0% level can be adjusted in setting by adjusting VzoDifference. Oscillations rising below 0% level or falling above 0% level result in a natural trend.
HOW TO USE THE STRATEGY:
Here you fine-tune the inputs until you find a combination that works well on all Timeframes you will use when creating your Automated Trade Algorithmic Strategy. I suggest 4h, 12h, 1D, 2D, 3D, 4D, 5D, 6D, W and M.
When I ndicator/Strategy returns 0 or natural trend , Strategy Closes All it's positions.
ORIGINALITY & USFULLNESS:
Personal combination of Fourier and Wavalet aproximation of a price which results in less noise Volume Zone Oscillator.
The Wavelet Transform is a powerful mathematical tool for signal analysis, particularly effective in analyzing signals with varying frequency or non-stationary characteristics. It dissects a signal into wavelets, small waves with varying frequency and limited duration, providing a multi-resolution analysis. This approach captures both frequency and location information, making it especially useful for detecting changes or anomalies in complex signals.
The Discrete Fourier Transform (DFT) is a mathematical technique that transforms discrete data from the time domain into its corresponding representation in the frequency domain. This process involves breaking down a signal into its individual frequency components, thereby exposing the amplitude and phase characteristics inherent in each frequency element.
This indicator utilizes the concept of Ehler's Universal Oscillator and displays a histogram, offering critical insights into the prevailing levels of market noise. The Ehler's Universal Oscillator is grounded in a statistical model that captures the erratic and unpredictable nature of market movements. Through the application of this principle, the histogram aids traders in pinpointing times when market volatility is either rising or subsiding.
DETAILED DESCRIPTION:
My detailed description of the indicator and use cases which I find very valuable.
What is oscillator?
Oscillators are chart indicators that can assist a trader in determining overbought or oversold conditions in ranging (non-trending) markets.
What is volume zone oscillator?
Price Zone Oscillator measures if the most recent closing price is above or below the preceding closing price.
Volume Zone Oscillator is Volume multiplied by the 1 or -1 depending on the difference of the preceding 2 close prices and smoothed with Exponential moving Average.
What does this mean?
If the VZO is above 0 and VZO is rising. We have a bullish trend. Most likely.
If the VZO is below 0 and VZO is falling. We have a bearish trend. Most likely.
Rising means that VZO on close is higher than the previous day.
Falling means that VZO on close is lower than the previous day.
What if VZO is falling above 0 line?
It means we have a high probability of a bearish trend.
Thus the indicator returns 0 and Strategy closes all it's positions when falling above 0 (or rising bellow 0) and we combine higher and lower timeframes to gauge the trend.
In the next Image you can see that trend is negative on 4h, negative on 12h and positive on 1D. That means trend is negative.
I am sorry, the chart is a bit messy. The idea is to use the indicator over more than 1 Timeframe.
What is approximation and smoothing?
They are mathematical concepts for making a discrete set of numbers a
continuous curved line.
Fourier and Wavelet approximation of a close price are taken from aprox library.
Key Features:
You can tailor the Indicator/Strategy to your preferences with adjustable parameters such as VZO length, noise reduction settings, and smoothing length.
Volume Zone Oscillator (VZO) shows market sentiment with the VZO, enhanced with Exponential Moving Average (EMA) smoothing for clearer trend identification.
Noise Reduction leverages Euler's White noise capabilities for effective noise reduction in the VZO, providing a cleaner and more accurate representation of market dynamics.
Choose between the traditional Fast Fourier Transform (FFT) , the innovative Double Discrete Fourier Transform (DTF32) and Wavelet soothed Fourier soothed price series to suit your analytical needs.
Image of Wavelet transform with FAST settings, Double Fourier transform with FAST settings. Improved noice reduction with SLOW settings, and standard FSVZO with SLOW settings:
Fast setting are setting by default:
VZO length = 2
NoiceR max Length = 2
Slow settings are:
VZO length = 5 or 7
NoiceR max Length = 8
As you can see fast setting are more volatile. I suggest averaging fast setting on 4h 12h 1d 2d 3d 4d W and M Timeframe to get a clear view on market trend.
What if I want long only when VZO is rising and above 15 not 0?
You have set Setting VzoDifference to 15. That reduces the number of trend changes.
Example of W&FSVZO with VzoDifference 15 than 0:
VZO crossed 0 line but not 15 line and that's why Indicator returns 0 in one case an 1 in another.
What is Smooth length setting?
A way of calculating Bullish or Bearish (W&)FSVZO .
If smooth length is 2 the trend is rising if:
rising = VZO > ta.ema(VZO, 2)
Meaning that we check if VZO is higher that exponential average of the last 2 elements.
If smooth length is 1 the trend is rising if:
rising = VZO_ > VZO_
Use this Strategy to fine-tune inputs for the (W&)FSVZO Indicator.
(Strategy allows you to fine-tune the indicator for 1 TimeFrame at a time; cross Timeframe Input fine-tuning is done manually after exporting the chart data)
I suggest using " Close all " input False when fine-tuning Inputs for 1 TimeFrame . When you export data to Excel/Numbers/GSheets I suggest using " Close all " input as True , except for the lowest TimeFrame . I suggest using 100% equity as your default quantity for fine-tune purposes. I have to mention that 100% equity may lead to unrealistic backtesting results. Be avare. When backtesting for trading purposes use Contracts or USDT.

Kill Zone Strategy - Exact Match고죠 훈의 차트공부방
Gojo Hoon’s Trading Room
Kill Zone 시간대 방향성과 일중 추세의 상관관계
The 9–10 AM Kill Zone candle on the KOSPI chart determines the day’s long or short trading direction.

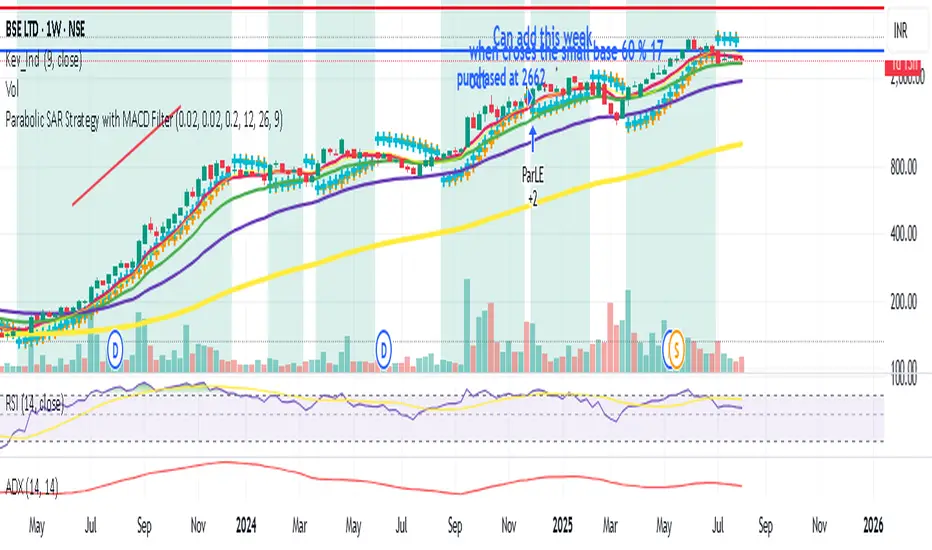
Parabolic SAR Strategy with MACD Confirmation & Trend Zone Highl📝 Description (SEO + Follower-Friendly):
🚀 Powerful Trend Strategy Using Parabolic SAR + MACD
This advanced Pine Script combines the classic Parabolic SAR trend-following system with MACD crossover confirmation, improving entry precision and filtering out false signals. The script also features:
✅ Dynamic trend zone background highlighting when SAR is below price
✅ MACD filter ensures trades align with market momentum
✅ Custom SAR logic with adaptive acceleration
✅ Clean visual SAR plots for easy trend tracking
✅ Fully backtestable with strategy.entry logic
🔎 Ideal for traders seeking early trend entries, momentum confirmation, and visual clarity.
📈 Works on all timeframes and pairs — perfect for swing traders, scalpers, and crypto enthusiasts.
💡 Use it as a base strategy or combine with your favorite indicators.
❤️ If you find this helpful, don't forget to like, comment, and follow for more premium strategies!
Williams R Zone Scalper v1.0[BullByte]Originality & Usefulness
Unlike standard Williams R cross-over scripts, this strategy layers five dynamic filters—moving-average trend, Supertrend, Choppiness Index, Bollinger Band Width, and volume validation —and presents a real-time dashboard with equity, PnL, filter status, and key indicator values. No other public Pine script combines these elements with toggleable filters and a custom dashboard. In backtests (BTC/USD (Binance), 5 min, 24 Mar 2025 → 28 Apr 2025), adding these filters turned a –2.09 % standalone Williams R into a +5.05 % net winner while cutting maximum drawdown in half.
---
What This Script Does
- Monitors Williams R (length 14) for overbought/oversold reversals.
- Applies up to five dynamic filters to confirm trend strength and volatility direction:
- Moving average (SMA/EMA/WMA/HMA)
- Supertrend line
- Choppiness Index (CI)
- Bollinger Band Width (BBW)
- Volume vs. its 50-period MA
- Plots blue arrows for Long entries (R crosses above –80 + all filters green) and red arrows for Short entries (R crosses below –20 + all filters green).
- Optionally sets dynamic ATR-based stop-loss (1.5×ATR) and take-profit (2×ATR).
- Shows a dashboard box with current position, equity, PnL, filter status, and real-time Williams R / MA/volume values.
---
Backtest Summary (BTC/USD(Binance), 5 min, 24 Mar 2025 → 28 Apr 2025)
• Total P&L : +50.70 USD (+5.05 %)
• Max Drawdown : 31.93 USD (3.11 %)
• Total Trades : 198
• Win Rate : 55.05 % (109/89)
• Profit Factor : 1.288
• Commission : 0.01 % per trade
• Slippage : 0 ticks
Even in choppy March–April, this multi-filter approach nets +5 % with a robust risk profile, compared to –2.09 % and higher drawdown for Williams R alone.
---
Williams R Alone vs. Multi-Filter Version
• Total P&L :
– Williams R alone → –20.83 USD (–2.09 %)
– Multi-Filter → +50.70 USD (+5.05 %)
• Max Drawdown :
– Williams R alone → 62.13 USD (6.00 %)
– Multi-Filter → 31.93 USD (3.11 %)
• Total Trades : 543 vs. 198
• Win Rate : 60.22 % vs. 55.05 %
• Profit Factor : 0.943 vs. 1.288
---
Inputs & What They Control
- wrLen (14): Williams R look-back
- maType (EMA): Trend filter type (SMA, EMA, WMA, HMA)
- maLen (20): Moving-average period
- useChop (true): Toggle Choppiness Index filter
- ciLen (12): CI look-back length
- chopThr (38.2): CI threshold (below = trending)
- useVol (true): Toggle volume-above-average filter
- volMaLen (50): Volume MA period
- useBBW (false): Toggle Bollinger Band Width filter
- bbwMaLen (50): BBW MA period
- useST (false): Toggle Supertrend filter
- stAtrLen (10): Supertrend ATR length
- stFactor (3.0): Supertrend multiplier
- useSL (false): Toggle ATR-based SL/TP
- atrLen (14): ATR period for SL/TP
- slMult (1.5): SL = slMult × ATR
- tpMult (2.0): TP = tpMult × ATR
---
How to Read the Chart
- Blue arrow (Long): Williams R crosses above –80 + all enabled filters green
- Red arrow (Short) : Williams R crosses below –20 + all filters green
- Dashboard box:
- Top : position and equity
- Next : cumulative PnL in USD & %
- Middle : green/white dots for each filter (green=passing, white=disabled)
- Bottom : Williams R, MA, and volume current values
---
Usage Tips
- Add the script : Indicators → My Scripts → Williams R Zone Scalper v1.0 → Add to BTC/USD chart on 5 min.
- Defaults : Optimized for BTC/USD.
- Forex majors : Raise `chopThr` to ~42.
- Stocks/high-beta : Enable `useBBW`.
- Enable SL/TP : Toggle `useSL`; stop-loss = 1.5×ATR, take-profit = 2×ATR apply automatically.
---
Common Questions
- * Why not trade every Williams R reversal?*
Raw Williams R whipsaws in sideways markets. Choppiness and volume filters reduce false entries.
- *Can I use on 1 min or 15 min?*
Yes—adjust ATR length or thresholds accordingly. Defaults target 5 min scalping.
- *What if all filters are on?*
Fewer arrows, higher-quality signals. Expect ~10 % boost in average win size.
---
Disclaimer & License
Trading carries risk of loss. Use this script “as is” under the Mozilla Public License 2.0 (mozilla.org). Always backtest, paper-trade, and adjust risk settings to your own profile.
---
Credits & References
- Pine Script v6, using TradingView’s built-in `ta.supertrend()`.
- TradingView House Rules: www.tradingview.com
Goodluck!
BullByte

Combo 2/20 EMA & Adaptive Price Zone This is combo strategies for get a cumulative signal.
First strategy
This indicator plots 2/20 exponential moving average. For the Mov
Avg X 2/20 Indicator, the EMA bar will be painted when the Alert criteria is met.
Second strategy
The adaptive price zone (APZ) is a volatility-based technical indicator that helps investors
identify possible market turning points, which can be especially useful in a sideways-moving
market. It was created by technical analyst Lee Leibfarth in the article “Identify the
Turning Point: Trading With An Adaptive Price Zone,” which appeared in the September 2006 issue
of the journal Technical Analysis of Stocks and Commodities.
This indicator attempts to signal significant price movements by using a set of bands based on
short-term, double-smoothed exponential moving averages that lag only slightly behind price changes.
It can help short-term investors and day traders profit in volatile markets by signaling price
reversal points, which can indicate potentially lucrative times to buy or sell. The APZ can be
implemented as part of an automated trading system and can be applied to the charts of all tradeable assets.
WARNING:
- For purpose educate only
- This script to change bars colors.

action zone - ATR stop reverse order strategy v0.1 by 9nckACTION ZONE-ATR MOD v0.1 DOCUMENTATION
Overview
This tradingview pine script strategy is mainly created to enrich my coding skill. It is a combination of “CDC-ACTIONZONE” and my personal studies of trading techniques in various sources e.g.book, course or blog. This strategy purposefully built to connect with my automatic trading bot. However, It will be very useful to aid your trading routine by diminishing mental distraction which possibly leads to bad trades.
How does it work?
This strategy will do a basic simple thing that most traders do by creating entry signals on both sides long/short and also set the stop loss. Furthermore, It will also reverse the order (from long to short and vice versa (if long/short conditions are met). Finally, it will recalculate the stop loss/take profit price in every complete bar to increase the chance of winning and limit our loss.
Entry rules(Long/Short)
If you have no open order, an order will be created when a fast EMA crosses(up(long)/down(short) the slow EMA(It’s as simple as that).
If you have an open order, the current order will be (sold if long, covered if short) and the opposite side order will be created.
Exit and Reverse rules(Long/Short)
If fast EMA cross (DOWN(long), UP(short)), the current order will be closed, THE OPPOSITE SIDE ORDER WILL ALSO BE CREATED.
Risk management
FLEX STOP PRICE : initial value will be set at the bar which order created. It is a fast ema (+/-) MIDDLE ATR value.
If MIDDLE ATR value rises, it will be our new stop price.
If MIDDLE ATR value falls, stop price unchanged
If Price OVERBOUGHT(long)/SOLD(short), LOW of that bar will be a new stop price.
Minimum position hold period
In order to eliminate risk of repeatedly open, close orders in sideway trends. Minimum hold period must be passed to start exit our position. However, It always respects stop loss prices. The value refers to the number of bars.
MUST READ!!!
This strategy uses only MARKET ORDER. If you trade with a bot, make sure you choose only enormous market cap tokens.
This strategy is bi-direction strategy. It will work best in the DERIVATIVE market.
It was initially designed to compete in the cryptocurrency market which has very high volume and volatility.
I only use this strategy in 1HR (acceptable change rate, optimum trade frequency)
How (should) we use it?
Choose crypto future pairs (recommend only top 10-15 market volume pairs in Binance, let’s say 1000M+ trade value)
Choose your time frame (1H is strongly recommended)
Setup your portfolio profile (Setting->Properties) such as Initial cap, order size, commission. DO NOT USE CAL ON EVERY TICK IT WILL CAUSE REPAINTING AND YOUR CAPITAL IS BLEEDING !!!
BACKTEST FIRST!! Back test is a combination of art, math and statis(and a bit of luck). You can apply to train and test methods or whatever you are familiar with. In my opinion, your test period should include UPTREND, SIDEWAY, DOWNTREND. Fine tune fast, slow ema first(my best ema length of 1H timeframe around 7-10, 17-22). Try to eliminate fault breakout trade and use other options only necessary. Hopefully we can use automatic optimization on Pine Script soon.
Don’t forget to turn off using a specific backtest date option to start your strategy.A
THIS IS NOT A PERFECT (OR EVEN PROFITABLE) STRATEGY. USE AT YOUR OWN RISK AND TRADE RESPONSIBLY. DYOR DUDE.
