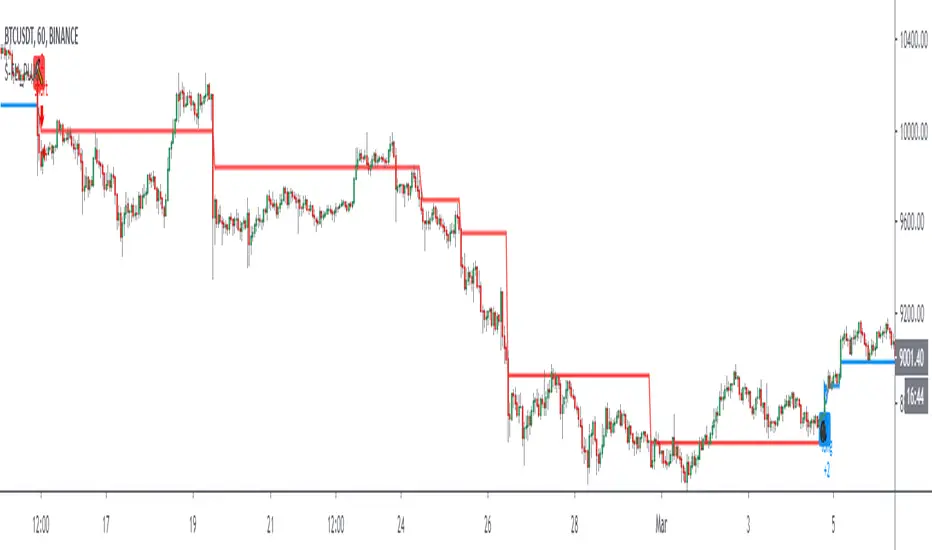
Joseph Nemeth Heiken Ashi Renko MTF StrategyFor Educational Purposes. Results can differ on different markets and can fail at any time. Profit is not guaranteed. This only works in a few markets and in certain situations. Changing the settings can give better or worse results for other markets.
Nemeth is a forex trader that came up with a multi-time frame heiken ashi based strategy that he showed to an older audience crowd on a speaking event video. He seems to boast about his strategy having high success results and makes an astonishing claim that looking at heiken ashi bars instead of regular candlestick bar charts can show the direction of the trend better and simpler than many other slower non-price based indicators. He says pretty much every indicator is about the same and the most important indicator is price itself. He is pessimistic about the markets and seems to think it is rigged and there is a sort of cabal that created rules to favor themselves, such as the inability of traders to hedge in one broker account, and that to win you have to take advantage of the statistics involved in the game. He believes fundamentals, chart patterns such as cup and handle and head and shoulders, and fibonacci numbers don't matter, only price matters. The foundation of his trading strategy is based around heiken ashi bars because they show a statistical pattern that can supposedly be taken advantage of by them repeating around seventy or so percent of the time, and then combines this idea with others based on the lower time frames involved.
The first step he uses is to identify the trend direction in the higher time frame(daily or 4 hourly) using the color of the heiken ashi bar itself. If it is green then take only long position after the bar completes, if it is red then take only short position. Next, on a lower time frame(1 hour or 30 minutes) look for the slope of the 20 exponential moving average to be sloping upward if going long or the slope of the ema to be sloping downward if going short(the price being above the moving average can work too if it's too hard to visualize the slope). Then look for the last heiken ashi bar, similarly to the first step, if it is green take long position, if it is red take short position. Finally the entry indicator itself will decide the entry on the lowest time frame. Nemeth recommends using MACD or CCI or possibly combine the two indicators on a 5 min or 15 min or so time frame if one does not have access to renko or range bars. If renko bars are available, then he recommends a 5 or 10 tick bar for the size(although I'm not sure if it's really possible to remove the time frame from renko bars or if 5 or 10 ticks is universal enough for everything). The idea is that renko bars paint a bar when there is price movement and it's important to have movement in the market, plus it's a simple indicator to use visually. The exit strategy is when the renko or the lowest time frame indicator used gives off an exit signal or if the above conditions of the higher time frames are not being met(he was a bit vague on this). Enter trades with only one-fifth of your capital because the other fifths will be used in case the trades go against you by applying a hedging technique he calls "zero zone recovery". He is somewhat vague about the full workings(perhaps because he uses his own software to automate his strategy) but the idea is that the second fifth will be used to hedge a trade that isn't going well after following the above, and the other fifths will be used to enter on another entry condition or if the other hedges fail also. Supposedly this helps the trader always come out with a profit in a sort of bushido-like trading tactic of never accepting defeat. Some critics argue that this is simply a ploy by software automation to boost their trade wins or to sell their product. The other argument against this strategy is that trading while the heiken ashi bar has not completed yet can jack up the backtest results, but when it comes to trading in real time, the strategy can end up repainting, so who knows if Nemeth isn't involving repainting or not, however he does mention the trades are upon completion of the bar(it came from an audience member's question). Lastly, the 3 time frames in ascending or descending fashion seem to be spaced out by about factors of 4 if you want to trade other time frames other than 5/15min,30min/1hour, or 4hour/daily(he mentioned the higher time frame should be atleast a dozen times higher than the lower time frame).
Personally I have not had luck getting the seventy+ percent accuracy that he talks about, whether in forex or other things. I made the default on renko bars to an ATR size 1 setting because it looks like the most universal option if the traditional mode box size is too hard to guess, and I made it so that you can switch between ATR and Traditional mode just in case. I don't think the strategy repaints because I think TV set a default on the multi-time frame aspects of their code to not re-paint, but I could be wrong so you might want to watch out for that. The zero zone recovery technique is included in the code but I commented it out and/or remove it because TV does not let you apply hedging properly, as far as I know. If you do use a proper hedging strategy with this, you'll find a very interesting bushido type of trading style involved with the Japanese bars that can boost profits and win rates of around possibly atleast seventy percent on every trade but unfortunately I was not able to test this part out properly because of the limitation on hedging here, and who knows if the hedging part isn't just a plot to sell his product. If his strategy does involve the repainting feature of the heiken ashi bars then it's possible he might have been preaching fools-gold but it's hard to say because he did mention it is upon completion of the bars. If you find out if this strategy works or doesn't work or find out a good setting that I somehow didn't catch, please feel free to let me know, will gladly appreciate it. We are all here to make some money!
Cari dalam skrip untuk "zone"

PMax Explorer STRATEGY & SCREENERProfit Maximizer - PMax Explorer STRATEGY & SCREENER screens the BUY and SELL signals (trend reversals) for 20 user defined different tickers in Tradingview charts.
Simply input the name of the ticker in Tradingview that you want to screen.
Terminology explanation:
Confirmed Reversal: PMax reversal that happened in the last bar and cannot be repainted.
Potential Reversal: PMax reversal that might happen in the current bar but can also not happen depending upon the timeframe closing price.
Downtrend: Tickers that are currently in the sell zone
Uptrend: Tickers that are currently in the buy zone
Screener has also got a built in PMax indicator which users can confirm the reversals on graphs.
Screener explores the 20 tickers in current graph's time frame and also in desired parameters of the SuperTrend indicator.
Also you can optimize the parameters manually with the built in STRATEGY version.
PMax indicator :
Profit Maximizer - PMax is a brand new indicator developed by me.
It's a combination of two trailing stop loss indicators;
One is Anıl Özekşi's MOST (Moving Stop Loss) Indicator
and the other one is well known ATR based SuperTrend
Profit Maximizer - PMax tries to solve this problem. PMax combines the powerful sides of MOST (Moving Average Trend Changer) and SuperTrend (ATR price detection) in one indicator.
Backtest and optimization results of PMax are far better when compared to its ancestors MOST and SuperTrend. It reduces the number of false signals in sideways and give more reliable trade signals.
PMax is easy to determine the trend and can be used in any type of markets and instruments. It does not repaint.
The first parameter in the PMax indicator set by the three parameters is the period/length of ATR.
The second Parameter is the Multiplier of ATR which would be useful to set the value of distance from the built in Moving Average.
I personally think the most important parameter is the Moving Average Length and type.
PMax will be much sensitive to trend movements if Moving Average Length is smaller. And vice versa, will be less sensitive when it is longer.
As the period increases it will become less sensitive to little trends and price actions.
In this way, your choice of period, will be closely related to which of the sort of trends you are interested in.
We are under the effect of the uptrend in cases where the Moving Average is above PMax;
conversely under the influence of a downward trend, when the Moving Average is below PMax.
Built in Moving Average type defaultly set as EMA but users can choose from 8 different Moving Average types like:
SMA : Simple Moving Average
EMA : Exponential Movin Average
WMA : Weighted Moving Average
TMA : Triangular Moving Average
VAR : Variable Index Dynamic Moving Average aka VIDYA
WWMA : Welles Wilder's Moving Average
ZLEMA : Zero Lag Exponential Moving Average
TSF : True Strength Force
Tip: In sideways VAR would be a good choice
You can use PMax default alarms and Buy Sell signals like:
1-
BUY when Moving Average crosses above PMax
SELL when Moving Average crosses under PMax
2-
BUY when prices jumps over PMax line.
SELL when prices go under PMax line.

RSI on VWAP Upgraded strategyFirst of all, the idea of apply RSI to VWAP was inspired by XaviZ; at least, that where I first saw that.
I simply applied the idea and searched for apply this on lower timeframe (M15) to increase the number of positions and improve the profit factor.
The conditions to enter are the same :
long : enter on RSI crossover oversold level
short : enter on RSI crossunder oversell level
To close position, I found a little change to apply :
long : close position when RSI(VWAP) went in overbought zone and crossunder the overbought level OR after being at least x bars in the overbought zone (parameter is 28 by default) => when the first condition happens
short : close position when RSI(VWAP) went in oversold zone and crossover the oversold level OR after being at least x bars in the oversell zone (parameter is 28 by default) => when the first condition happens
With this change, I got better results specially on BTCUSDTPERP (M15) where I reach a 6.8 profit factor with 119 trades closed. Not BAD !
The defaults parameters are the best found for BTCUSDTPERP (M15), but the strategy works fine for other pairs if you take time to find the rights combinations.
In this strategy you can change (with defaults in () ):
RSI length (28)
RSI overbought level (85)
RSI oversell level (30)
Number of bars before leaving as explain above (28)
The choice to take longs only, shorts only or both
The number of coin/token by position
The start date for backtesting
Please note that the script use a pyramiding parameter of 3 (can be changed in the first line of the script); that means that you can take up to 3 positions before closing. It lets you improve average enter price but increase the risk. 3 is the best I found to improve profit factor without expose myself too much.
This script would be better if automated because of the conditions of buy and sell.
It's only for educative purpose, not an advice to invest.
All my free scripts here : fr.tradingview.com
Leave a message and don't forget to follow me ;) !

Strategy Follow Line MTF Any MM AverageThe objective is only to evaluate different configurations of the indicator "Follow Line MTF Any MM Average".
The strategy does not have position management, it's very basic, this indicator should be used to see trend, range zones, evaluate the best areas to enter the market, use higher time frames to confirm a direction can be useful.
I do not recommend using only this indicator to trade, because you can lose all your money if you do not know what you are doing.
I hope you find it useful.
Successes
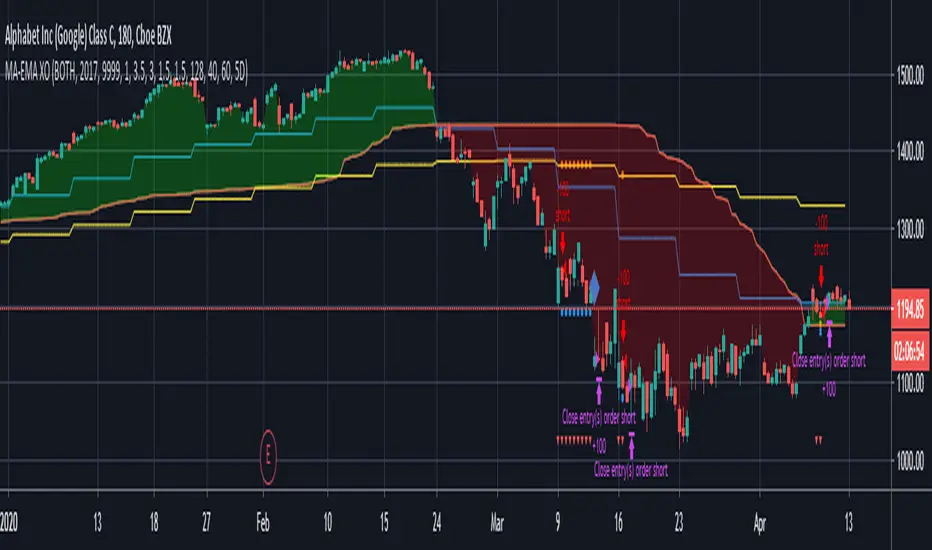
MA-EMA Crossover LTJust a simple strategy based on dynamic zones by Allenster. Still a work in progress.
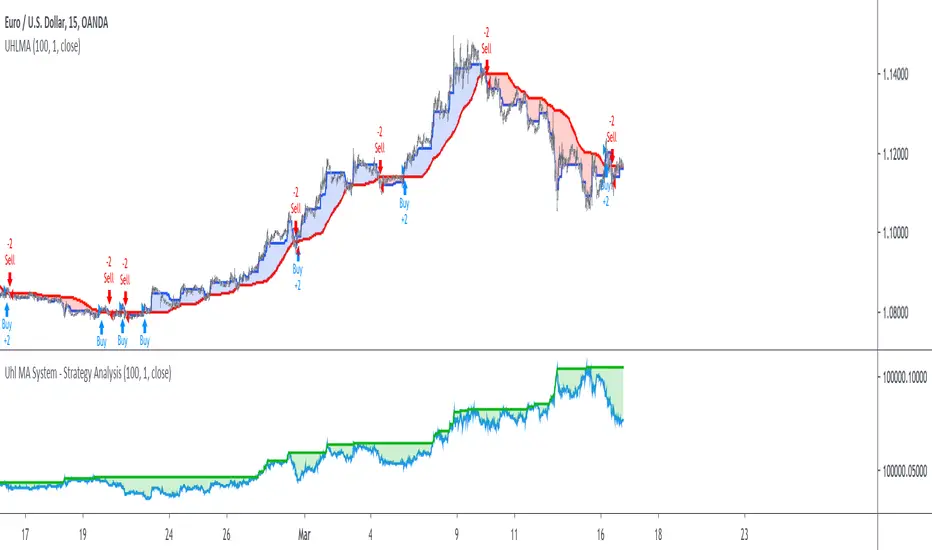
Uhl MA System - Strategy AnalysisThe Uhl MA crossover system was specifically designed to provide an adaptive MA crossover system that didn't committed the same errors of more classical MA systems. This crossover system is based on a fast and a slow moving average, with the slow moving average being the corrected moving average (CMA) originally proposed by Andreas Uhl, and the fast moving average being the corrected trend step (CTS) which is also based on the corrected moving average design.
For more information see :
In this post, the performances of this system are analyzed on various markets.
Setup And Rules
The analysis is solely based on the indicator signals, therefore no spread is applied. Constant position sizing is used. The strategy will be backtested on the 15 minute time-frame. The mult setting is discarded, the default setting used for length is 100.
Here are the rules of our strategy :
long: CTS crossover CMA
short: CTS crossunder CMA
Results And Data
EURUSD:
Net Profit: $ 0.08
Total number of trades: 99
Profitability: 35.35 %
Profit Factor: 1.834
Max Drawdown: $ 0.01
EURUSD behaved pretty well, and was most of time showing long term trends without exhibiting particularly tricky structures, the moving averages still did cross during ranging phases, since march 9 we can see a downtrend with more pronounced cyclical variations (retracements) that could potentially lead to loosing trades.
BTCUSD:
Net Profit: $ 4371.57
Total number of trades: 94
Profitability: 32.98 %
Profit Factor: 1.749
Max Drawdown: $ 1409.96
The strategy didn't started well, producing its largest drawdown after only a few trades, the strategy still managed to recover. BTCUSD exhibited a strong downtrend, the strategy profited from that to recover, signals still occurred on ranging phases, and where mostly caused by a short term volatile move, unfortunately the CMA can converge toward ranging/flat price zones where false signals might occur at higher frequency.
AMD:
Net Profit: $ 16.09
Total number of trades: 95
Profitability: 29.47 %
Profit Factor: 1.288
Max Drawdown: $ 20.11
On AMD the strategy started relatively well with a raising balance, then the balance quickly fallen, this downtrend in the balance lasted quite some time (almost 48 trades), the strategy finally recovered in Nov 2019 and the balance made a new highest high at the end of February. AMD had numerous trends during the backtesting period, yet results are poor.
AAPL:
Net Profit: $ -28.17
Total number of trades: 89
Profitability: 28.09 %
Profit Factor: 0.894
Max Drawdown: $ 63.21
AAPL show the poorest results so far, with a stationary balance around the initial capital (in short the evolution of the balance is not showing any particular trend and oscillate around the initial capital value).
AAPL had some significant retracements in its up-trend, which triggered some trades (of course), and the ranging period from Jan 24 to Feb 13 heavily damaged the strategy performance, generating 6 significant loosing trades. AAPL show the worst results so far, mostly due by ranging phases.
Conclusions
The Uhl MA crossover system strategy has been tested and based on the results don't show particularly interesting performances, and might even be outperformed by simpler MA systems that prove to be more robust against ranging markets. The total number of executed trades are on average 94, and the profitability is on average 31%. The strategy might prove more interesting if we can correct the behavior of the CMA, who sometimes converged toward ranging/flat markets.
RSI Fibonacci Levels StrategyRSI with Fibonacci Levels
Visually can be used as:
- Countertrend indicator at extreme green/red lines
- Follow trend indicator
- Fibonacci supports and resistantes zones
The strategy works as a follow trend
How to trade:
The indicator is more reliable in longer time frames, at least 4H
Choose a fibonacci level as reference
Buy when the RSI line turns green
Sell when the RSI line turns red

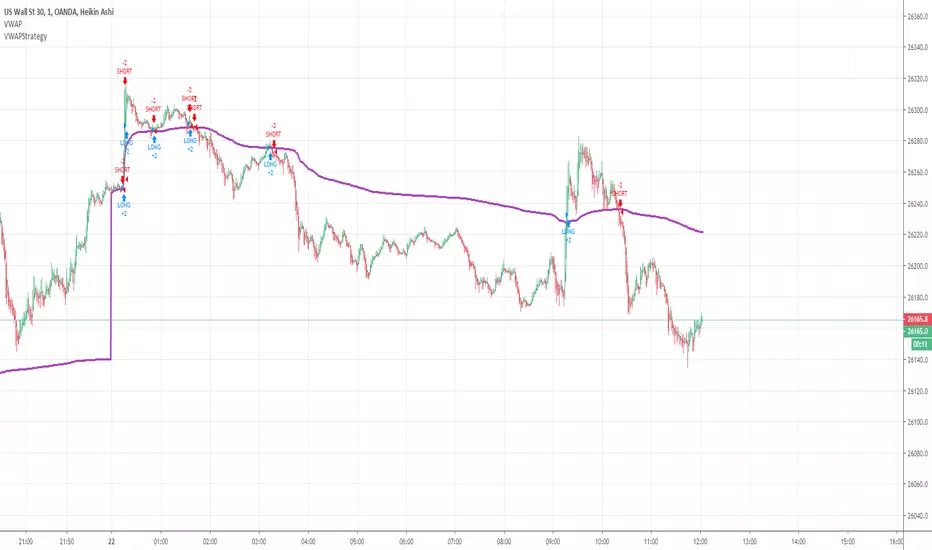
VWAPStrategyCross ema3 with VWAP. Just to give imression of how a day migth be divided in a long- and short bias zone. Not suited as trading signal.
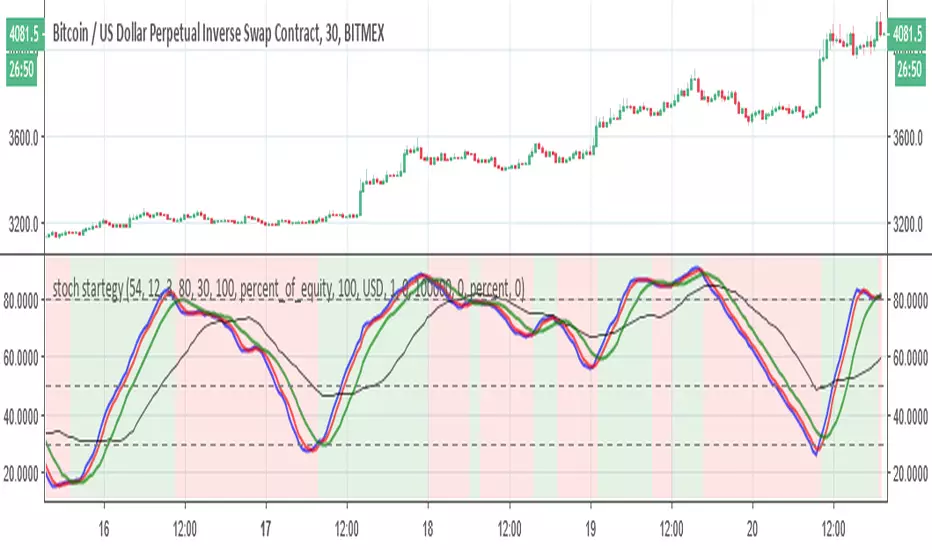
stoch startegyStoch strategy that try to buy in uptrend and to sell in low trend
the bearish and bullish zones are based on regular K stoch over MTF D (3X or timeX3) and vice versa .
The buy and sell rule based on conditions
2- when mtf stochastic cross above 50 and current is rising, buy
3- when mtf stochastic cross bellow 50 and current isfalling, sell
the main script was written by
03.freeman
I just change some settings to improve it
Multiple Moving Averages+TransientZones+Volumes///////////////////////////////////////////////////////////////////////////////////////////
//// MULTIPLE_MA+TRANSIENT_ZONES+VOLUMES ////
/////////////////////////////////////////////////////////////////////////////////////////
// @author GianlucaBezziccheri
// A simple script including:
// 1) 4x Simple Moving Averages
// 2) 4x Exponential Moving Averages
// 3) 4x Weighted Moving Averages
// 4) 4x Volume Weighted Moving Averages
// 5) 4x Hull Moving Averages
// 6) Transient Zones v1.1 (by Jurij)
// 7) Volumes
// You can choose MA type you prefer and even to activate all of them at the same time,
// though i don't recommend doing this.
// For more details about 6) check the original script

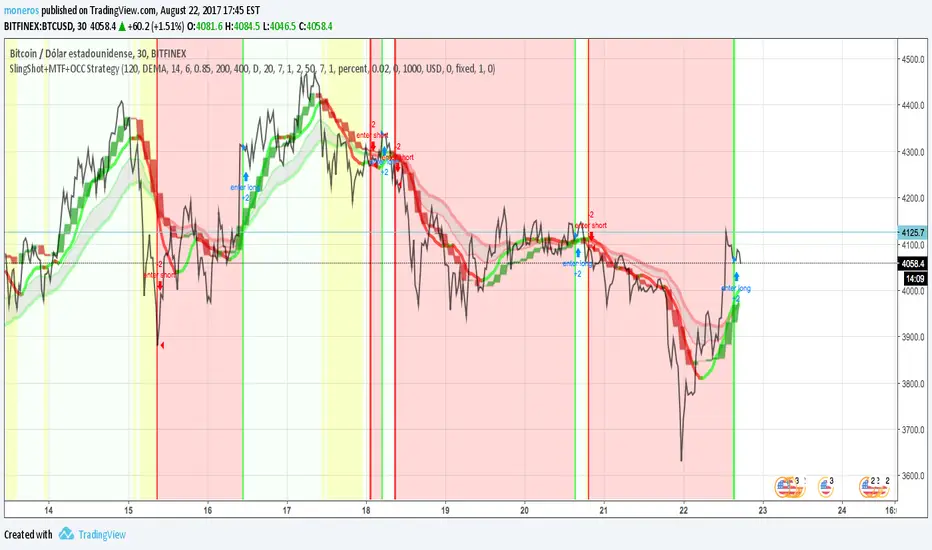
SlingShot + MTF + Open Close Cross StrategyIt's a merge of three really good scripts CM sling shot, CM MTC and Open Close Cross
Indicates open and close with Sling shot and shots after peaks by MTC and OCC.
Yellow zones before drop prices, green bar, red bar for open and close.
imgur.com
Gold Smart Scalper AI V21. The "Red Zone" (News Management)
The strategy logic does not "know" when the Federal Reserve is speaking.
Rule: Disable the strategy or stop taking signals 15 minutes before and after high-impact news (CPI, NFP, FOMC).
Why: During these times, Gold can move $30 in seconds. Slippage will cause your $1.50 Stop Loss to execute much further away, leading to massive drawdown.
2. Session Selection
Gold "Scalping" requires high liquidity and tight spreads.
Discretionary Filter: Only trade during the London/New York overlap (13:00 – 17:00 UTC).
Avoid: The late Asian session or Sunday market open. Spreads often widen to $0.50–$1.00, meaning you are already down 30-50% of your Stop Loss the moment you enter.
3. Market "Mood" (Trend vs. Range)
Trend Context: If the 50 EMA (the White line) is completely flat, the market is in a "Bracket." In this state, EMA crossovers generate many false signals.
The Adjustment: Discretionary traders wait for the 50 EMA to show a clear slope (up or down) before trusting the 9/21 crossover signals.

Multi-MA + RSI Pullback Strategy (Jordan)1️⃣ Strategy logic I’ll code
From your screenshots:
Indicators
• EMAs: 600 / 200 / 100 / 50
• RSI: length 6, levels 80 / 20
Rules (simplified so a script can handle them):
• Use a higher-timeframe trend filter (15m or 1h) using the EMAs.
• Take entries on the chart timeframe (you can use 1m or 5m).
• Long:
• Higher-TF trend is up.
• Price is pulling back into a zone (between 50 EMA and 100 EMA on the entry timeframe – this approximates your 50–61% retrace).
• RSI crosses below 20 (oversold).
• Short:
• Higher-TF trend is down.
• Price pulls back between 50 & 100 EMAs.
• RSI crosses above 80 (overbought).
• Exits: ATR-based stop + take-profit with adjustable R:R (2:1 or 3:1).
• Max 4 trades per day.
News filter & “only trade gold” you handle manually (run it on XAUUSD and avoid news times yourself – TradingView can’t read the economic calendar from code).

Momentum Reversal / Dip Buyer [Score Based]Strategy Overview
Momentum Reversal / Dip Buyer is a quantitative reversal engine designed to fade stretched moves and buy dips / sell rallies when multiple momentum and context factors line up. It’s built for liquid instruments especially for ticker CME_MINI:ES1! and works best on intraday timeframes like the 5-minute or 1-minute chart.
Core Logic
This strategy builds a composite Momentum Score by combining:
Price Location: Relative to 100 SMA, 1000 EMA, and VWAP (trend / regime filter).
RSI: Overbought/oversold and mid-zone strength.
VWMO (Volume-Weighted Momentum): Direction and strength of volume-weighted price drift.
ADX: Trend strength filter (high vs low trend environment).
Full Stoch (%K): Short-term exhaustion and mean-reversion context.
CCI: Overbought/oversold turns (key trigger).
MFI: Volume-confirmed buying/selling pressure.
ATR Regime: High vs low volatility environment.
Cumulative Delta: Whether net aggressor flow is rising or falling.
From this, a single Momentum Score is computed each bar:
Longs: Taken when the score is depressed (scoreLow) and CCI crosses up from oversold.
Shorts: Taken when the score is elevated (scoreHigh) and CCI crosses down from overbought.
Risk Management & Trade Logic
Max Daily Trades: Hard cap on entries per day.
Hard Stop: Fixed % stop based on entry price.
Profit Target: Target ATR Multiplier × main ATR from entry.
Breakeven Logic: Optional; moves stop to breakeven (plus optional offset) after price moves a configurable multiple of the main ATR in your favor.
Trailing Stop (Separate ATR): Optional; uses its own ATR length and ATR-based trigger and distance. This lets you run slower ATR for targets while using a tighter, more reactive ATR for the trail.
Session Control
Trading Window: Optional session filter (e.g., 09:30–16:00). Entries are only allowed inside the defined window.
Force Flat at Session End: Option to automatically close all open positions when the session ends.
Visuals
The script plots entry arrows and a compact dashboard displaying: current Momentum Score, daily trade usage, and CCI status.
Disclaimer:
This script is for educational and research purposes only and is not financial advice. Past performance does not guarantee future results. Always forward-test and adjust parameters to your own risk tolerance and market.
Shoutout and all credit goes to AuclairsCapital for building the base foundation of this strategy on ThinkScript

Hyper Insight MA Strategy [Universal]Hyper Insight MA Strategy ** is a comprehensive trend-following engine designed for traders who require precision and flexibility. Unlike standard indicators that lock you into a single calculation method, this strategy serves as a "Universal Adapter," allowing you to **Mix & Match 13 different Moving Average types** for both the Fast and Slow trend lines independently.
Whether you need the smoothness of T3, the responsiveness of HMA, or the classic reliability of SMA, this script enables you to backtest thousands of combinations to find the perfect edge for your specific asset class.
---
🔬 Deep Dive: Calculation Logic of Included MAs
This strategy includes 13 distinct calculation methods. Understanding the math behind them will help you choose the right tool for your specific market conditions.
#### 1. Standard Averages
* **SMA (Simple Moving Average):** The unweighted mean of the previous $n$ data points.
* *Logic:* Treats every price point in the period with equal importance. Good for identifying long-term macro trends but reacts slowly to recent volatility.
* **WMA (Weighted Moving Average):** A linear weighted average.
* *Logic:* Assigns heavier weight to current data linearly (e.g., $1, 2, 3... n$). It reacts faster than SMA but is still relatively smooth.
* **SWMA (Symmetrically Weighted Moving Average):**
* *Logic:* Uses a fixed-length window (usually 4 bars) with symmetrical weights $ $. It prioritizes the center of the recent data window.
#### 2. Exponential & Lag-Reducing Averages
* **EMA (Exponential Moving Average):**
* *Logic:* Applies an exponential decay weighting factor. Recent prices have significantly more impact on the average than older prices, reducing lag compared to SMA.
* **RMA (Running Moving Average):** Also known as Wilder's Smoothing (used in RSI).
* *Logic:* It is essentially an EMA but with a slower alpha weight of $1/length$. It provides a very smooth, stable line that filters out noise effectively.
* **DEMA (Double Exponential Moving Average):**
* *Logic:* Calculated as $2 \times EMA - EMA(EMA)$. By subtracting the "lag" (the smoothed EMA) from the original EMA, DEMA provides a much faster reaction to price changes with less noise than a standard EMA.
* **TEMA (Triple Exponential Moving Average):**
* *Logic:* Calculated as $3 \times EMA - 3 \times EMA(EMA) + EMA(EMA(EMA))$. This effectively eliminates the lag inherent in single and double EMAs, making it an extremely fast-tracking indicator for scalping.
#### 3. Advanced & Adaptive Averages
* **HMA (Hull Moving Average):**
* *Logic:* A composite formula involving Weighted Moving Averages: ASX:WMA (2 \times Integer(n/2)) - WMA(n)$. The result is then smoothed by a $\sqrt{n}$ WMA.
* *Effect:* It eliminates lag almost entirely while managing to improve curve smoothness, solving the traditional trade-off between speed and noise.
* **ZLEMA (Zero Lag Exponential Moving Average):**
* *Logic:* This calculation attempts to remove lag by modifying the data source before smoothing. It calculates a "lag" value $(length-1)/2$ and applies an EMA to the data: $Source + (Source - Source )$. This creates a projection effect that tracks price tightly.
* **T3 (Tillson T3 Moving Average):**
* *Logic:* A complex smoothing technique that runs an EMA through a filter multiple times using a "Volume Factor" (set to 0.7 in this script).
* *Effect:* It produces a curve that is incredibly smooth and free of "overshoot," making it excellent for filtering out market chop.
* **ALMA (Arnaud Legoux Moving Average):**
* *Logic:* Uses a Gaussian distribution (bell curve) to assign weights. It allows the user to offset the moving average (moving the peak of the weight) to align it perfectly with the price, balancing smoothness and responsiveness.
* **LSMA (Least Squares Moving Average):**
* *Logic:* Calculates the endpoint of a Linear Regression line for the lookback period. It essentially guesses where the price "should" be based on the best-fit line of the recent trend.
* **VWMA (Volume Weighted Moving Average):**
* *Logic:* Weights the closing price by the volume of that bar.
* *Effect:* Prices on high volume days pull the MA harder than prices on low volume days. This is excellent for validating true trend strength (i.e., a breakout on high volume will move the VWMA significantly).
---
### 🛠 Features & Settings
* **Universal Switching:** Change the `Fast MA` and `Slow MA` types instantly via the settings menu.
* **Trend Cloud:** A dynamic background fill (Green/Red) highlights the crossover zone for immediate visual trend identification.
* **Strategy Mode:** Built-in Backtesting logic triggers `LONG` entries when Fast MA crosses over Slow MA, and `EXIT` when Fast MA crosses under.
### ⚠️ Disclaimer
This script is intended for educational and research purposes. The wide variety of MA combinations can produce vastly different results. Past performance is not indicative of future results. Please use proper risk management.

EMA + Sessions + RSI Strategy v1.0A professional trading strategy that combines multiple technical indicators for high-probability entries. This system uses EMA crossovers, RSI zone filtering, and trend confirmation to identify optimal trading opportunities while managing risk with advanced position management tools.
Key Features:
✅ Dual Entry Signals (EMA21 + EMA100 crossover conditions)
✅ Trend Filter EMA750 (trade only with the major trend)
✅ Complete Risk Management (SL 1%, TP 3% default)
✅ Trailing Stop & Breakeven (maximize profits, protect capital)
✅ Compact Statistics Table (real-time performance metrics)
✅ RSI & Session Filters (avoid low-probability setups)
✅ Optional Pyramiding (scale into winning positions)
Perfect for swing trading and trend-following on any timeframe. Fully customizable to match your trading style.

The Oracle: Dip & Top Adaptive Sniper [Hakan Yorganci]█ OVERVIEW
The Oracle: Dip & Top Adaptive Sniper is a precision-focused trend trading strategy designed to solve the biggest problem in swing trading: Timing.
Most trend-following strategies chase price ("FOMO"), buying when the asset is already overextended. The Oracle takes a different approach. It adopts a "Sniper" mentality: it identifies a strong macro trend but patiently waits for a Mean Reversion (pullback) to execute an entry at a discounted price.
By combining the structural strength of Moving Averages (SMA 50/200) with the momentum precision of RSI and the volatility filtering of ADX, this script filters out noise and targets high-probability setups.
█ HOW IT WORKS
This strategy operates on a strictly algorithmic protocol known as "The Yorganci Protocol," which involves three distinct phases: Filter, Target, and Execute.
1. The Macro Filter (Trend Identification)
* SMA 200 Rule: By default, the strategy only scans for buy signals when the price is trading above the 200-period Simple Moving Average. This ensures we are always trading in the direction of the long-term bull market.
* Adaptive Switch: A new feature allows users to toggle the Only Buy Above SMA 200? filter OFF. This enables the strategy to hunt for oversold bounces (dead cat bounces) even during bearish or neutral market structures.
2. The Volatility Filter (ADX Integration)
* Sideways Protection: One of the main weaknesses of moving average strategies is "whipsaw" losses during choppy, ranging markets.
* Solution: The Oracle utilizes the ADX (Average Directional Index). It will BLOCK any trade entry if the ADX is below the threshold (Default: 20). This ensures capital is only deployed when a genuine trend is present.
3. The Sniper Entry (Buying the Dip)
* Instead of buying on breakout strength (e.g., RSI > 60), The Oracle waits for the RSI Moving Average to dip into the "Value Zone" (Default: 45) and cross back up. This technique allows for tighter stops and higher Risk/Reward ratios compared to traditional breakout systems.
█ EXIT STRATEGY
The Oracle employs a dynamic dual-exit mechanism to maximize gains and protect capital:
* Take Profit (The Peak): The strategy monitors RSI heat. When the RSI Moving Average breaches the Overbought Threshold (Default: 75), it signals a "Take Profit", securing gains near the local top before a potential reversal.
* Stop Loss (Trend Invalidated): If the market structure fails and the price closes below the 50-period SMA, the position is immediately closed to prevent deep drawdowns.
█ SETTINGS & CONFIGURATION
* Moving Averages: Fully customizable lengths for Support (SMA 50) and Trend (SMA 200).
* Trend Filter: Checkbox to enable/disable the "Bull Market Only" rule.
* RSI Thresholds:
* Sniper Buy Level: Adjustable (Default: 45). Lower values = Deeper dips, fewer trades.
* Peak Sell Level: Adjustable (Default: 75). Higher values = Longer holds, potentially higher profit.
* ADX Filter: Checkbox to enable/disable volatility filtering.
█ BEST PRACTICES
* Timeframe: Designed primarily for 4H (4-Hour) charts for swing trading. It can also be used on 1H for more frequent signals.
* Assets: Highly effective on trending assets such as Bitcoin (BTC), Ethereum (ETH), and high-volume Altcoins.
* Risk Warning: This strategy is designed for "Long Only" spot or leverage trading. Always use proper risk management.
█ CREDITS
* Original Concept: Inspired by the foundational work of Murat Besiroglu (@muratkbesiroglu).
* Algorithm Development & Enhancements: Developed by Hakan Yorganci (@hknyrgnc).
* Modifications include: Integration of ADX filters, Mean Reversion entry logic (RSI Dip), and Dynamic Peak Profit taking.

Trendshift [CHE] StrategyTrendshift Strategy — First-Shift Structural Regime Trading
Profitfactor 2,603
Summary
Trendshift Strategy implements a structural regime-shift trading model built around the earliest confirmed change in directional structure. It identifies major swing highs and lows, validates breakouts through optional ATR-based conviction, and reacts only to the first confirmed shift in each direction. After a regime reversal, the strategy constructs a premium and discount band between the breakout candle and the previous opposite swing. This band is used as contextual bias and may optionally inform stop placement and position sizing.
The strategy focuses on clear, interpretable structural events rather than continuous signal generation. By limiting entries to the first valid shift, it reduces false recycles and allows the structural state to stabilize before a new trade occurs. All signals operate on closed-bar logic, and the strategy avoids higher-timeframe calls to stabilize execution behavior.
Motivation: Why this design?
Many structure-based systems repeatedly trigger as price fluctuates around prior highs and lows. This often leads to multiple flips during volatile or choppy conditions. Trendshift Strategy addresses this problem by restricting execution to the first confirmed structural event in each direction. ATR-based filters help differentiate genuine structural breaks from noise, while the contextual band ensures that the breakout is meaningful in relation to recent volatility.
The design aims to represent a minimalistic structural trading framework focused on regime turns rather than continuous trend signaling. This reduces chart noise and clarifies where the market transitions from one regime to another.
What’s different vs. standard approaches?
Baseline reference
Typical swing-based structure indicators report every break above or below recent swing points.
Architecture differences
First-shift-only regime logic that blocks repeated signals until direction reverses
ATR-filtered validation to avoid weak or momentum-less breaks
Premium and discount bands derived from breakout structure
Optional band-driven stop placement
Optional band-dependent position-sizing factor
Regime timeout system to neutralize structure after extended inactivity
Persistent-state architecture to prevent re-triggering
Practical effect
Only the earliest actionable structure change is traded
Fewer but higher-quality signals
Premium/discount tint assists contextual evaluation
Stops and sizing can be aligned with structural context rather than arbitrary volatility measures
Improved chart interpretability due to reduced marker frequency
How it works (technical)
The algorithm evaluates symmetric swing points using a fixed bar window. When a swing forms, its value and bar index are stored as persistent state. A structural shift occurs when price closes beyond the most recent major swing on the opposite side. If ATR filtering is enabled, the breakout must exceed a volatility-scaled distance to prevent micro-breaks from firing.
Once a valid shift is confirmed, the regime is updated to bullish or bearish. The script records the breakout level, the opposite swing, and derives a band between them. This band is checked for minimum size relative to ATR to avoid unrealistic contexts.
The first shift in a new direction generates both the strategy entry and a visual marker. Additional shifts in the same direction are suppressed until a reversal occurs. If a timeout is enabled, the regime resets after a specified number of bars without structural change, optionally clearing the band.
Stop placement, if enabled, uses either the opposite or same band edge depending on configuration. Position size is computed from account percentage and may optionally scale with the price-span-to-ATR relationship.
Parameter Guide
Market Structure
Swing length (default 5): Controls swing sensitivity. Lower values increase responsiveness.
Use ATR filter (default true): Requires breakouts to show momentum relative to ATR. Reduces false shifts.
ATR length (default 14): Volatility estimation for breakout and band validation.
Break ATR multiplier (default 1.0): Required breakout strength relative to ATR.
Premium/Discount Framework
Enable framework (default true): Activates premium/discount evaluation.
Persist band on timeout (default true): Keeps structural band after timeout.
Min band ATR mult (default 0.5): Rejects narrow bands.
Regime timeout bars (default 500): Neutralizes regime after inactivity.
Invert colors (default false): Color scheme toggle.
Visuals
Show zone tint (default true): Background shade in premium or discount region.
Show shift markers (default true): Display first-shift markers.
Execution and Risk
Risk per trade percent (default 1.0): Determines position size as account percentage.
Use band for size (default false): Scales size relative to band width behavior.
Flat on opposite shift (default true): Forces reversal behavior.
Use stop at band (default false): Stop anchored to band edges.
Stop band side: Chooses which band edge is used for stop generation.
Reading & Interpretation
A green background indicates discount conditions within the structural band; red indicates premium conditions. A green triangle below price marks the first bullish structural shift after a bearish regime. A red triangle above price marks the first bearish structural shift after a bullish regime.
When stops are active, the opposite band edge typically defines the protective level. Band width relative to ATR indicates how significant a structural change is: wider bands imply stronger volatility structure, while narrow bands may be suppressed by the minimum-size filter.
Practical Workflows & Combinations
Trend following: Use first-shift entries as initial regime confirmation. Add higher-timeframe trend filters for additional context.
Swing trading: Combine with simple liquidity or fair-value-gap concepts to refine entries.
Bias mapping: Use higher timeframes for structural regime and lower timeframes for execution within the premium/discount context.
Exit management: When using stops, consider ATR-scaling or multi-stage profit targets. When not using stops, reversals become the primary exit.
Behavior, Constraints & Performance
The strategy uses only confirmed swings and closed-bar logic, avoiding intrabar repaint. Pivot-based swings inherently appear after the pivot window completes, which is standard behavior. No higher-timeframe calls are used, preventing HTF-related repaint issues.
Persistent variables track regime and structural levels, minimizing recomputation. The maximum bars back setting is five-thousand. The design avoids loops and arrays, keeping performance stable.
Known limitations include limited signal density during consolidations, delayed swing confirmation, and sensitivity to extreme gaps that stretch band logic. ATR filtering mitigates some of these effects but does not eliminate them entirely.
Sensible Defaults & Quick Tuning
Fewer but stronger entries: Increase swing length or ATR breakout multiplier.
More responsive entries: Reduce swing length to capture earlier shifts.
More active band behavior: Lower the minimum band ATR threshold.
Stricter stop logic: Use the opposite band edge for stop placement.
Volatile markets: Increase ATR length slightly to stabilize behavior.
What this indicator is—and isn’t
Trendshift Strategy is a structural-regime trading engine that evaluates major directional shifts. It is not a complete trading system and does not include take-profit logic or prediction features. It does not attempt to forecast future price movement and should be used alongside broader market structure, volatility context, and disciplined risk management.
Disclaimer
The content provided, including all code and materials, is strictly for educational and informational purposes only. It is not intended as, and should not be interpreted as, financial advice, a recommendation to buy or sell any financial instrument, or an offer of any financial product or service. All strategies, tools, and examples discussed are provided for illustrative purposes to demonstrate coding techniques and the functionality of Pine Script within a trading context.
Any results from strategies or tools provided are hypothetical, and past performance is not indicative of future results. Trading and investing involve high risk, including the potential loss of principal, and may not be suitable for all individuals. Before making any trading decisions, please consult with a qualified financial professional to understand the risks involved.
By using this script, you acknowledge and agree that any trading decisions are made solely at your discretion and risk.
Do not use this indicator on Heikin-Ashi, Renko, Kagi, Point-and-Figure, or Range charts, as these chart types can produce unrealistic results for signal markers and alerts.
Best regards and happy trading
Chervolino

Ratchet Exit Trend Strategy with VIX FilterThis strategy is a trend-following system designed specifically for volatile markets. Instead of focusing solely on the "perfect entry," this script emphasizes intelligent trade management using a custom **"Ratchet Exit System."**
Additionally, it integrates a volatility filter based on the CBOE Volatility Index (VIX) to minimize risk during extreme market phases.
### 🎯 The Concept: Ratchet Exit
The "Ratchet" system operates like a mechanical ratchet tool: the Stop Loss can only move in one direction (up, for long trades) and "locks" into specific stages. The goal is to give the trade "room to breathe" initially to avoid being stopped out by noise, then aggressively reduce risk as the trade moves into profit.
The exit logic moves through 3 distinct phases:
1. **Phase 0 (Initial Risk):** At the start of the trade, a wide Stop Loss is set (Default: 10%) to tolerate normal market volatility.
2. **Phase 1 (Risk Reduction):** Once the trade reaches a specific floating profit (Default: +10%), the Stop Loss is raised and "pinned" to a fixed value (Default: -8% from entry). This drastically reduces risk while keeping the trade alive.
3. **Phase 2 (Trailing Mode):** If the trend extends to a higher profit zone (Default: +15%), the Stop switches to a dynamic Trailing Mode. It follows the **Highest High** at a fixed percentage distance (Default: 8%).
### 🛡️ VIX Filter & Panic Exit
High volatility is often the enemy of trend-following strategies.
* **Entry Filter:** The system will not enter new positions if the VIX is above a user-defined threshold (Default: 32). This helps avoid entering "falling knife" markets.
* **Panic Exit:** If the VIX spikes above the threshold (32) while a trade is open, the position is closed immediately to protect capital (Emergency Exit).
### 📈 Entry Signals
The strategy trades **LONG only** and uses Simple Moving Averages (SMAs) to identify trends:
* **Golden Cross:** SMA 25 crosses over SMA 50.
* **3-Bar Breakouts:** A confirmation logic where the price must close above the SMA 50, 100, or 200 for 3 consecutive bars.
### ⚙️ Settings (Inputs)
All parameters are fully customizable via the settings menu:
* **SMAs:** Lengths for the trend indicators (Default: 25, 50, 100, 200).
* **VIX Filter:** Toggle the filter on/off and adjust the panic threshold.
* **Ratchet Settings:** Percentages for Initial Stop, Trigger Levels for Stages 1 & 2, and the Trailing Distance.
### ⚠️ Technical Note & Risk Warning
This script uses `request.security` to fetch VIX data. Please ensure you understand the risks associated with trading leveraged or volatile assets. Past performance is not indicative of future results.

Best Entry Swing MASTER v3 PUBLIC (S.S)Strategy Description (English)
Best Entry Swing MASTER v3 – Quality Mode
The Best Entry Swing MASTER v3 is a structured swing trading and trend-following strategy designed to identify high-probability long and short entries during directional markets.
It combines three core setup types commonly used by momentum and breakout traders:
Breakout (BO)
Pullback Reversal (PB)
Volatility Contraction Pattern (VCP)
The strategy applies multiple layers of confirmation, including multi-EMA trend structure, volatility contraction, volume filters, and an optional market regime filter.
It is suitable for swing trading on higher timeframes (4H, Daily), as well as medium-term trend continuation setups.
Core Concepts
1. Trend Structure
A trend is considered valid when:
Uptrend: Price > EMA20 > EMA50 > EMA100
Downtrend: Price < EMA20 < EMA50 < EMA100
In addition, a simple but effective trend-strength metric is calculated using the percentage spread between EMA20 and EMA100.
This helps avoid signals during sideways or low-volatility environments.
2. Market Regime Filter
The market environment is determined using a higher timeframe benchmark (default: SPY on Daily).
Only long trades are allowed in bullish market conditions
Only short trades in bearish conditions
This significantly reduces false signals in counter-trend conditions.
Entry Logic
Breakout (BO)
A long breakout triggers when:
Price closes above the highest high of the lookback period
Volume exceeds its 20-period average
Trend and market regime confirm
(Optional A+ mode): true volatility contraction is required
Similar logic applies for short breakdowns.
Pullback (PB)
A pullback entry triggers after:
At least two corrective candles
A strong reversal candle (close above previous high for long)
Volume confirmation
Price interacts with EMA20
This structure models classical trend-reentry conditions.
Volatility Contraction Pattern (VCP)
A VCP entry triggers when:
True range contracts over multiple bars
Price holds near the breakout zone
Volume contracts
Trend and market regime are aligned
This setup aims to capture explosive continuation moves.
Quality Modes
The strategy offers two modes:
Balanced Mode
Moderate signal frequency
Broader trend-strength allowance
Suitable for more active traders
A+ Only Mode
Strict confirmation requirements
Only high-quality setups with multiple confluences
Designed to avoid low-probability trades entirely
Risk Management
Risk is managed using an ATR-based stop and target:
Long SL = Close − ATR × 1.5
Long TP = Close + ATR × 3
(Equivalent logic for short positions)
This provides a balanced reward-to-risk profile and avoids overly tight stops.
Early Entry Signals (Optional)
The script offers optional “Early Entry” markers that highlight when a setup is forming but not yet confirmed.
These are not entry signals and are disabled by default for public use.
Intended Use
This strategy is designed for:
Swing trading
Momentum continuation
Trend-following
Multi-day to multi-week trades
It performs best on:
4H
Daily
High-liquidity equities, indices, and futures
Disclaimer
This script is intended for educational and research purposes.
Past performance does not guarantee future results.
Always backtest thoroughly and use appropriate risk management.

CDC Action Zone V.2 strategy — Updated v6Making a profit with a candlestick structure compared to the MA course 25 line with nine intersecting to find. Buy in the market.

Retracement Strategy [OmegaTools]Retracement Strategy is a systematic trend–retracement framework designed to identify directional opportunities after a confirmed momentum shift, and to manage exits using either trend reversals or overextension conditions. It is built around a smoothed RSI regime filter and a simple, price-based retracement trigger, making it applicable across a wide range of markets and timeframes while remaining transparent and easy to interpret.
The strategy begins by defining the underlying trend through a two-stage RSI signal. A standard RSI is computed over the user-defined Length input, then smoothed with a short moving average to reduce noise. Two symmetric thresholds are derived from the Threshold parameter: an upper band at 100 minus the threshold and a lower band at the threshold itself. When the smoothed RSI crosses above the upper band, the environment is classified as bullish and the internal trend state is set to uptrend. When the smoothed RSI crosses below the lower band, the environment is classified as bearish and the trend state becomes downtrend. When RSI moves back into the central zone between the two bands, the trend is considered neutral. In addition to the current trend, the strategy tracks the last non-neutral trend direction, which is used to detect genuine trend changes rather than transient oscillations.
Once a trend is established, the strategy looks for retracement entries in the direction of that trend. For long setups in an uptrend, it computes the lowest low over the previous Length minus one bars, excluding the current bar. A long signal is generated when price dips below this recent low while the trend state remains bullish. Symmetrically, for short setups in a downtrend, it computes the highest high over the previous Length minus one bars and enters short when price spikes above this recent high while the trend state remains bearish. This logic is designed to capture pullbacks against the prevailing RSI-defined trend, entering when the market tests or slightly violates recent extremes, rather than chasing breakouts. The candles are visually coloured to reflect the detected trend, highlighting bullish and bearish environments while keeping neutral phases distinguishable on the chart. An ATR-based measure is used solely to position the “UP” and “DN” labels on the chart for clearer visualisation of entry points; it does not directly influence position sizing or stop calculation in this implementation.
Take profit and stop loss behaviour are fully parameterized through the “Take Profit” and “Stop Loss” inputs, each offering three modes: None, Trend Change and Extension. When “Trend Change” is selected for the take profit, the strategy will only exit profitable positions when a confirmed trend reversal occurs. For a long position, this means that the strategy will close the trade when the trend state flips from uptrend to downtrend, and the last recorded trend direction validates that this is a genuine reversal rather than a neutral fluctuation; the same logic applies symmetrically for short positions. When “Extension” is selected as the take profit mode, the strategy closes profitable long trades when the smoothed RSI reaches or exceeds the upper threshold, interpreted as an overbought extension within the bullish regime, and closes profitable short trades when the smoothed RSI falls to or below the lower threshold, interpreted as an oversold extension within the bearish regime. When “None” is chosen, the strategy does not apply any explicit take profit logic, leaving trades to be managed by the stop loss settings or by user discretion in backtesting.
The stop loss parameter works in a parallel way. With “Trend Change” selected as stop loss, any open long position is closed when the trend flips from uptrend to downtrend, regardless of whether the trade is currently in profit or loss, and any open short is closed when the trend flips from downtrend to uptrend. This turns the RSI trend regime into a hard invalidation rule: once the underlying momentum structure reverses, the position is exited. With “Extension” selected for stop loss, long positions are closed when RSI falls back below the upper band and moves towards the opposite side of the range, while short positions are closed when RSI rises above the lower band and moves towards the upper side. In practice, this acts as a dynamic exit based on the oscillator moving out of a favourable context for the existing trade. Selecting “None” for stop loss disables these automatic exits, leaving only the take profit logic, if any, to manage the position. Because take profit and stop loss configuration are independent, the user can construct different profiles, such as pure trend-change exits on both sides, pure overextension exits, or a mix (for example, take profit on overextension and stop loss on trend reversal).
This strategy is designed as an analytical and backtesting framework rather than a finished plug-and-play trading system. It does not include position sizing, risk-per-trade controls, multi-timeframe confirmation, volatility filters or instrument-specific fine-tuning. Its primary purpose is to provide a clear, rule-based structure for testing retracement logic within RSI-defined trends, and to allow users to explore how different exit regimes (trend-change based versus extension based) affect performance on their instruments and timeframes of interest.
Nothing in this script or its description should be interpreted as financial advice, investment recommendation or solicitation to buy or sell any financial instrument. Past performance on backtests does not guarantee future results. The behaviour of this strategy can vary significantly across symbols, timeframes and market conditions, and correlations, volatility and liquidity can change without warning. Before considering any live application, users should thoroughly backtest and forward test the strategy on their own data, adjust parameters to their risk profile and instrument characteristics, and integrate proper money management and trade management rules. Use of this script is entirely at the user’s own risk.

NIFTY Options Breakout StrategyThis strategy trades NIFTY 50 Options (CALL & PUT) using 5-minute breakout logic, strict trend filters, expiry-based symbol validation, and a dynamic trailing-profit engine.
1️⃣ Entry Logic
Only trades NIFTY 50 options, filtered automatically by symbol.
Trades only between 10:00 AM – 2:15 PM (5m bars).
Breakout trigger:
Price enters the buy breakout zone (high of last boxLookback bars ± buffer).
Trend filter:
Price must be above EMA50 or EMA200,
AND EMA50 ≥ EMA100 (to avoid weak conditions).
Optional strengthening:
EMA20>EMA50 OR EMA50>EMA100 recent cross can be enforced.
Higher-timeframe trend check:
EMA50 > EMA200 (bullish regime only).
Start trading options only after expiry–2 months (auto-parsed).
2️⃣ One Trade Per Day
Maximum 1 long trade per day.
No shorting (long-only strategy).
3️⃣ Risk Management — SL, TP & Trailing
Includes three types of exits:
🔹 A) Hard SL/TP
Hard Stop-Loss: -15%
Hard Take-Profit: +40%
🔹 B) Step-Ladder Trailing Profit
As the option price rises, trailing activates:
Max Profit Reached Exit Trigger When Falls To
≥ 35% ≤ 30%
≥ 30% ≤ 25%
≥ 25% ≤ 20%
≥ 20% ≤ 15%
≥ 15% ≤ 10%
≥ 5% ≤ 0%
🔹 C) Loss-Recovery Exit
If loss reaches –10% but then recovers to 0%, exit at breakeven.
4️⃣ Trend-Reversal Exit
If price closes below 5m EMA50, the long is exited instantly.
5️⃣ Optional Intraday Exit
EOD square-off at 3:15 PM.
6️⃣ Alerts for Automation
The strategy provides alerts for:
BUY entry
TP/SL/Trailing exit
EMA50 reversal exit
EOD exit
