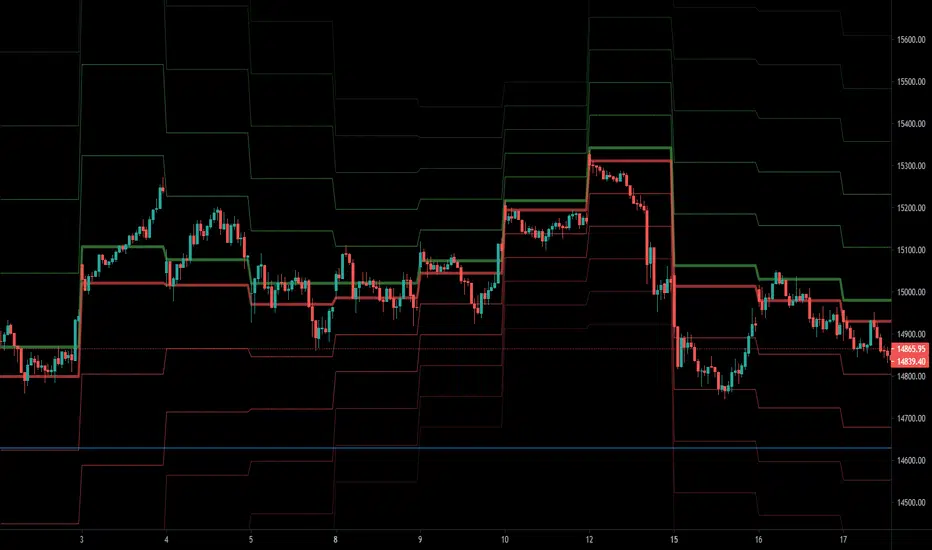
Auto Fib ZonesAuto Fib Zones is a extension of the ABC finder script that I released. It uses the pivot point system I developed in the ABC finder to identify major or significant trending moves in the market.
It will then draw the fibzones for the trend line. The fib zone will auto update for as long as the trend line continues (size will keep increasing).
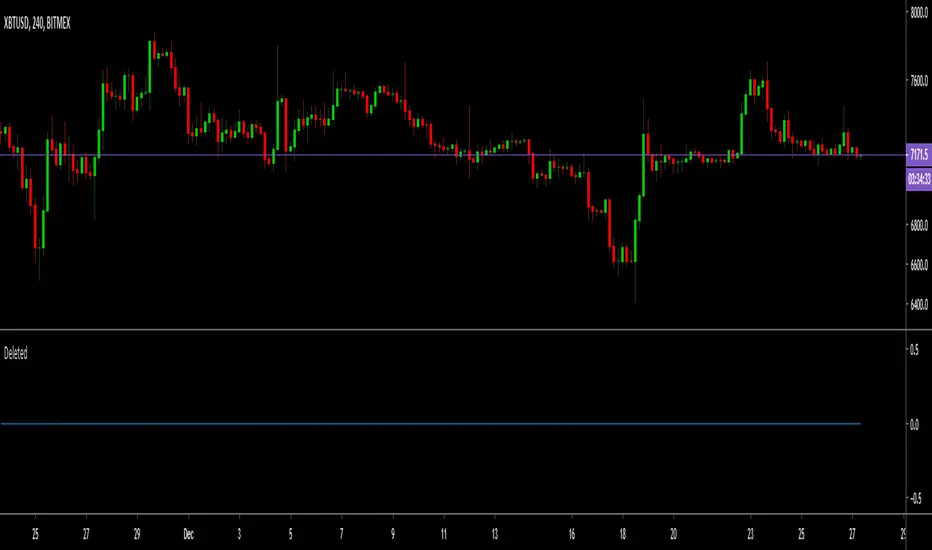
The zones will continue to extend to the right along with price until it is tested. The start of the green teal zone is the 0.618 and fills to the 0.786 and the Blue zone is the 0.786 and fills to the trend start or 1 value of the fib.
You can adjust the Bars Back variable to require more or less candles to create/ validate a new trend. In the screen shot about it is set to 50 bars however I've seen good results on higher timeframes like 4h + with 15 bars as the setting.
This is basically ITC's Optimal Trade Entry concept at least that is what the original inspiration for modifying my base script was.
As always hope it helps. God bless
Cari dalam skrip untuk "zone"

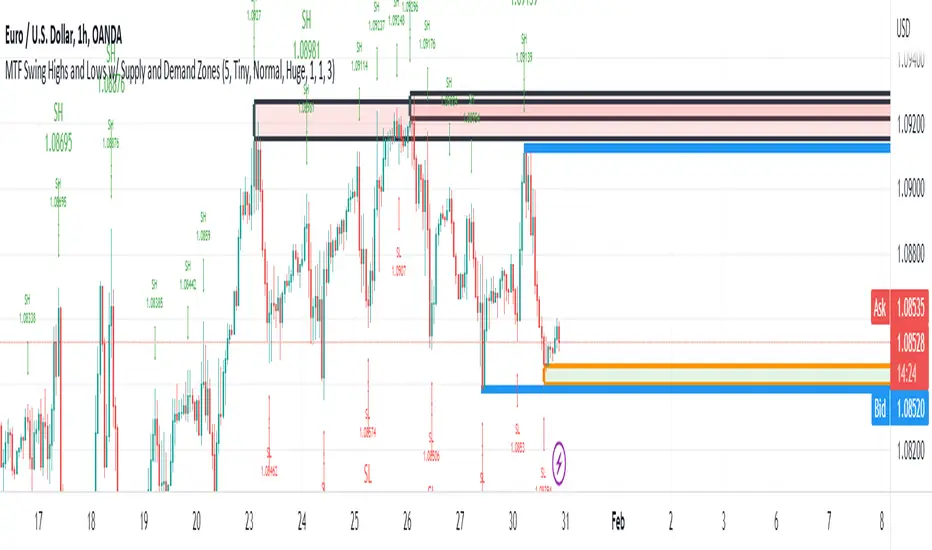
MTF Swing Highs and Lows w/ Supply and Demand ZonesI designed this indicator out of necessity for the Market structure/Price action trading strategy I use.
I thought I'd share. :)
For the fans of my Multi Timeframe Swing High and Low indicator, I have added Supply and Demand Zones!
The Supply and Demand Zones are based on the Swing Highs and Lows of my MTF Swing Highs and Lows Indicator.
The S/D Zones are created on the wicks of the Swing Highs and Lows.
You can choose whether to display the Chart, Higher and/or Highest timeframes as in the chart below.
You can also choose to display up to 3 S/D Zones from the past 3 Swing Highs and Lows.
The default setting is to display 1 chart timeframe S/D Zone, 2 higher and 3 highest, as I found this to be most effective without
cluttering the screen too much
The Chart Timeframe S/D Zones have an orange border, higher timeframe have a blue border and the highest have a black border.
Supply zones based on Swing Highs are red and Demand Zones based on Swing Lows are green.
This indicator displays Swing Highs and Lows on 3 timeframes based on the Chart timeframe, as follows:
Chart TF Higher TF Highest TF
1m 5m 15m
5m 15m 60m
15m 60m 240m
60m 240m Daily
240m Daily Weekly
Daily Weekly Monthly
You can change the font size of the labels as you'd prefer.
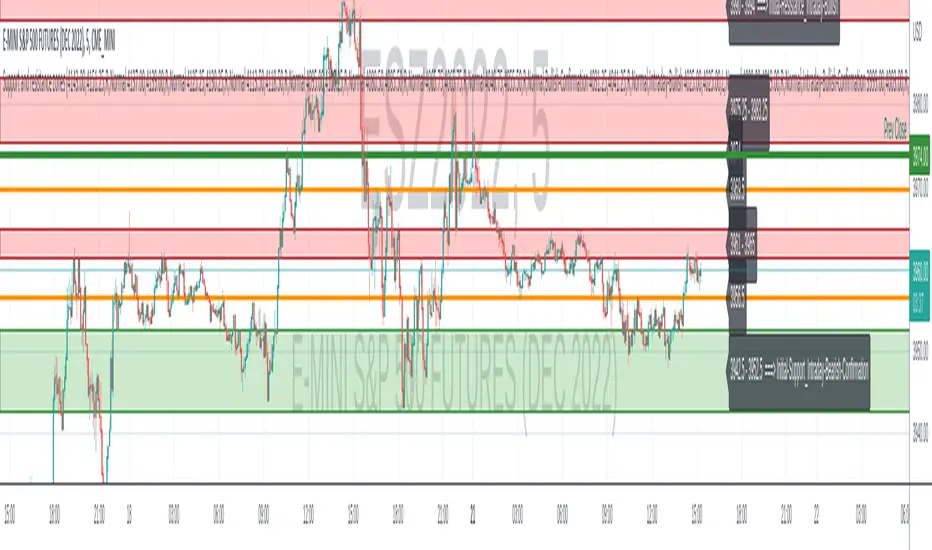
Support and resistance zonesDiscretionary traders often use support and resistance zones that are based on past price action of the instrument traded.
This simple script is used to plot support and resistance zones for a given instrument. The data for the zones themselves has to be determined by the past price action of the instrument and are not based on the provided data by Tradingview.
The zones input has to come as a string. Each zone consists of a string with: ",,<"S"|"R"|"L">,<"Normal"|"Strong">"" The different zone strings have to be seperated by either new line or space.
An example for the zones input looks like:
3919.25,3919.25,L,Normal
3897.50,3906.50,R,Normal
3891.00,3894.50,S,Strong
I appreciate any feedback.
Fibonacci Zone Study w/Candles - R3c0nTraderCredits:
Thank you "eykpunter" for granting me permission to use "Fibonacci Zones" to create this study
What does this do? How is it different?
This study was created so it can be used with the strategy 'Fibonacci Zone DCA Strategy - R3c0nTrader' in order to generate buy/sell signals for a 3Commas bot.
I was not able to use "eykpunter's" "Fibonacci Zones" to create these signals as it was missing the code for this. To create the buy or sell signal you need to be able to create an alert for when the price moves through the Fib levels. Unfortunately, the "price" is not available to be selected when creating an alert with the original study. Hence the need to create this new study and to resolve the issue.
This study has overlay turned off by default so it will appear in a separate pane below your active chart. I did this so I can clearly view and separate the strategy from the study.
Steps Overview:
Add the study to your chart
Configure the study to match the Fib length you used in the strategy.
Create Alerts from the study to generate the buy or sell signals to 3Commas
The below steps for creating signals are just examples! Since there are numerous ways you can open or close a trade from a signal, please do your own testing. This cannot be understated.
Example of how to generate buy signals:
After adding the study, select the three dots for this study and click on "Add an alert on Fibonacci Zone Study /w Candles…"
Setup the condition to trigger the alert. If you want to initiate a buy when the price crosses over the top of the lower Fib zone (downtrend zone), then use the following:
Condition>Fibonacci Zone Study>Price High>Crossing Up>Fibonacci Zone Study>Top-Low Fib Border
Options>Once per bar
Expiration>Open-ended
Alert actions>Webhook URL (use the 3Commas webhook URL)
Alert name>Enter a name, "BUY Paper-Fib-Bot"
Message>Use the 3Commas message from the paper bot to open the trade
Example of how to generate sell signals:
After adding the study, select the three dots for this study and click on "Add an alert on Fibonacci Zone Study /w Candles…"
Setup the condition to trigger the alert. If you want to initiate a sell when the price reaches the top of the High Fib zone (uptrend zone), then try the following:
Condition>Fibonacci Zone Study>Price High>Crossing Up>Fibonacci Zone Study>Top-High Fib Border
(Note: I used "Crossing Up" but "Crossing" is another option; I just haven't tested it yet with a paper bot)
Options>Once per bar
Expiration>Open-ended
Alert actions>Webhook URL (use the 3Commas webhook URL)
Alert name>Enter a name, "SELL Paper-Fib-Bot"
Message>Use the 3Commas message from the paper bot to close the trade

JMF_Vwap BLVD w/Dual lookback and Map Zones. This study identifies on the your top 3 highest volume candles and launches independent vwaps from each of those bars within the users given lookback, As well as static closing vwap values of the candle.
User has a "Calendar lookback" input that you can search a number of CALENDAR days back for highest volume bars. On the daily chart this will identify your highest volume DAYS.
On an intraday chart it will identify your highest volume BARS. example= on a 5 min chart, with a calendar look back of "5 days" the BLVD indicator will search back 5 days on the 5min chart and look for the top 3 highest volume CANDLES, and launch continuous and static vwaps from them. Continuous is a vwap that is launched and gives the cumulative average price from launch until a new Top 3 high volume bar is formed, then the vwaps will sequentially re-order themselves in order of highest to lowest volume.
Static Vwaps are the CLOSING vwap value of the launch candle. These levels act as strong support and resistance when launched from the highest volume candles. They represent participants whom have bought or sold that candle, and have yet to average in our out of a position, "buy and hold", or "Bag holders". These levels usually experience a high degree of sell pressure as they are encountered from underneath, vice versa, they can act as strong support when launched from lows, or on the first few encounters of the level when price is coming down to them.
The best way to use and identify relevant Vwap BLVDs is on a split screen chart, a intraday time frame with a short and mid look back, and a longer 4hour or daily chart with a mid to long lookback side by side showing immediate and long term liquidity levels. In route to the daily BLVD levels which hold your highest levels of liquidity/volume you ultimately run into shorter time framed BLVDs that have been launched from smaller time frame candles intraday at high volume events, these levels are massively important for intraday trading and can stop price dead in its tracks, not JUST the daily vwap BLVD value.
That is why this version has a short, and a long term look back, each lookback is accompanied with Standard deviation bands that are color coded and labeled for quick ID. User can turn on or off if they choose.
You can launch a short look back (2-5 day) and use the deviation bands in the same manner as you would the intraday vwap deviation bands and take any of our 4 trade types in the same manner as intraday vwap.
ALSO, you can set it for 2days back and have a previous day vwap BLVD and see the controlling liquidity from the previous days range, or where the "most" participants average price is. You will get vwaps Launching from the most relevant, highest volume bars within the last 48 hours, or do 7 days back for a weekly BLVD, this will show who and where is in control on the weeks range. These two lookbacks are often the most useful for intraday scalping while also targeting the longer range overhead volume on the higher time frame " Daily BLVD ".
This is a User intensive study as far as settings go, I encourage everyone to change settings calendar wise on all time frames to find what suits your style of trading and time frame the best, and to play with the remaining add on's to see what you like, or find value in, or what you dislike, and would want to keep off.
It also includes "Map zones", these are zones associated with the launch candles average price and range. I have witnessed the high and low of these ranges be respected over and over again intraday, User can turn the background cloud off in settings if they prefer or dim the color in settings.
ALL settings and plots can be turned down, adjusted, or turned off If the visual is to impactful for you, take the time to Turn off or change any of the additional features that are included. You can minimize the study all the way down to just one line with the Highest volume vwap BLVD if you prefer or you can have all of it on for a fully immersive experience.
User also has a table on chart that can be hidden that lists the vwaps price, and Candle launch volume. This volume metric comes in handy when approaching a vwap value for the FIRST TIME. after that the supply or demand is or has diminished, but its still good to know how much it launched with so you can compare current candle volume.
Enjoy-
JMF
Color coding=
Gold = highest volume vwap continuous and static.
Red = 2nd highest volume vwaps.
Purple = 3rd highest volume vwaps.
*** ALL USERS ASSUME ALL RESPONSIBILTIY WHILE USING THIS TOOL. THIS IS NOT, NOR SHOULD NOT BE MISCONSTRUED AS FINANCIAL ADVICE. USER ASSUMES ALL RISKS ASSOCIATED WITH THE USE OF THIS TOOL WHILE TRADING,AND FOR ANY AND ALL LOSS THAT MAY OCCUR WHILE USING SAID TOOL. TRADING IS RISKY AND USER COULD STAND TO LOSE ALL CAPITAL INVESTED.
Credit to @RumpyPumpyDumpy for the help on the original logic for Vwap BLVD. Without him this wouldn't have been possible on tradingview.

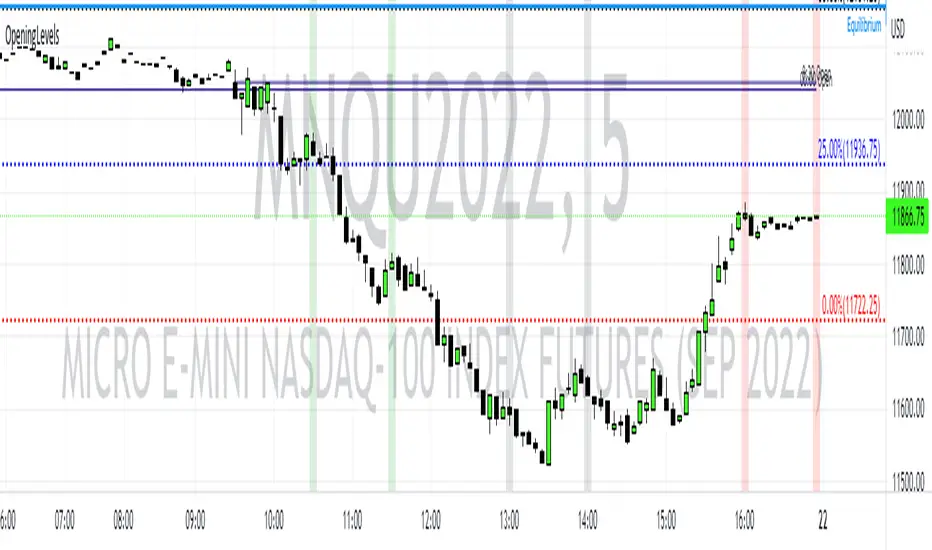
Opening Levels and ZonesThis indicator will show key weekly and daily opening levels including first and last hour trading zones. These will show NY Eastern Time zones only.
Rate Of Change and rsi zonesHi,
I played with the ROC ( Rate of change ) indicator.
First of all I made it smooth. And came up with decent buy sell signals for long-term potential trades. It can be useful for DCA and profit booking in market tops ( before potential crash)
Recommended time frame = 1 Daily , 3 Daily , Weekly.
Usage :
1. Look for Buy and sell arrow signals. But don't jump straight away. Specially for sell. You might sell early. Instead you can move up your stop loss when you see a sell signal or profit book partially.
if you wait and combine with your own supply and demand zones you can get some nice sell price.
2. Better to wait and look for a divergence in price and ROC. As price will slow down it will reflect on the ROC line. Which means market is exhausted and potentially a correction might happen.
3. You can draw trendline one the ROC and look for breakout. ( warning won't always work )
4. You can also see the RSI in thick red/green color. It will help you determine oversold and overbought zones. Trick is don't sell when it's oversold ( red thick line) . Because it might be a start of a strong uptrend.
So better is to wait and see when the signal is printing then execute.
Best strategy is to DCA and sell in parts whenever you see such signals.
I believe it will visually help us that when to be bull and when to be bear.
Anyway if you find it useful let me know in the comment.
Also if you have some idea to improve the code you can contribute as well.
Thanks . Feedbacks are welcome.

Support Resistance Zones using confluence & Std. DeviationOverview:
This indicator takes (interactive) input from the user for support and resistance levels and plots important zones considering the other confluence levels in the indicator.
Working of indicator:
This indicator takes six input of Support/resistance level form the user
It has following 32 confluence levels
a.4 Recent positive Divergence levels (DN1, DN2, DN3, DN4)
b.4 recent negative divergence levels (DP1, DP2, DP3, DP4)
d.5 Fibonacci levels (Fib0, Fib236, Fib5, Fib618, Fib786)
e. 7 Pivot levels (P, PR1, PR2, PR3, PS1, PS2, PS3)
f.4 EMAs (E20, E200, E100, E50)
g. ATH, ATL, Weekly High, Weekly Low, two days ago high, two days ago low, previous day high , previous day low
The code checks nearest ‘n’ CONFLUENCE for each level (“Number of confluences to check”) in the indicator, after getting the nearest confluence it calculates the standard deviation of those levels WITH RESPECT TO THE MANUAL INPUT LEVELS.
If the Std. Deviation is less than the input value (“Minimum standard deviation” option) then the zone is displayed on the chart.
How to use:
Add the indicator on the chart select your important support and resistance levels.
Set standard deviation, if the confluence is less than the input standard deviation then you will see those zones on the chart.
You can display all divergence levels; you can display all fib levels. All confluences can be displayed by using the setting of the indicator
How to read the indicator values:
The zone will show all the confluence it has in its zone,
Example:
Table details:
The table shows the maximum and minimum deviation out of all six levels .To see at least one zone you have to make sure that Input value Std. Deviation must be greater than Min Std. Deviation of the table
Sources & refences :
Big thank to www.pinecoders.com and kodify.net
Standard deviation :
www.investopedia.com
function to find 'k' closest elements :
www.techiedelight.com
Interactive support resistance :
Divergence for many indicators:
Auto fib level by DGT:
www.tradingview.com

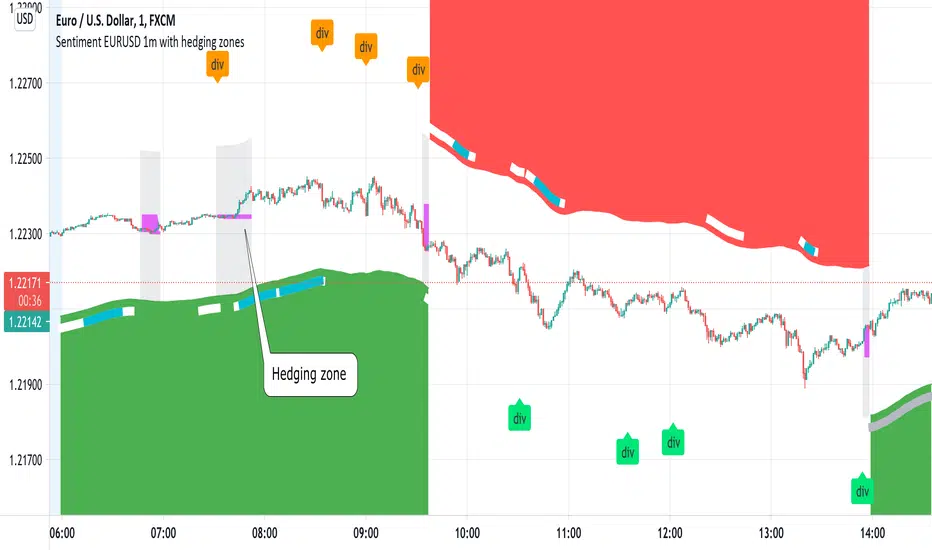
Sentiment EURUSD 1m with hedging zonesThis is a very specialised and optimized script, for 1m EURUSD traders - daytraders, scalpers.
1m trading is very difficult, but it can be also most profitable, if done right.
Why difficult? It is hard to detect market direction - usually when trend indicators reverse, that new trend is already over. One and the same indicator signal sometimes provides one outcome (for example reversal) and sometimes exactly the opposite (continuation). It requires deep understanding on WHEN to use which indicator and when to ignore signals. Set the parameters of your indicators to a very sensitive extent and they will keep changing direction back and forth - always being too late of course :) Set the parameters too losely, and you'll be late with entries 100% of times. Looking for universal trend-showing indicator? There is none...
This script is a result of 2 years of practical following EURUSD 1m market action. Looking at charts with MANUAL TRADER'S eyes. Analyzing all together: price action, indicators, zigzag, divergences, momentum, pivot points, support and resistance. On the one hand traders say only manual trading can be successful and on the other - to stick to one strategy and be automatic when applying to it. So this is it - automatic coding of market signals as if manual trader would do it. Forex is news-driven? Yes, it is. So if market sentiment changes because of some news happening, the script will quickly recognize it and suggest reversal.
Please note I'm not pretending to have a crystal ball. Nobody has. The goal of this script is not to predict where EURUSD market will be, but to correctly notice that is has reversed. Nothing else.
Sometimes the market will move towards reversal, but not cross the line yet - these are so-called HEDGING ZONES. Sometimes they turn out to be reversals and sometimes simply best places for dip entries. Ideally a trader should hedge there, because market could move either way. You might wanna apply apply knowledge of market fundamentals there or look into some micro-indicators. Anyway, it is good to realize where those zones are and this script shows them. In pink.
It is invite-only script. DM me for access.
Intraday Zones & Levels - Support & ResistanceI use this indicator to mark levels and mathematically categorize my 15mins chart into smaller trading zones. You can view these as Support and Resistance levels as well, however, the main function is to visually divide the chart on the basis of previous days' price movements.
- Levels are calculated based on the Average % Change per Day for the last 5 Days. Calculations use Daily open Value for the last 5 days & % Change using current open Value.
- Entry Levels ( Bullish and Bearish ) mathematically divide the charts into 2 zones and can be used to determine the nature of the stock movement during that day.
- Weekly and Yearly Open Prices are also plotted on the chart as reference levels.
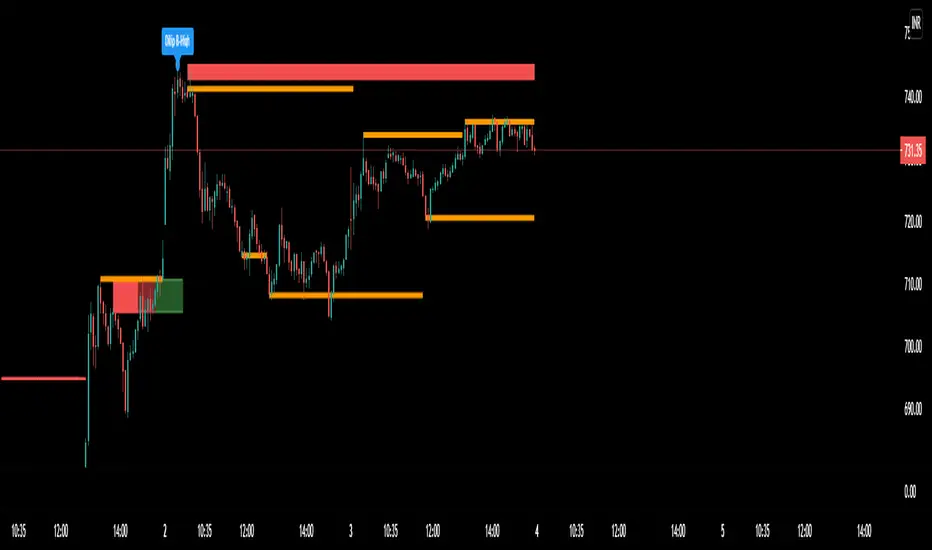
Dilip Zone'sThis indicator allows you to specify price zones in which to detect basic candlestick patterns.
In the example above, I have specified the most immediate support and resistance zones on Bank nifty and set the script to detect price action. If a price action occurs within the resistance zone a signal will be generated; likewise for price action within the support zone .
The purpose of this indicator is to generate trading alerts when these patterns occur in order to reduce the screen-time required to monitor setups. This indicator is intended for structure traders primarily, although it could be used by anyone who uses zones and candlestick patterns to enter trades.
If you leave either zone set to 0 then that zone will not be used, meaning that you can use this to detect both support and resistance signals, or only signals at support, or only signals at resistance.
Settings:
R1: First Resistance Price
R2: Second Resistance Price
S1: First Support Price
S2: Second Support Price
I find, with the standard settings, it works best on the 5 minutes timeframe as shown, but again, can be used on any time frame.
For access, send me a DM on TradingView
Dilip Zone's With Price Acton PredictorThis indicator allows you to specify price zones in which to detect basic candlestick patterns.
In the example above, I have specified the most immediate support and resistance zones on Bank nifty and set the script to detect price action. If a price action occurs within the resistance zone a signal will be generated; likewise for price action within the support zone .
The purpose of this indicator is to generate trading alerts when these patterns occur in order to reduce the screen-time required to monitor setups. This indicator is intended for structure traders primarily, although it could be used by anyone who uses zones and candlestick patterns to enter trades.
If you leave either zone set to 0 then that zone will not be used, meaning that you can use this to detect both support and resistance signals, or only signals at support, or only signals at resistance.
Settings:
R1: First Resistance Price
R2: Second Resistance Price
S1: First Support Price
S2: Second Support Price
acquires potential targets by measuring the Average Change of Price from a user-defined resolution, from Open to Open. By default, the Resolution is set to 1 Day, however you can play around with Weekly, Monthly, etc. When a new resolution period begins, Dilip Zone's With Price Acton Predictor will automatically adjust based on the new Average Change of Price.
Due to the avoidance of Security() in this script, you may have to play around with the Timeframe that you use it in to ensure that you have enough bars on your chart to process the User-Defined Resolution.
Trade Manager(Given that you set the Target Multiple and Default Threshold Inputs as the same in each script), and is the most likely to be hit before the end of the resolution period.
I find, with the standard settings, it works best on the 5 minutes timeframe as shown, but again, can be used on any time frame.
For access, send me a DM on TradingView

Dilip Zone'sThis indicator allows you to specify price zones in which to detect basic candlestick patterns.
In the example above, I have specified the most immediate support and resistance zones on Bank nifty and set the script to detect price action. If a price action occurs within the resistance zone a signal will be generated; likewise for price action within the support zone .
The purpose of this indicator is to generate trading alerts when these patterns occur in order to reduce the screen-time required to monitor setups. This indicator is intended for structure traders primarily, although it could be used by anyone who uses zones and candlestick patterns to enter trades.
If you leave either zone set to 0 then that zone will not be used, meaning that you can use this to detect both support and resistance signals, or only signals at support, or only signals at resistance.
Settings:
R1: First Resistance Price
R2: Second Resistance Price
S1: First Support Price
S2: Second Support Price
I find, with the standard settings, it works best on the 5 minutes timeframe as shown, but again, can be used on any time frame.
For access, send me a DM on TradingView

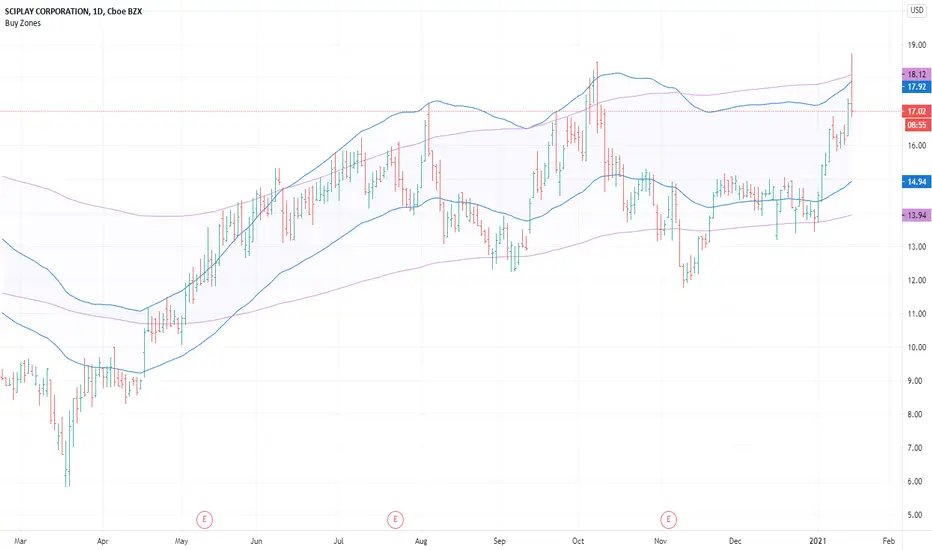
Buy ZonesBuy Zones help you visually see price and the percentage distance it is trading above moving averages.
The Buy Zones are completely customizable, but come preset to specific levels.
The first zone is preset to be 20% above a 50-day exponential moving average .
The second zone is preset to be 30% above a 200-day exponential moving average .
By visually seeing these zones on the chart, they could help avoid taking trades when prices are extended from consolidation areas.
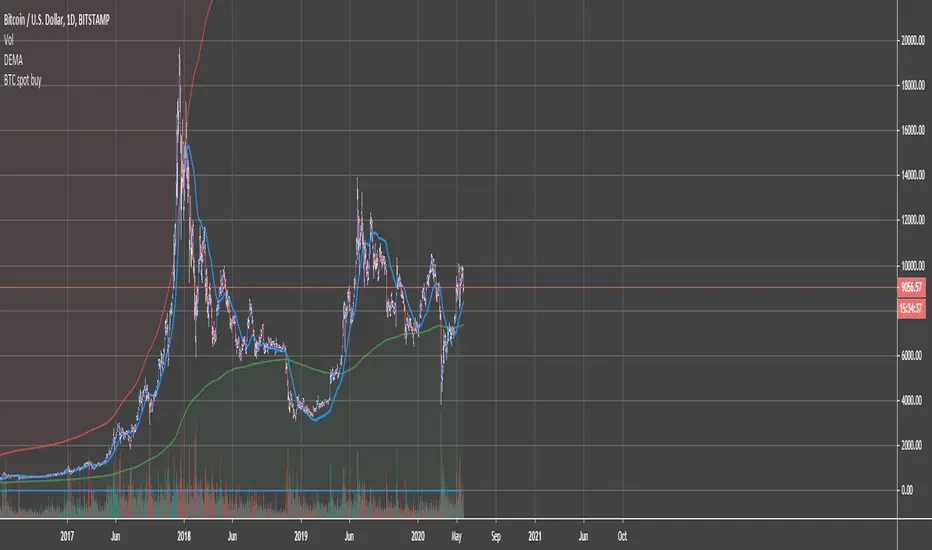
BTC Accumulation/Distribution ZonesAccumulate, when the price is in the green zone and distribute in the red zone. Use it on Bitcoin/Usd Bitstamp or Bitfinex preferably.
Right-click on the Y-axis and select "Scale to Price only" so the indicator doesn't mess up your scale. Enjoy!
Hashem Extended StochasticExtended Stochastic with All Zones.
From Neutral to Danger Zones.
The Most Complete and Extended Stochastic Indicator.
RSI ZonesThis is a combination of a couple ideas I saw on here. The result is from three configurable EMA smoothed RSI overbought/oversold zones. The default is set to Donchian Channel mode where the highs/lows of the RSI's are plotted. An optional basis line derived from the slowest RSI is also included. Toggling this mode off gives you different results.
You'll want to play with different lengths for your own preferences and to see what works best for you.
Being able to see price bounce between these zones should hopefully give you some ideas on how you could potentially use this.
Credit to LazyBear for the initial idea.
KIMATIX S|R Zones Intra-SwingKIMATIX S|R Zones Intra-Swing is a higher-timeframe support–resistance engine designed to map the most important swing levels for intraday and swing traders.
The script scans Daily and 4H price action, detects wick-based swing highs and lows,
and converts them into clean S/R zones that project into the future.
Zones are color-coded by timeframe and by role (support or resistance),
giving you an instant visual map of where price is most likely to react.
When price breaks cleanly through a zone,
it dynamically flips (resistance → support or support → resistance),
so your levels always reflect the current market structure.
To avoid clutter, only the closest zones around current price are displayed – ideal for planning entries, targets, and stop placement.
Use it as a higher-timeframe roadmap and combine it with your intraday execution system for precise, high-confluence trades.

Bitcoin Power Law Zones (Dunk)Introduction When viewed on a standard linear chart, Bitcoin’s long-term price action can appear chaotic and exponential. However, when analyzed through the lens of physics and network growth models, a distinct structure emerges.
This indicator implements the Bitcoin Power Law , a mathematical model that suggests Bitcoin’s price evolves in a straight line when plotted against time on a "log-log" scale. By calculating parallel bands around this regression line, we create a "Rainbow" of valuation zones that help investors visualize whether the asset is historically overheated, undervalued, or sitting at fair value.
The Math Behind the Model The Power Law dictates that price scales with time according to the formula: Price = A * (days since genesis)^b
This script uses the specific parameters popularized by recent physics-based analyses of the network: Slope (b): 5.78 (Representing the scaling law of the network adoption). Amplitude (A): 1.45 x 10^-17 (The intercept coefficient).
While simple moving averages react to price, this model is predictive based on time and network growth physics, providing a long-term "gravity" center for the asset.
Guide to the Valuation Zones
Upper Bands (Red/Orange): Extr. Overvalued, High Premium, Overvalued. Historically, these zones have marked cycle peaks where price moved too far, too fast ahead of the network's steady growth. The Baseline (Black Line): Fair Value. The mathematical mean of the Power Law. Price has historically oscillated around this line, treating it as a center of gravity. Lower Bands (Green/Blue): Undervalued, Discount, Deep Discount. These zones represent periods where the market price has historically lagged behind the network's intrinsic value, often marking accumulation phases.
Note: The lowest theoretical tiers ("Bitcoin Dead") have been trimmed from this chart to focus on relevant historical support levels.
How to Use Logarithmic Scale: You MUST set your chart to "Log" scale (bottom right of the TradingView window) for this indicator to function correctly. On a linear chart, the bands will appear to curve upwards aggressively; on a Log chart, they will appear as smooth, parallel channels. Timeframe: This is a macro-economic indicator. It is best viewed on Daily or Weekly timeframes. Overlay Labels: The indicator includes dynamic labels on the right-side axis, allowing you to instantly see the current price requirements for each valuation zone without manually tracing lines.
Credits This script is based on the Power Law theory popularized by Giovanni Santostasi and the original Corridor concepts by Harold Christopher Burger .
Disclaimer This tool is for educational and informational purposes only. It visualizes historical mathematical trends and does not constitute financial advice. Past performance of a model is not indicative of future results.
Further Reading
www.hcburger.com
giovannisantostasi.medium.com

Weekly Future and ZoneDescription
🔹This multi-tool indicator plots Best-Strike–based R/S levels, BEP zones, Panic zones, Synthetic Future High/Low, Previous Day OHLC, Daily Open, CPR (Daily/Weekly), and key EMAs.
Designed for option writers, index traders, and intraday traders who want all major reference levels in one place.
🔹Includes toggles for every module, auto-cleaned drawing objects, CPR box shading, customizable MAs, and optimized last-bar rendering.
Best Strike : CE/PE Close price which is near.
Need Input CE/PE High, Low, Close Price
💡 Key Features:
Best-strike derived R1, R2, S1, S2
BEP (Break-even) Levels
Panic Zones for directional risk
Synthetic Future High/Low using CE/PE premium imbalance
Previous Day OHLC for intraday structure mapping
Daily Session Open
CPR (Daily/Weekly) + automatic CPR zone shading
EMA Trend Pack + customizable SMA/EMA/WMA/VWMA
⚠️ Disclaimer
This indicator is provided for educational and analytical purposes only.
It does not provide trading advice or buy/sell signals.
Use responsibly and in conjunction with your market analysis.
