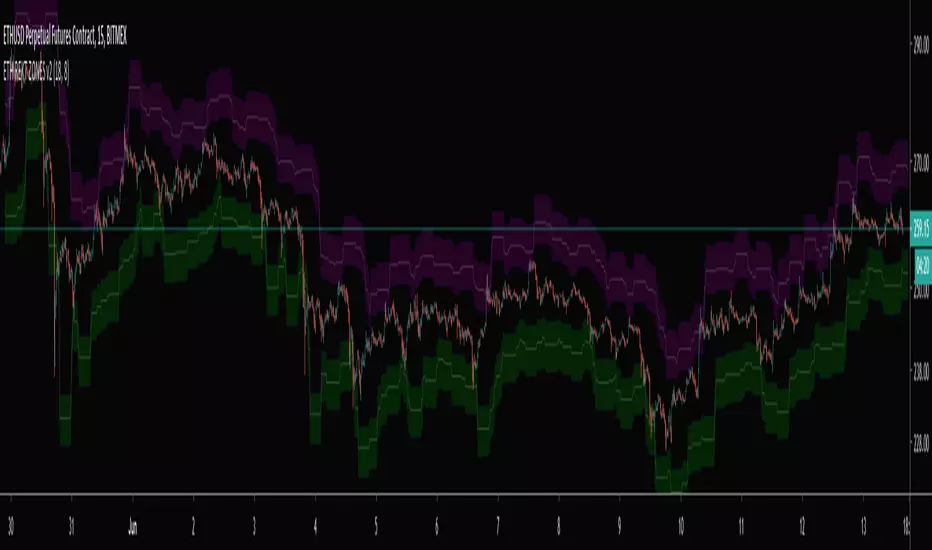
Reversion Zone IndexThe Reversion Zone Index (RZI) is an indicator that combines the Commodity Channel Index (CCI), Choppiness Index (CI), and Bollinger Bands Percentage (BBPct) to identify mean reversion signals in the market. It is plotted as an Exponential Moving Average (EMA) smoothed oscillator with overbought and oversold zones, and mean reversion signals are represented by red and green arrows.
The three indicators are combined to benefit from their complementary aspects and create a more comprehensive view of mean reversion conditions. Here's a brief overview of each indicator's benefits:
1. Commodity Channel Index (CCI): CCI measures the current price level relative to its average over a specified period. It helps identify overbought and oversold conditions, as well as potential trend retracements. By incorporating CCI, the RZI gains insights into momentum and potential turning points.
2. Choppiness Index (CI): CI quantifies the market's choppiness or trendiness by analyzing the range between the highest high and lowest low over a specific period. It indicates whether the market is in a trending or ranging phase. CI provides valuable information about the market state, which can be useful in mean reversion analysis.
3. Bollinger Bands Percentage (BBPct): BBPct measures the current price's position relative to the Bollinger Bands. It calculates the percentage difference between the current price and the bands, identifying potential overbought or oversold conditions. BBPct helps gauge the market's deviation from its typical behavior and highlights potential reversal opportunities.
The RZI combines the three indicators by taking an average of their values and applying further calculations. It smooths the combined oscillator using an EMA to reduce noise and enhance the visibility of the trends. Smoothing with EMA provides a more responsive representation of the overall trend and helps filter out short-term fluctuations.
The overbought and oversold zones are marked on the chart as reference levels. When the combined oscillator is above the overbought zone or below the oversold zone, it suggests a potential mean reversion signal. Red and green arrows are displayed to visually indicate these mean retracement signals.
The RZI is a valuable tool for identifying mean reversion opportunities in the market. It incorporates multiple indicators, each providing unique insights into different aspects of mean reversion, such as momentum, volatility, and price positioning. Traders can use this indicator to spot potential turning points and time their trades accordingly.
Cari dalam skrip untuk "zone"

Jerry J8 MACD Optimal Entry Zone---- STRATEGY
This MACD indicator includes an optimal entry zone for entering your trades and works with any symbol in any time frame. The optimal entry zone is defined by user controlled inputs for up to 10 symbols and is pre-loaded with the SPY, IWM, QQQ, NDX, and TESLA for the 3 minute time frame. Additionally, you can add up to 5 more symbols and adjust the optimal entry zones for each signal.
The optimal entry zone is the range above and below the MACD zero line where the highest probability trades can be entered. Too far above or below the zero line and the move is more likely to be exhausted or premature. This is not an exact science and you will want to set the zone for each symbol on the chart time frame you trade.
The reason this indicator is so helpful is because the optimal entry zone changes for every symbol and for every time frame and this indicator automatically shows these zones for up to 10 stock symbols.
---- SETUP & HINTS
There are times when the MACD may be outside of the optimal range but due to other factors (for example, high volume or market moving news) I would choose to enter a trade.
Indicators are not a magic pill and should be used to support trading decisions, not to make them for you. Past performance is not a guarantee of future returns. The results of individual stocks/indexes with any strategy do not constitute proof they will repeat in the future.
DISCLAIMER: The information contained in our scripts/indicators/ideas does not constitute financial advice or a solicitation to buy or sell any securities of any type. Trading and investing in the stock market and cryptocurrencies involves substantial risk of loss and is not suitable for every investor. I’m NOT a financial adviser. All trading strategies are used at your own risk.
Please use the AUTHOR’s INSTRUCTIONS link below for more information.

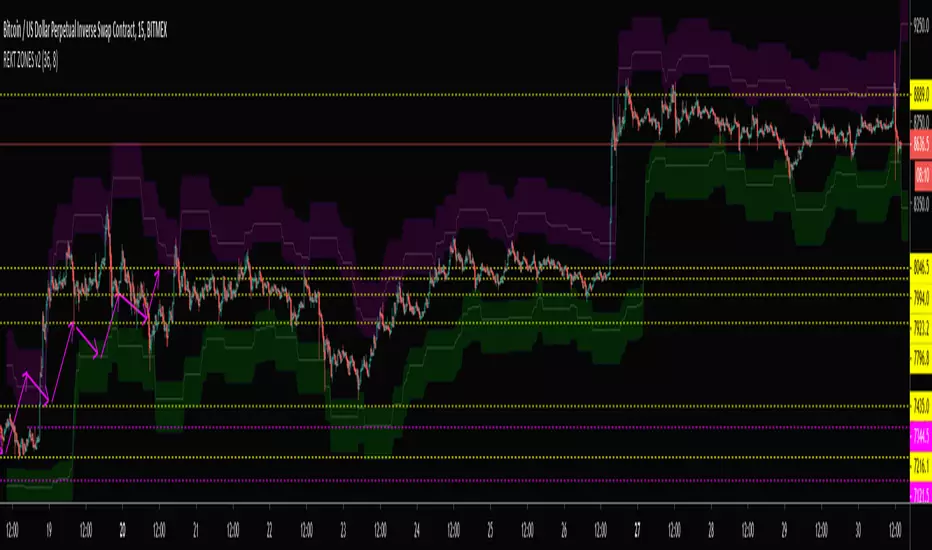
Investing ZonesInvesting Zones indicator shows the areas where LONGS or SHORTS can be made, the areas are calculated based on the mathematical averages of the high and low peaks of the price.
-There is an area called "No trading Zone" where the price is too slow, It also has a Alma Trend Ribbon (blue for uptrend, pink for downtrend) that helps to make trading decisions.
-You can make shorts when the price enters the Yellow zone called the "Sell Zone" and the price is below the Alma trend, set the TP1 in the white dotted line, and TP2 in the white lower line
-You can make longs when the price enters the Green zone called the "Buy Zone" and the price is above the Alma trend, set the TP1 in the yellow dotted line, and TP2 in the yellow upper line
-It works in all timeframes, personally I use it in 1min, 5min and 1hr.

Fibonacci Zones EMA Zones StrategyThis idea is only for fun and learning purposes only.
The strategy represents 2 simple math formulas that are very simple. the "Fibo Formula" and the "EMA Formula" Please see source code for reference
I Feel like coders can learn a lot about developing strategies using this source code
This is to show that there is unlimited amount of variables and factors to a strategy and its all about working with probability.
Also to show that unlimited amount of conditions could be added to a strategy.
And unlimited amount of variables/factors with the settings that could change the results.
Rules are simple
Entry on close, Close/Entry must be in the blue Fibo Zone
Blue Fibonacci zone fully customizable
Other Conditions could be added involving EMA zones, Over Ema1, Under Ema1 etc..
TP/SL and Dates Fully Customizable
This script is just an idea fully for learning purposes.

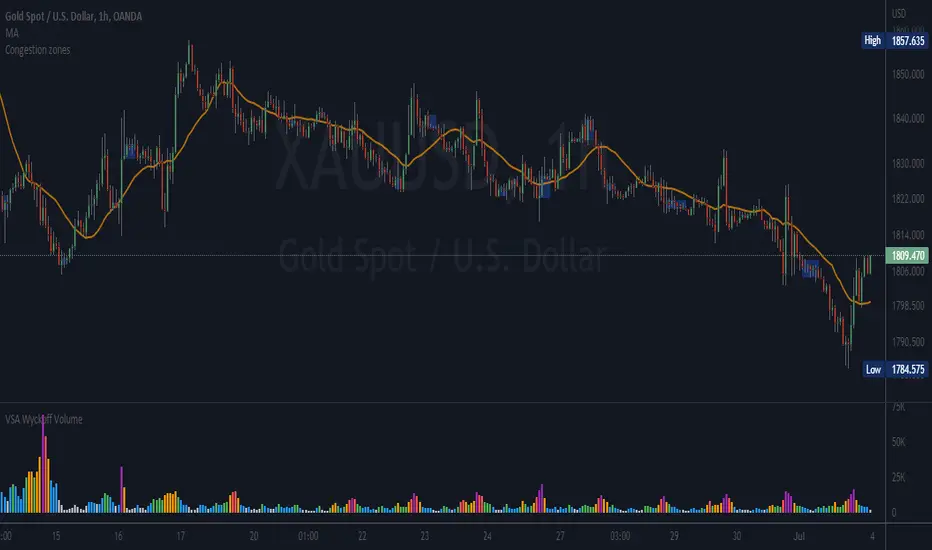
5kto1M - Congestion ZonesCongestion zone include at least 3 candle sticks that the next candle has an opening and closing price within the previous candle
When the price returns to the congested zone there is a possibility of a reversal
The congestion zone is used as a support-resistance area and is used by price action traders.
This script will highlight congestion zones, this will help PA Traders find out them easily.
You can configure the minimum number of candles
VWAP with 7EMA with ZonesThis is a script with 7 EMAs for every type of trades. This indicator also has the daily weekly and monthly zones. 20,50,100,200 EMAs being the best EMAs of all.
RSI with Divergences, Reverse Formulas, and Bull/Bear ZonesRegular RSI indicator that can underline divergences, turn green or red specifying user specified bull/bear zones, and with a label showing the price needed to turn bull/bear!
Specify the inputs:
+ RSI Length
+ Bull Threshold
+ Bear Threshold
+ Panel Position Offset
Also with toggle-able:
+ Bullish Divergence
+ Bearish Divergence
+ Hidden Bullish Divergence
+ Hidden Bearish Divergence
The zones included in the indicator are default and not meant to be used for all markets. The goal is to alter the bull/bear zones to find good breakout points and selloff points for your chosen security. Does not currently support automatic zone creation, or saving zones for each security (if that is even possible, may just need to create different layouts for each security).
Thanks!

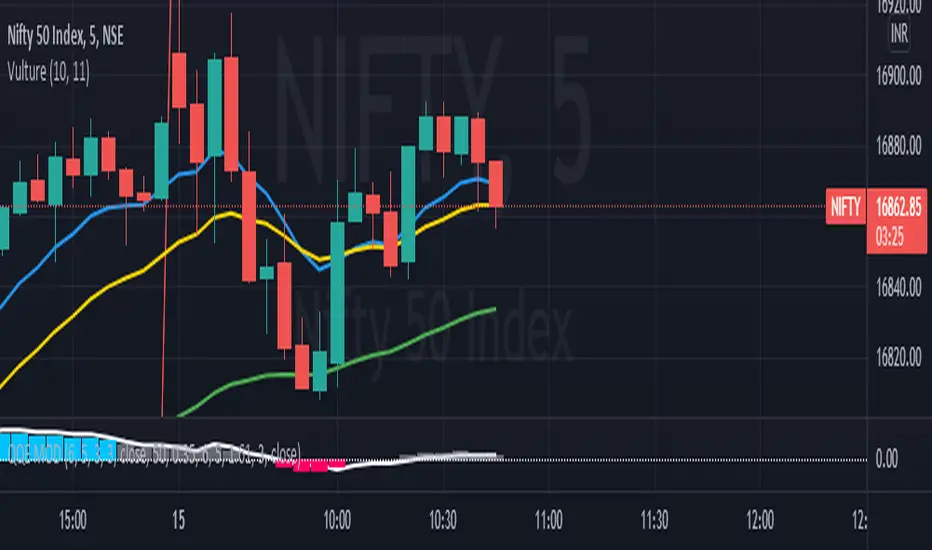
DD Nifty Zone MarkerDear Investor / Trader,
DD Nifty Zone Marker is a flag to identify the Supply and Demand zones.
I have coded the flag in such a way when there is an imbalance between the buyer and the seller, the flag is triggered.
There are 2 type of candle.
Equilibrium Candle (E-Candle):
They imply that transactions are happening in a range thus Buyer and Seller are in balance
Candle with Body Range <= 50% of Candle Range
Im-Balance Candle (IB-Candle):
They imply imbalance between Buyer and Seller thus price starts moving either up or down
Candle with Body Range > 50% of Candle Range
Demand Zone Formation (DZ):
Condition 1:
1. Reversal Pattern – RED IB Candle - > BLUE E Candle - > GREEN IB Candle
2. Continuous Pattern – GREEN IB Candle - > BLUE E Candle - > GREEN IB Candle
Condition 2:
The two candles immediately following the IB Candle must each make a new High. They do not have to make a Higher close, just Higher high. It can be an E Candle or IB Candle
Supply Zone Formation (SZ):
Condition 1:
1. Reversal Pattern – GREEN IB Candle - > BLUE E Candle - > RED IB Candle
2. Continuous Pattern – RED IB Candle - > BLUE E Candle - > RED IB Candle
Condition 2:
The two candles immediately following the IB Candle must each make a new Low. They do not have to make a lower close, just lower lows. It can be an E Candle or IB Candle.
Flag Name:
DZ - Demand Zone
SZ - Supply Zone
Suggested time frame:
Scalping trading - 1 Min or 3 Min
Intraday trading - 5 Min or 15 Min
Swing Trading - 1 Hr or 4 Hr
Positional Trading - 1 Day
Buy Opportunity:
Entry - When there is a formation of DZ flag in an up trend of the underlying.
Stop loss should be the low of the BLUE candle.
Sell Opportunity:
Entry - When there is a formation of SZ flag in a down trend of the underlying.
Stop loss should be the high of the BLUE candle.
High POP Setup:
One can take trades based on the flag when there is a correlation with Pivot , Camarilla , higher period MA.
Note: Trade only the pull back.

DMI & ST DEV zone intersection [LM]Hello Traders,
This indicator uses two indicators st dev extremes and DMI extremes and visualize intersection of both indicators extreme zones using crosses. It means where cross is rendered intersection of extremes has occurred.
The standard deviation uses the same calculation as my Standard deviation zones Support & Resistance indicator, DMI indicator measures both the strength and direction of a price movement. I am using both indicators to find the intersection of extreme zones between them.
ST DEV settings:
source
tops setting
bottom setting
DMI settings:
length settings
extreme zone setting
Enjoy,
Lukas

Kill Zone SessionsKill Zone Sessions
Kill Zone Sessions is an indicator that allows you to highlight customizable backgrounds for specified time zones. The problem with 99% of all session indicators on TradingView is that they only plot real-time, sure this is good when you look back on the charts with loaded data. Looks pretty I guess, but having it in real-time with no forward plotting abilities is useless. It provides a trader with no preparedness or edge to trade within that time frame.
The solution is to plot the next 24 hours in advanced of the current time, that way you will always see when the sessions are in relation to your current time.
This will highlight the time zone 24 hours in advance so you always know when the session are and can plan TA around that!
15m USDCHF
1m GBPUSD
5m BTCUSD

STC Price Action ZoneHow this works:
This Indicator looks to identify patterns which shows high movement area which may have occurred due to big orders at that time. It helps to Identify Price Action Zones where we may anticipate some reverse move. These Zones & Moves are helpful for Traders.
Buying Zone is below current Market Price. It indicates Price Action area where Buyers overpowered Sellers hence there was big Leg out Candle. This zone may again give buying momentum if Price comes back to that level. As a Trader one may take opportunity enter into the Trade on Bullish Side.
Selling Zone is above current Market Price. It indicate Price Action area where Sellers overpowered Buyers hence there was big Leg out Candle. This zone may again give Selling momentum if Price comes back to that level. As a Trader one may take opportunity enter into the Trade on Bearish Side.
DISCLAIMER:
This indicator/code IS NOT intended to be a formal investment advice or recommendation by the author, nor should be construed as such. Users will be fully responsible by their use regarding their own trading vehicles/assets.
It is strongly recommended that you should get full knowledge of how price actions work and wait for the clear indications before attempting.

Support Resistance ZonesSupport and resistance zones are used across all markets by traders and bots alike to identify liquidity and possible bounce areas. This script automates the drawing of those zones based on a number of variables, such as lookback period, channel width, number of touch confirmations and more.
This script also implements a some useful alerts so you can rest easy until the market hits a point of interest:
Enter SR Zone
Exit SR Zone
Break Upper Resistance
Break Lower Resistance

Mayfair Supply & Demand Zones 1.0Identifying Supply and Demand zones can be tricky.
Just using price levels can mislead you, so why not include volume ramps to detect zones?
This indicator does it for you. It spots areas where volume has rapidly increased, measures the speed of the increase, and assigns three different levels of importance.
The red areas are the strongest zones, followed by amber, then green, like a traffic light.
The red areas are persisted longer than the amber, which are persisted longer than the green. As the persistence fades, the colour of the zone fades as well.
It is possible to set the levels of all three volume thresholds to suit yourself, as well as the lookback period the script uses to detect volume increases.
In this chart, only very large volume increases are used:
As you can see, the bands are narrower, but we feel the defaults give the best results.

Ishiki ZoneOANDA:USDJPY
Ishiki Zone is drawn to the conscious price range and functions as a very strong resistance zone.
The strength of the resistance band is indicated by color. The strongest is the red zone, the second strongest is the yellow zone, and the third strongest is the blue zone.
In the vicinity of Ishiki Zone, create a chart pattern at the Day bar or more of the time axis, it is often to new trend formation.
currency pair:USDJPY, EURUSD
意識ゾーンは市場全体に意識されているであろう価格帯に引いており、非常に強い抵抗帯として機能します。
色別で抵抗帯の強さを表しており、1番強いのがレッドゾーン、2番目に強いのがイエローゾーン、そして3番目がブルーゾーンとなっています。
意識ゾーン付近では、日足以上の時間軸でチャートパターンや何かしらの値動きを作り、そこからまた新たにトレンド形成することが多いです。
意識ゾーンは大きな時間軸の環境認識として利用するのが適しています。
対応通貨ペア:USDJPY, EURUSD

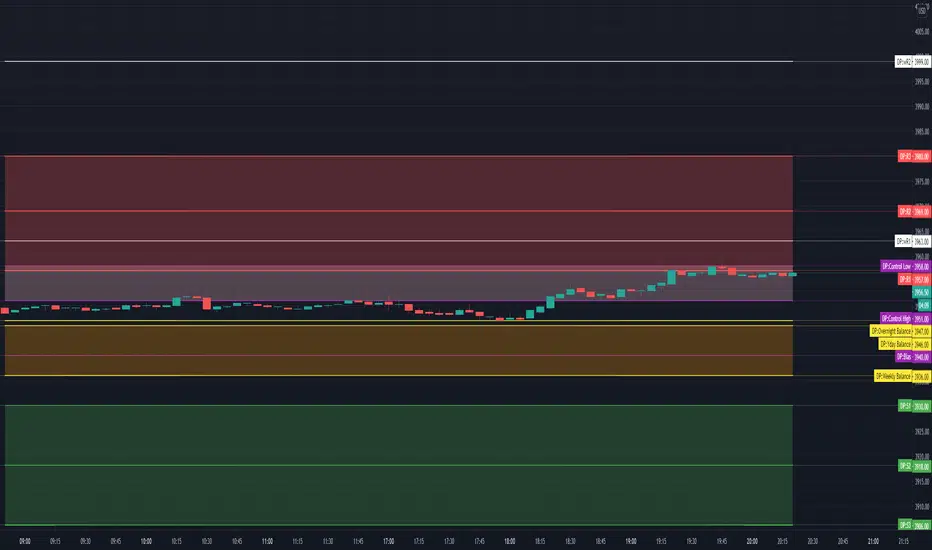
TV Day Plan Template 1This is a template for daytraders, swing traders, supply and demand traders, and even swing traders. As traders we are always scanning charts for levels and zones. This template makes it easy and convenient to find, change, and chart levels. As a daytrader, I will use this daily. I always have daily and weekly targets in mind. This will ensure I don't lose track of the bigger picture while trading the smaller moves. Levels in this chart are not auto calculated. They are manually input. This script is a quick and convenient way to chart multiple levels without having to go through each drawing, change the settings, and then redraw the level. Currently this will only save levels for one ticker. A workaround is to use multiple instances and then hide the ones not in use. Another way is to use the second part to this script, Day Plan Levels Template 2. If only using one instance, you can save the levels as default. This will save them. However, if saving levels as default while using multiple instances of this indicator, the other levels will erase. The way that I use this that I have daily levels for #ES in one instance and then daily levels for #NQ in another instance.
This script is very customizable
Options include
On/Off Toggles
Light/Heavy Versions - Light versions does not plot. Heavy version will plot and show levels in info bar and price axis
Balance Levels
Control Levels
3 Support and 3 Resistance levels for daily and weekly
2 Support and 2 Resistance Clouds
Balance and Control Clouds
"0" value disables and hides levels
WF ZonesSimple Zones. Indicator draws zero line (open price of the day), then +0.25% (-0.25%), +0.5% (-0.5%), +0.75% (-0.75%) and +1% (-1%).
Statistic say that zero -0.25 & zero +0.25 are the range of flat. Movement from 0.25 to 0.5 is 68% in average. 0.5-0.75% is about 70%. 0.75 - 1% less than 50%.


Novice Hedge Zone MarkerDear Investor / Trader,
Novice Hedge Zone Marker is a flag to identify the Supply and Demand zones.
I have coded the flag in such a way when there is an imbalance between the buyer and the seller, the flag is triggered.
There are 2 type of candle.
Equilibrium Candle (E-Candle):
They imply that transactions are happening in a range thus Buyer and Seller are in balance
Candle with Body Range <= 50% of Candle Range
Im-Balance Candle (IB-Candle):
They imply imbalance between Buyer and Seller thus price starts moving either up or down
Candle with Body Range > 50% of Candle Range
Demand Zone Formation (DZ):
1. Reversal Pattern – RED IB Candle - > BLUE E Candle - > GREEN IB Candle
2. Continuous Pattern – GREEN IB Candle - > BLUE E Candle - > GREEN IB Candle
Supply Zone Formation (SZ):
1. Reversal Pattern – GREEN IB Candle - > BLUE E Candle - > RED IB Candle
2. Continuous Pattern – RED IB Candle - > BLUE E Candle - > RED IB Candle
Flag Name:
DZ - Demand Zone
SZ - Supply Zone
Suggested time frame:
Scalping trading - 1 Min or 3 Min
Intraday trading - 5 Min or 15 Min
Swing Trading - 1 Hr or 4 Hr
Positional Trading - 1 Day
Buy Opportunity:
Entry - When there is a formation of DZ flag in an up trend of the underlying.
Stop loss should be the low of the BLUE candle.
Sell Opportunity:
Entry - When there is a formation of SZ flag in a down trend of the underlying.
Stop loss should be the high of the BLUE candle.
High POP Setup:
One can take trades based on the flag when there is a correlation with Pivot , Camarilla , higher period MA.
Note: Trade only the pull back.

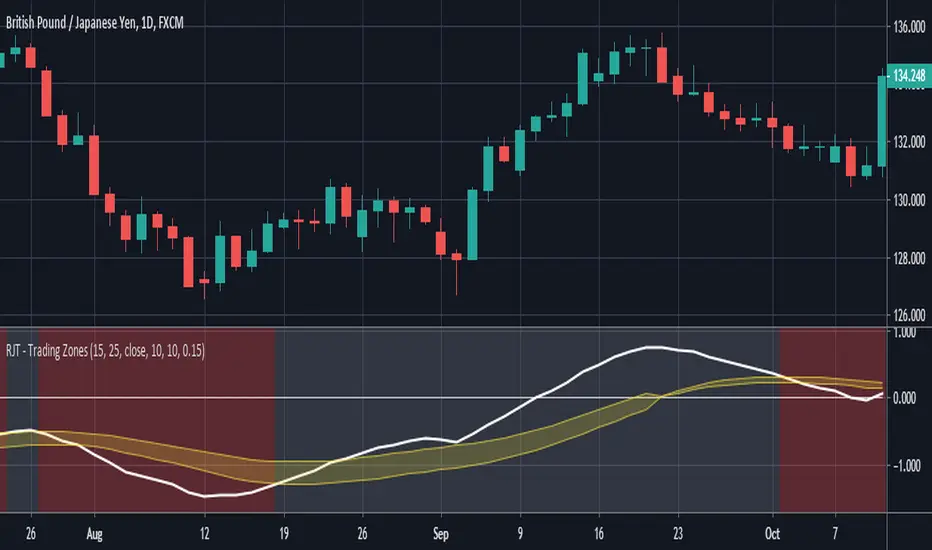
RJT - Trading ZonesThis is the Visual Indicator component of my Trading Zones System; other indicators are the Trade Visualiser and Trader Placer.
This indicator is based around a convergence and divergence of moving averages. As the signal line moves into the yellow "zone" from below a long position is opened. This position is closed and reversed when either the upper or lower boundary is crossed downwards by the signal line. This is all reversed for short trades.
The channel is created by adding a factor of previous values, from a configurable period, to an exponential moving average of the signal line.
Best used on the Daily timeframe of any Forex or Commodity market, but is successful on all timeframes.
Go Long when background turns from Red to Green.
Go Short when background changes from Green to Red.
Signal Smoothing = Length of signal period
Signal Look back period = Period of look back for highest value (when long, lowest value when short) to create channel width
Channel multiple= Multiple of highest value to be added to EMA of Signal to create zone (larger number = wider zone)
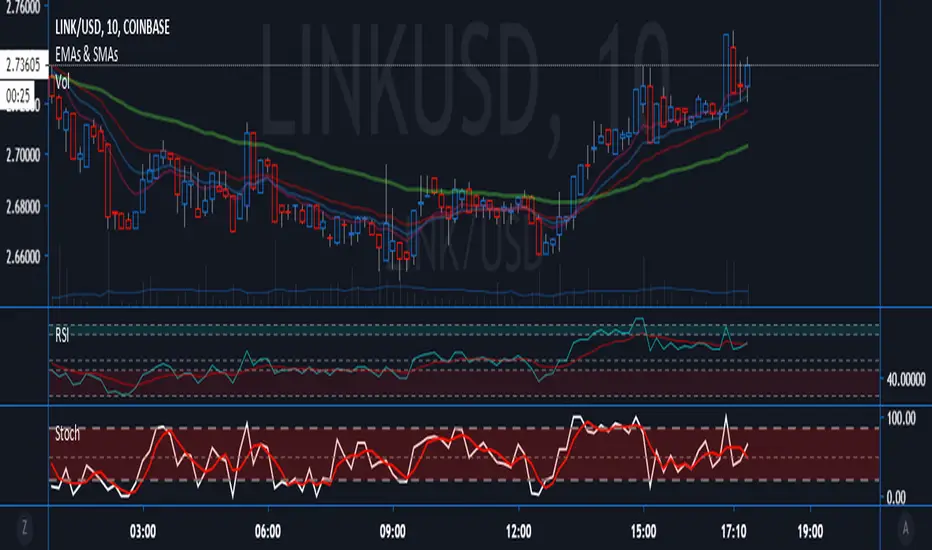
Relative Strength Index With EMA and Control ZonesThought this could be helpful since I couldnt find an RSI with an ema and Browns theory using control zones. Hope you all enjoy!
Hashem Extended Stochastic (V2)Extended Stochastic with All Zones. From Neutral to Danger Zones.
The Most Complete and Extended Stochastic Indicator.