Multi Timeframe Supply & Demand ZonesIntroduction
Hello fellow traders and coders, I’d like to introduce the multi time-frame supply and demand indicator that you’ve been looking for, its a dynamic script encompassing a lot of features however it is merely a tool to be used in conjunction with your own market analysis.
Features
A maximum of 2 time-frames that can be customized independently.
The ability to change individual swing lengths that create the supply and demand boxes, all time-frames will come set at 7, you can however set this to whatever you are comfortable with.
Supply and demand functionality for both time-frames.
The ability to either use (highs and lows) or closes for mitigation of supply and demand zones, meaning that if set to close the zones will be mitigated if a close is above the top for supply and bottom from demand, the same will apply when the high and low flag is used.
The ability to customize box colors, border type, border width and text size.
The ability to prevent lower time frame structure from showing on higher time frames which I don’t advice as it will provide you with an inaccurate perception of the lower time frame structure hence I’ve made the feature available but set it to false.
The script also has a section called general settings that will allow you to hide all the supply and demand zones on the chart.
The ability to choose the number of supply or demand zones to display per time-frame.
General Settings Functionality.
Input 1 allows you to hide all the demand zones on the chart.
Input 2 allows you to hide all the supply zones on the chart.
Input 3 if false will show lower time frame structure on a higher time frame. Default is true to prevent inaccurate results on higher time-frames.
Cari dalam skrip untuk "zone"

VWAP Balance ZonesVWAP Balance Zones (VBZ) Is based on 3 concepts.
Many Traders use VWAP to help determine Price Trends.
Trends are typically identified by new Highs or new Lows.
Balanced is found when Supply and Demand are mostly Equal.
VBZ tracks the daily, weekly, and monthly highs and lows; Then plots the average (50%) between the VWAP and the respective extremes.
50% VWAP Zones can be considered significant since they attempt to identify the equilibrium between market participants within the current trend, serving as key reference points to consider for decision making. >While in an uptrend, Buyers may see price falling to the Hi 50% as an attractive value entry for the continuation upwards.
>While ALSO in an uptrend, Sellers may see price falling to the Hi 50% as a change in sentiment with more downwards movement on the way.
Because of these conflicting mindsets, these zones are thought to display areas of balance between buyers and sellers, which can serve as potential decision points throughout the day.
VBZ Draws Zones from the Daily (High/Low/Close) VWAPs and the Day's (High/Low/Close) extremes as seen below.
Technically speaking, an average between vwap and extreme is a single point, to make these into zones I am using multiple sources for vwap and tracking different points of the bar throughout the day (ex. Close VWAP & Daily Highest Close)
Weekly and Monthly are only displaying the Average Price between the VWAP and the (Weekly or Monthly) High/Low.
These hold up as important levels for speculation; however, since most action will be discovered at the daily zones, I am not displaying the zones for the Weekly and Monthly to keep noise to a minimum.
Unique Behaviors:
- Weekly values are hidden on the first day of the week since they are similar to the daily values on the first day of the week.
- Monthly values are hidden in the first week of the month for the same reason.

TDI - with power zonesTDI with power zones for divergences. Should divergences happen in the right zone you short or long the price for an easy win

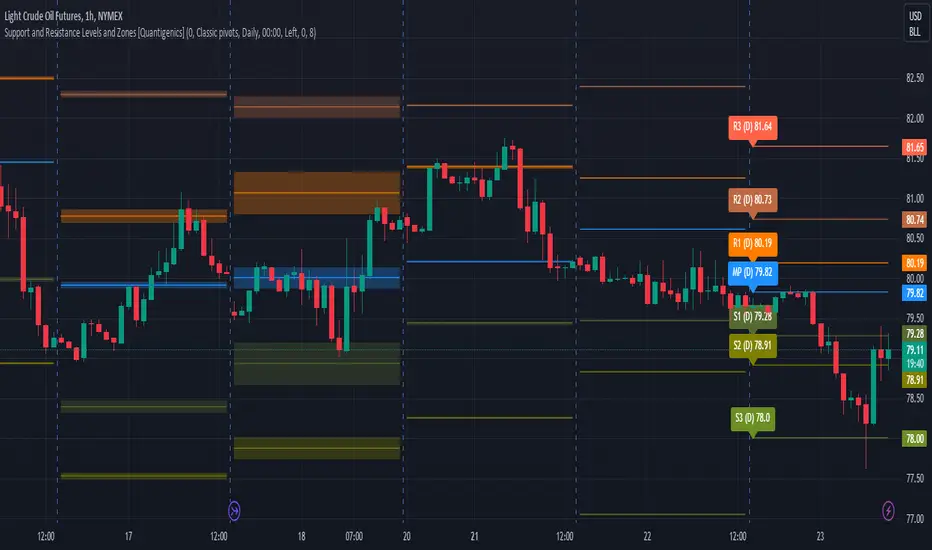
Support and Resistance Levels and Zones [Quantigenics]Support and Resistance Levels and Zones Indicator is an enhanced support and resistance indicator in that typical support and resistance levels are crucial concepts in technical analysis representing price levels where selling or buying momentum tends to halt, typically leading to a price reversal.
The Support and Resistance Levels and Zones Indicator goes beyond static levels by identifying dynamic 'zones'. These zones, depicted as shaded areas, offer more nuanced insights, acknowledging that markets are not rigid but fluctuating entities. Traders can leverage these zones, alongside the standard levels that the indicator plots, to better time their entries and exits, maximizing potential profitability and minimizing risk.
This is a "must-see on your charts" indicator and while scrolling back looking at historical data shows the amazing power of this indicator, it's even better in realtime LIVE price action and the price can tend to hit the Support and Resistance Levels and Zones multiple times intrabar.
TVC:GOLD 1HR
NYMEX:CL1! 15MIN
Enjoy!
Volume Zone Oscillator by [VanHelsig]Volume Zone Oscillator
How volume zone oscillator work:
Like other VZO it uses the same principle of calculation Volume direction divided on total volume and then scaled to 100 and -100.
When we have positive momentum close > close we have value of positive Volume, other way we have -volume negative one. <- this called a volume direction
Total volume is simply moving average with source of volume
And then MA with source of volume direction divided on MA of total colume and scaled it from 100 to -100
Basically we have few signals what VZO can show:
-Strong buy in oversold zone and strong sell in overbought zone. (Triangles at the top red and at the bottom green)
-Local Buy and Sell (Green and red Robustnesses)
-Posibility of trend change (Blue robustness)
Also you can webhook alerts to your spread sheet that sends values 1 for buys signals and -1 for sell signals in a range of 1 to 10 days
Here you can see marked signals on the chart
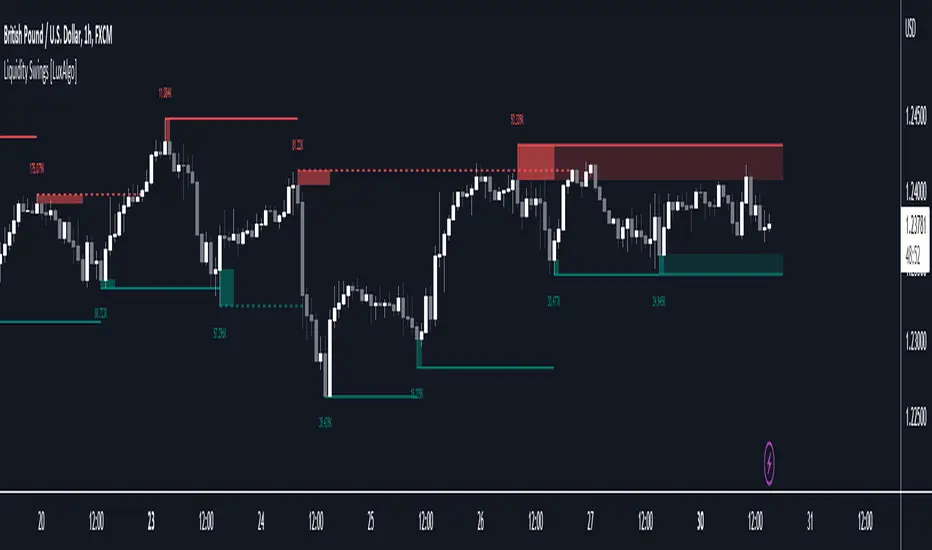
Liquidity Swings [LuxAlgo]The liquidity swings indicator highlights swing areas with existent trading activity. The number of times price revisited a swing area is highlighted by a zone delimiting the swing areas. Additionally, the accumulated volume within swing areas is highlighted by labels on the chart. An option to filter out swing areas with volume/counts not reaching a user-set threshold is also included.
This indicator by its very nature is not real-time and is meant for descriptive analysis alongside other components of the script. This is normal behavior for scripts detecting pivots as a part of a system and it is important you are aware the pivot labels are not designed to be traded in real-time themselves.
🔶 USAGE
The indicator can be used to highlight significant swing areas, these can be accumulation/distribution zones on lower timeframes and might play a role as future support or resistance.
Swing levels are also highlighted, when a swing level is broken it is displayed as a dashed line. A broken swing high is a bullish indication, while a broken swing low is a bearish indication.
Filtering swing areas by volume allows to only show significant swing areas with an higher degree of liquidity. These swing areas can be wider, highlighting higher volatility, or might have been visited by the price more frequently.
🔶 SETTINGS
Pivot Lookback : Lookback period used for the calculation of pivot points.
Swing Area : Determine how the swing area is calculated, "Wick Extremity" will use the range from price high to the maximum between price close/open in case of a swing high, and the range from price low to the minimum between price close/open in case of a swing low. "Full Range" will use the full candle range as swing area.
Intrabar Precision : Use intrabar data to calculate the accumulated volume within a swing area, this allows obtaining more precise results.
Filter Areas By : Determine how swing areas are filtered out, "Count" will filter out swing areas where price visited the area a number of time inferior to the user set threshold. "Volume" will filter out swing areas where the accumulated volume within the area is inferior to the user set threshold.
🔹 Style
Swing High : Show swing highs.
Swing Low : Show swing lows.
Label Size : Size of the labels on the chart.
Note that swing points are confirmed after Pivot Lookback bars, as such all elements are displayed retrospectively.
Volume profile zonesHi all!
This script calculates and shows the volume profile for the range of a higher timeframe candle. It then shows support or resistance (/supply or demand) zones based on the volume profiles with the most volume. The defaults are just my preferred settings so feel free to play with them! Also feel free to let me know about bugs and features. I already have a list of features to make, e.g.:
base on pivots
more info zone calculations, e.g. breaks and retests, virgin point of control etc.
add alerts
get rid of getPriceLevels()
get rid of _barVolumeProfile prefix
handle realtime
...
Best of trading luck!

Simple OHLC Custom Range Interactive█ OVERVIEW
This indicator show lines of OHLC which can be commonly used as support and resistance zones.
OHLC can be shown table with candlestick visual.
Color of candlestick depends on direction of bullish / bearish of the chosen candlestick.
█ INSPIRATION
Inspired by design, code and usage of CAGR . Basic usage of custom range / interactive, pretty much explained here . Credits to TradingView .
█ FEATURES
Table can positioned by any position and font size can be resized.
OHLC can be in full or simple name.
Lines can be extend either right, left, both or none.
█ HOW TO USE
Only 1 point is required.
Dont worry about magnet, point will attached depends on High or Low of the candle.
█ USAGE / TIPS EXAMPLES (Description explained in each image)

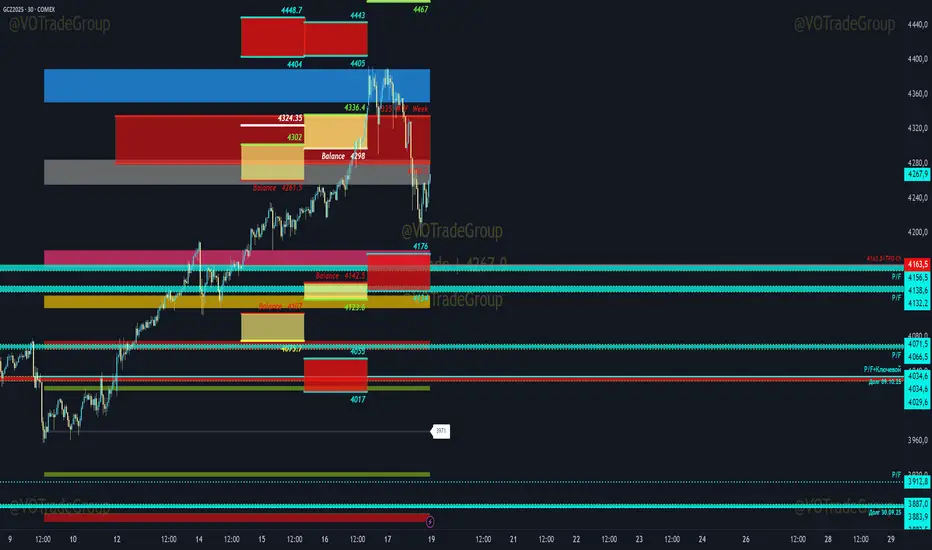
VOTrade Margin Zones CME/ICE/МОЕХ AUTO 2.0
Margin zones are zones that are strong support and resistance levels and on the basis of which further movement of a trading instrument can be assumed. Margin zones are built based on the levels of margin requirements for futures of the Chicago Mercantile Exchange ( CME ), which corresponds to a specific trading instrument on the spot market. The margin requirement levels form a certain amount of the futures move (and therefore the corresponding currency pair), conditionally this can be called the volatility that the market maker sets for the trading instrument.
Margin zones in trading are the areas to which the price reacts, and the closing of the day (the American trading session) below or above a certain level signals to us about the potential of a further trend (this is one of the classic rules based on observation and statistics collection, but you can use the zones as a kind of volatility move in other ways).
Differences from the basic version of VOTrade Margin Zones CME:
1) In this version of the script, it is implemented to save the display of margin zones on all assets where they were built.
2) Displaying the construction of margin zones according to the author's TS "VOTrade"
3) Adding tools for building margin zones for the assets you need through contact with the author.
4) Support for instruments from the world's largest exchanges CME / ICE / MOEX with up-to-date margin data.
5) Display of constructions of margin zones in both directions of movement.
6) Cross-currency support.
Supported tools:
CME future - 6E, 6B, 6C, 6A,6S, 6C, 6N, 6J,ES, NQ,YM, GC , SI, NG , HG, WTI (add according to interest)
Ice future -DXY, Brent (add according to interest)
MOEX future - Ri, Si (add according to interest)
FOREX - EURUSD , AUDUSD , GBPUSD , NZDUSD , XAUUSD , XAGUSD , WTI, SP500 , Nasdaq, US30 (add according to interest cross-currency support.)
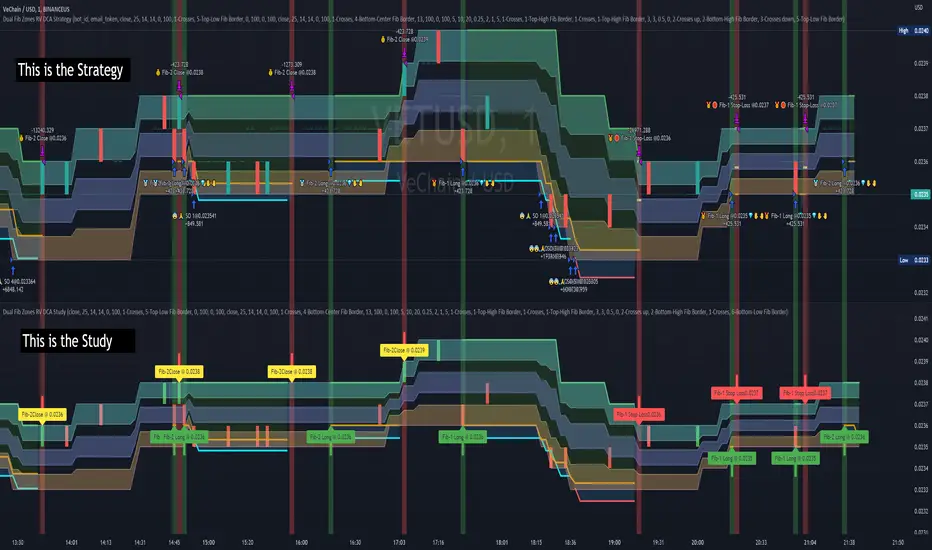
Dual Fibonacci Zones & Ranged Vol DCA Study - R3c0nTraderWhat does this do?
This signal script (aka Study) was created so it could be used with the corresponding strategy "Dual Fibonacci Zone & Ranged Vol DCA Strategy - R3c0nTrader" to create the buy and sell signals for 3Commas bots.
How to Use
Configure the study to match your settings you have set in the strategy. This script comes with an buy and sell alert conditions built-in. Just click to add alert and select Buy or Sell and paste in your bot messages.
Credits:
Thank you "EvoCrypto" for granting me permission to use "Ranged Volume" to create this study
Thank you "eykpunter" for granting me permission to use "Fibonacci Zones" to create this study
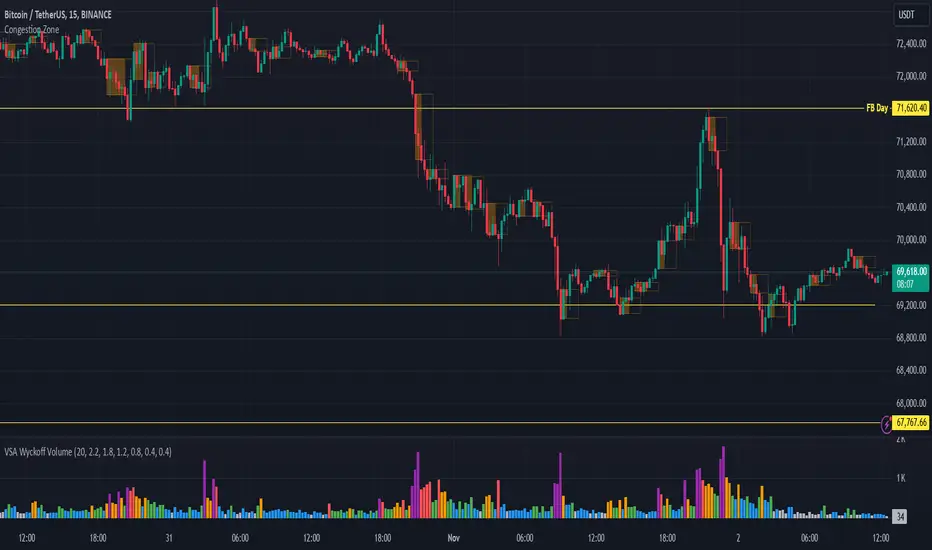
Congestion ZoneCongestion zone include at least 3 candle sticks that the next candle has an opening and closing price within the previous candle
When the price returns to the congested zone there is a possibility of a reversal
The congestion zone is used as a support-resistance area and is used by price action traders.
This script will highlight congestion zones, this will help PA Traders find out them easily.
Multiple MAs + No Trend Zone + ATR WidgetThis is my first Pine Script attempt. Nothing special, just an "all in one" for the most common things I use, and what I have found to be the most common in a lot of strategies.
Great for free and limited accounts as it combines 7 total indicators into one.
-- First 5 indicators are Independant Moving Averages:
-Each one can be set for length, as well as source and type (SMA, EMA, SMMA, WMA, VWMA) individually
-- Second type (6th) of indicator is one I find extremly useful for staying OUT of consolidation trading. It's called a "No Trend Zone" indicator I swipped from the Hoffman Startegy. Basically, its set for a small deviation (0.5) of a 35 EMA, which creates a "Band" around the 35 line. When you have this "Band" flat or with no discernable incline/decline, with price action OR some or multiple moving averages inside this banded zone, it typically indicates a zone of consolidation. This will help you identify when you may be in one of those zones, that way you don't get trapped "waiting for paint to dry" before the market starts to move again with your position, and keep you from entering should you be considering the market at that time.
The last indicator is my favorite, and one I will refine a little deeper soon.
-- The ATR widget finishes us out. This widget can be customized for colors, turned on or off, and automatically rounds the ATR (ATR period based on the chart timeframe) to a nice readable number for what you're trading. It has settings to show or not, the length, what rounding style to use (forex pip 0.0001, forex/stock/etf/indicies 0.01) where to show it on the pane, a Multiplier Factor (for stop loss calculations automatically) and the colors.
***NOTE ABOUT ATR WIDGET:
I am primarily a forex trader, so the defaults are for Forex 0.0001. If you see some odd numbers (like 55798 on a current chart), check the inputs tab on the settings, and change the "ATR Style" from "Forex 0.0001" to "Forex/Stock/ETF/Indicies 0.01", and you should arrive with the correct number.

Donchian Channels ModDONCHIAN FIBONACCI MODD VERSION
This indicator is based on a Donchian Channel with Fibonacci zones based on high and lows of certain period . As one can see it clearly identifies the trend and it only turns aqua when its above a spefic fib level and turns red when below specfic fib level , this help traders by not talking long or short position while its in no trade zone when the candle turns gray .This works on ALL TIMEFRAME & ANY SEGMENT
Aqua candle= Super Bullish
Red candle= Super Bearish
Gray Candle= NO TRADE ZONE (can take long or short in retracement coz the stop loss will be minimum )
Long condition = When the candle turns lime one can place the SL at the Low of the band and keep trailing , at time the trend is still long and candle turns gray one can re entry long just at support and place the SL just below the band .
Short condition = When the candle turns red one can place the SL at the High of the band and keep trailing, at time the trend is still short and candle turns gray one can re entry short just at the resistance and place the SL just below the band .
Hope this be helpful for my trading view family !
God Bless !

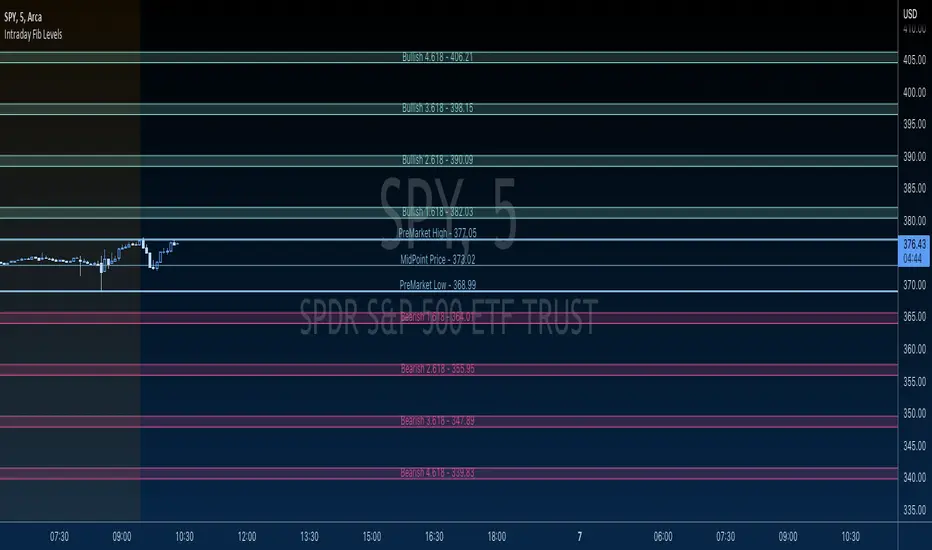
GBTT Premarket Fib ZonesOverview:
This is a daily pre market fib tool. Basically, it looks at your premarket price action and generates a set of fibs. From there, it cross references bearish vs bullish fibs, creates a bear and bull zone to watch for during the day. Finally it draws associated fib levels in each direction are plotted/shaded to represent possible price levels for the day.
The lines will redraw/update every day at open, 930 est and then be there on the chart all day until the following open. These zones are meant to be a reference point for the current trading day only.
Intended use:
To provide educational content about the short term movement of an asset. Can be used on any time frame. But remember, it updates at 930 at open for each day and is only applicable to the current trading day.
Disclaimer:
NOT intended to be a sole source of Technical Analysis or anything more than an educational tool!
Supply, Demand and Equilibrium Zones, Interactive by DGTSupply, Demand and Equilibrium Zones, Interactive
The law of supply and demand is a theory that explains the interaction between the sellers of an asset and the buyers for that asset. The theory defines the relationship between the price of a given asset and the willingness of traders to either buy or sell it. Generally, as price increases, traders are willing to supply more and demand less and vice versa when the price falls.
Simply said, the higher the price, the lower the quantity demanded, and from the seller's perspective, the higher the price, the higher the quantity supplied
Equilibrium zones are the price levels where both selling and buying trading activity is high, both sellers and buyres are interested at that price levels. More correctly, there is a great deal of activity on both the buy and sell side and the market stays at that price level for a great deal of time. Supply and demand are balanced or in equilibrium
Supply and Demand Shifts may occur when institutional investors step in, a change in both price and quantity demanded from one point to another
This experimental study attempts to presend Supply, Demand and Equilibrium Zones by measuring traded volume at all price levels on the market over a specified time period. Then the result is plotted as horizontal zones on the finacial isntrumnet's chart that highlights supply, demand and equilibrium zones at specific price levels
It is important for supply, demand and equilibrium zones to understand that time is always a dimension on charts. The quantity demanded or supplied, found along the horizontal axis, is always measured in traded volume of the asset over a given time interval. Longer or shorter time intervals can influence the levels of supply, demand and equilibrium zones
The study is made interactive, which requires the users to select two points on the chart, by simply clicking on the chart. In case the user would like to view different range then just dragging the vertical lines will be enough
By increasing/decreasing values for supply and demand zones or equilibrium zones, you will either get the zones enlarged or detect supply and demand shifts or other equilibrium zones
It is adviced to use this study in conjuction with a Volume Profile study, such as Volume-Profile-and-Volume-Indicator , Volume-Profile-Custom-Range , Anchored-Volume-Profile , and Price-Action-Support-Resistance , where volume profiles presents trading activities at specific price levels and Supply and Demand Zones can be treated as Value Area (they are not exact same but similar) for Volume Profiles
Disclaimer: Trading success is all about following your trading strategy and the indicators should fit within your trading strategy, and not to be traded upon solely
The script is for informational and educational purposes only. Use of the script does not constitutes professional and/or financial advice. You alone the sole responsibility of evaluating the script output and risks associated with the use of the script. In exchange for using the script, you agree not to hold dgtrd TradingView user liable for any possible claim for damages arising from any decision you make based on use of the script

Combo Ichimoku + CDC Action Zone by fukuizThis indicator combines the famous indicators Ichimoku and CDC ActionZone.
#A brief introduction to Ichimoku #
The Ichimoku Cloud is a collection of technical indicators that show support and resistance levels, as well as momentum and trend direction. It does this by taking multiple averages and plotting them on a chart. It also uses these figures to compute a “cloud” that attempts to forecast where the price may find support or resistance in the future.
#A brief introduction to CDC ActionZone #
CDC ActionZone is a very simple system, utilizing just two exponential moving averages. The 'zones' in which different 'actions' should be taken are highlighted in different colors. Calculations for the zones
They are based on the relative position of price to the two EMA lines and the relationship between the two EMAs.
The CDC ActionZone was developed by Piriya333, a Thai technical analyst.
#How to use #
The basic method for using Ichimoku+CDC ActionZone is to follow the green/red color and the cloud.
Buy condition
-Buy when the bar closes in green and closes above the cloud
Sell condition
-sell when the bar closes in red.

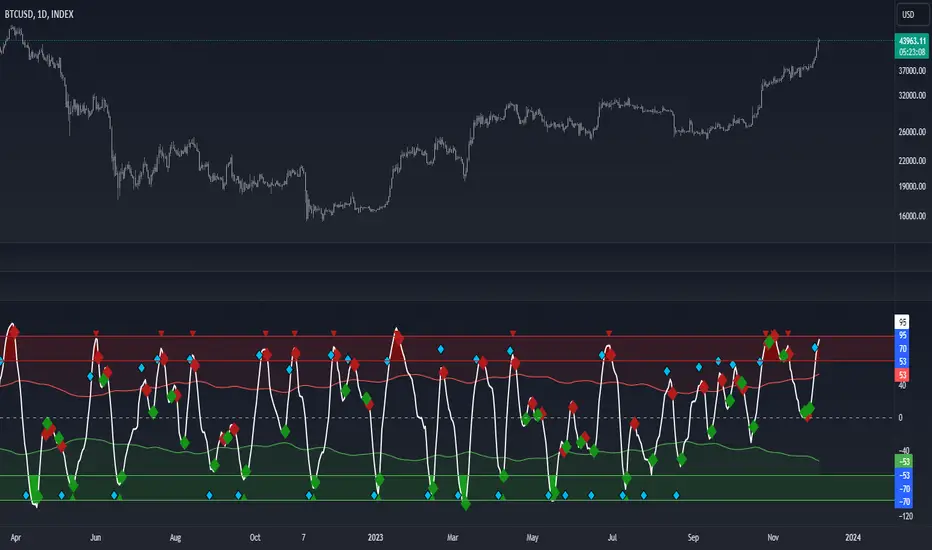
Volume Zone Oscillator (VZO)My interpretation of Walid Khalil's Volume Zone Oscillator (VZO) as published in the 2009 International Federation of Technical Analysis Journal.
This VZO indicator is also the same as Danielle Shay's popular Simpler Trading TurboVZO indicator.
ABOUT:
The oscillator breaks up volume activity into positive and negative categories. It is positive when the current closing price is greater than the prior closing price and negative when it's lower than the prior closing price. The resulting curve plots through relative percentage levels that yield a series of buy and sell signals, depending on level and indicator direction.
HOW TO USE THE INDICATOR:
The default period is 14 but can be adjusted after backtesting.
The VZO points to a positive trend when it rises above and maintains the 5% level, and a negative trend when it falls below the 5% level and fails to turn higher. Oscillations between the 5% and 40% levels mark a bullish trend zone, while oscillations between -40% and 5% mark a bearish trend zone. Meanwhile, readings above 40% signal an overbought condition, while readings above 60% signal an extremely overbought condition. Alternatively, readings below -40% indicate an oversold condition, which becomes extremely oversold below -60%.
Kahlil recommends confirming VZO signals with a 14-period average directional index (ADX), with values greater than 18 pointing to a trending market - search Tradingview's built-in indicators for the Directional Movement Index (DMI).
INTRADAY SCALPING:
Whilst the VZO is already smoothed with an exponential moving average, the indicator settings include an additional 'smoothing' function to remove any excess 'noise' in the plots for intraday use.

CCI Level ZoneThis strategy uses CCI 1000 as zones Buy sell if greater than level 100. will be seen as an uptrend If it's lower, it's a downtrend.
So we will use RSI. To trade in its zones, using the RSI crosses the level line, and when the RSI crosses the level line, it waits to buy with Stochastic.

Market Wizards HMA Warning ZoneThe MW HMA indicator, Provides BUY/SELL signals as well as warning zones. That indicate a potential change in trend

Heat Zone Relative Volatility Index 2.0v2 of Heat Zone RVI
• Updated aesthetics and added various alerts.
• The use of temperature descriptions with these Heat Zone scripts is more so metaphoric of the interpretations from what the RVI attempts to indicate primarily.
--- Due to the additions of the Overheated and Freezing Zones , the indicator-pane scaling is a little different from the original Heat Zone RVI .
Ex.)
--- If you like the scaling the way it was on v1, you can change it back by going into the settings , opening up the style page, and unchecking/turning off the Overheated Top Line as well as the Freezing Bottom Line . Otherwise, you can leave the settings be in regards to this matter.
Ex.)
Disclaimer : I am by no means a highly skilled or professional coder/programmer. I just enjoy dabbling and tinkering every now and again.
HOPE YOU ENJOY

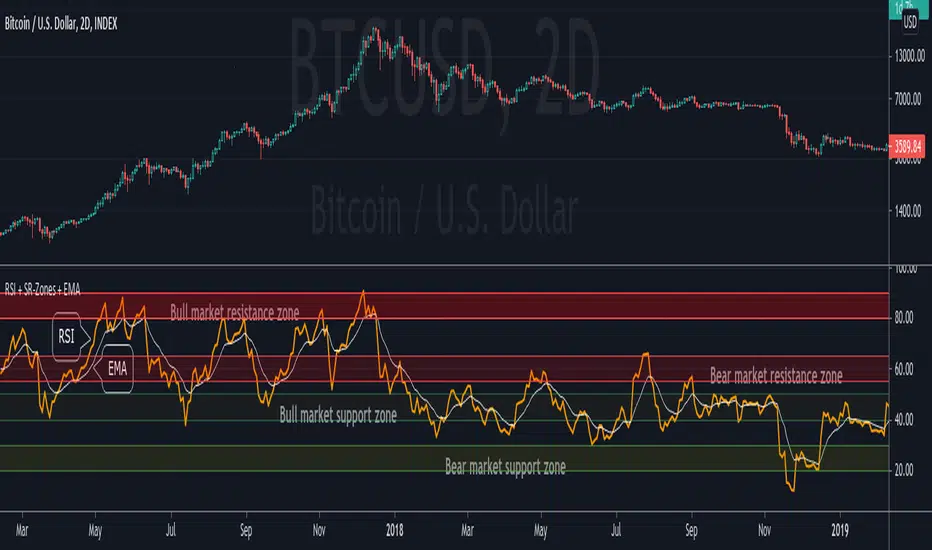
RSI + Support/Resistance Zones + EMAThis indicator enhances the RSI with support and resistance zones and an EMA.
RSI: a regular RSI (default: orange / 14 period)
EMA: an EMA on the RSI (default: light gray / 10 period)
RSI support/resistance zones
SR-Zones for bull markets: In a bull market the price tends to find resistance between 80 and 90 and support between 40 and 50 RSI.
SR-Zones for bear markets: In a bear market the price tends to find resistance between 55 and 65 and support between 20 and 30 RSI.
The concept of these support and resistance zones has been popularized by Constance Brown in her book Technical Analysis for the Trading Professional . The SR zones are described in the first chapter which is available in the preview section on Amazon.
RSI-EMA
The EMA on the RSI can also be used as support and resistance. For example, you can be use it for a simple strategy such as the following: In an uptrend after a significant correction during which the RSI has been below the EMA for some time, wait for the RSI to cross above the EMA to go long and exit (partially) after the RSI crossed down the EMA.
Hint: All visual elements (RSI, EMA, support zones) can be enabled/disabled and adjusted individually.
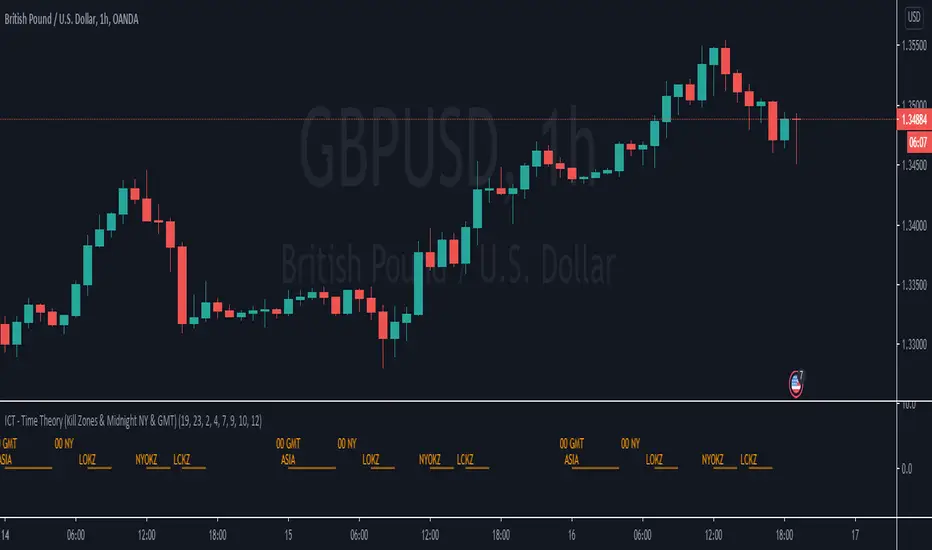
ICT - Time Theory (Kill Zones & Midnight NY & GMT)This script helps you to mark the following automatically instead of doing it every day:
Midnight GMT;
Midnight NY;
Asia Session;
London Open Kill Zone;
New York Open Kill Zone;
London Close Kill Zone;
This helps if you trade intra-day with this ICT concepts.
It draws a horizontal lines instead of painting the background. (There is a limitation of around 50 vertical lines per script)
Fibo Price ZoneThis indicator is used to automatically plot the Fibonacci Prize Zone.
The default settings of this indicator:
Number of candles = 30
Direction = from Low to High
The number of candles is the number of the previous candles, and the direction is the retracement from either high-to-low or low-to-high of the Fibonacci Price Zone.
The indicator will plot several bars, in which there are three bold bars that represent "weak", "normal" and "strong" price zone.
