Cari dalam skrip untuk "zone"

Better CME Margin Zones 25-200%Better indicator for CME Margin Zones
25%,50%,100%,200% zones included)

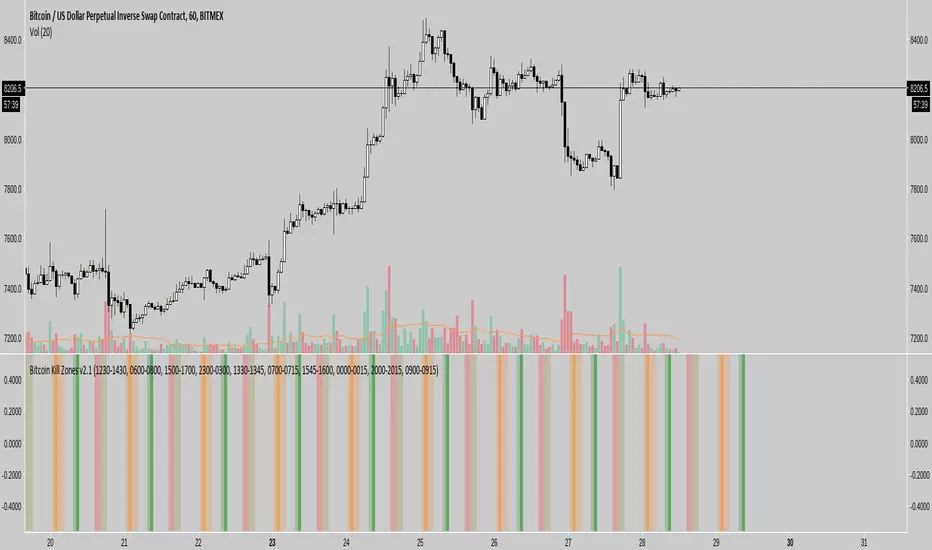
Bitcoin Kill Zones v2 [oscarvs] (UTC + 8)The Kill Zone script was modified to UTC + 8, Singapore to Beijing time.

Dynamic ZonesA port of the MT4 indicator of Mladen Rakic found at www.mql5.com
which is based on Dynamic Zones that was originally published in Stocks & Commodities 1996 issue.
Dynamic Zones is meant to be applied to oscillators to get dynamic overbought and oversold levels
quantified using statistical methods.

Kill Zones******* UPDATED VERSION *******
Use this one:
****************************************
>> OLD STUFF, please use the UPDATED version!!! <<
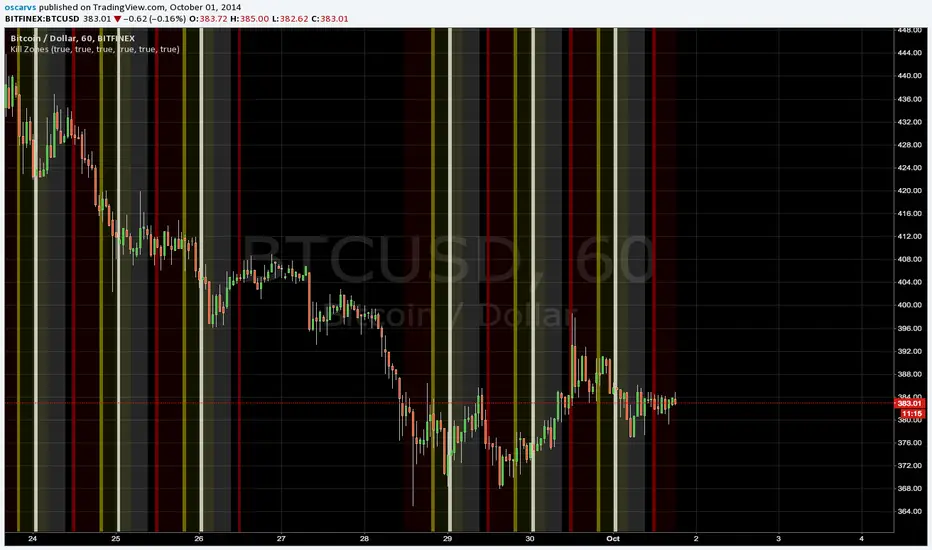
COPY & PASTE the code and change manually hours to reflect reality regardless selected TimeZone:
doNYOpen "1300-1310"
doNYSession "1300-0000"
doTokyoOpen "0030-0040"
doTokyoSession "0030-0930"
doLondonOpen "0800-0810"
doLondonSession "0800-1700"
Money Zones Institutional Kill RangesMoney Zones highlights the most important institutional trading windows where real volume enters the market. It automatically maps each session’s true high and low, giving traders a clear range. This tool is designed to help you focus only on the moments when the market is most likely to move with intention.

MAJOR PA Zones + Structure + Targets (Gray/Purple)This script highlights major price-action structure (HH/HL/LH/LL), marks BOS/CHOCH events, and draws key supply/demand zones to help visualize trend shifts and potential targets.

Manual Zones SafeUse cases:
Support and resistance levels
Supply and demand zones
Price action areas for manual trading strategies

RBR/DBD Zones JaRBR and DBD zones with multiple timeframe. designed to identify support and resistance area on the chart

RSI + EMA Dynamic Zones + Volume + Divergence (with RSI 50 line)RSI + EMA Dynamic Zones + Volume + Divergence (with RSI 50 line)

V3 9-20 Smart EMA Cross + RSI + FVG Zones (Instant Signal)V3 9-20 Smart EMA Cross + RSI + FVG Zones (Instant Signal)

Weekly Zones +RSI ColorWeekly analysis of stocks, cryptos etc.
chart, you will see:
The Weekly levels (PWH, PWL, 4 quadrants).
The Weekly control zones (the red, green, or grey boxes).
The Weekly analysis in the table.
Your 1-Hour candles will be colored green (strong), red (weak), or grey (neutral) based on the 1-hour RSI.
This should give you a very effective trading system.

JKL HTF S/D Zones JKL HTF S/D Zones
A small tool offered by grace—a reminder that wisdom is given, not earned. May you use it wisely and humbly, and let its fruit lift others up.
Purpose: render HTF Supply/Demand, decision boxes, and clean retest edges.
Use: mark the box edge; wait for retest + confirming candle + volume; manage RR ≥ 1.5R.
Reminder: Anchors decide • Flow aligns • RR protects.
Not financial advice. Practice discipline, walk in truth, and pass the good on.
“To God be the glory—for His steadfast love.”
Disclaimer:
Educational only — not financial advice. Use at your own risk.
No guarantees. Trade responsibly; test before live.
For study, not signals. You are responsible for outcomes.
David

Smart 9-15 EMA Cross + RSI + FVG Zones (Instant Signal)Smart 9-15 EMA Cross + RSI + FVG Zones (Instant Signal)

MTF Liquidity Levels Pro (D/W/M) [SmartFoxy]✅ SCRIPT DESCRIPTION (Premium MTF High-Low Levels)
Overview
This indicator automatically plots key High/Low levels across three major timeframes:
Daily (D) , Weekly (W) , and Monthly (M) .
It includes:
• Current period highs/lows (DH/DL, WH/WL, MH/ML);
• Previous period highs/lows (PDH/PDL, PWH/PWL, PMH/PML);
• Open levels (Day Open, Day True Open, Week Open, Month Open);
• Visual elements such as separators, period boxes, labels, and price markers;
• A fully customizable breakout alert system .
The indicator is designed for precise market structure analysis with a focus on liquidity, MTF mechanics, and clean price action.
________________________________________
How It Works
The script tracks historical High/Low levels on each timeframe and displays:
✅ Current High/Low Levels :
Daily;
Weekly;
Monthly.
✅ Previous High/Low levels from the previous day, week, and month:
PDH / PDL;
PWH / PWL;
PMH / PML.
You can select how many previous levels to display (1, 2, 3…).
✅ Open Levels:
Day Open;
Week Open;
Month Open.
Includes optional True Day Open with time offset.
✅ Visual Period Boxes highlighting each session (Day Box, Week Box, Month Box) to help identify intraday and intraperiod structure.
✅ Vertical Separators for the start of each day, week, and month.
✅ Customizable Labels & Price Markers with positions, sizes, and optional price display.
________________________________________
Alerts
A flexible alert module is built in:
✅ Breakout of Any Previous Level (D/W/M) •➤ Triggers when price breaks any previous High/Low:
PDH/PDL;
PWH/PWL;
PMH/PML.
✅ Breakout of Previous Level 1 (D/W/M) •➤ Triggers only for the closest previous levels:
PDH1/PDL1;
PWH1/PWL1;
PMH1/PML1.
✅ Custom Breakout •➤ Choose a specific level:
PDH / PDL;
PWH / PWL;
PMH / PML.
and select which level number (1, 2, 3…) the alert should track.
________________________________________
How to Use
Select which timeframes (D/W/M) to display.
Choose how many previous levels to plot.
Enable Open, Boxes, Separators, or Labels as needed.
Enable True Day Open with offset if required.
Activate Alerts and choose the breakout logic:
• All previous levels;
• Only the nearest level;
• Custom level selection.
Create an alert in TradingView using “Any alert() function call”.
________________________________________
Why This Indicator Is Useful
✅ Instantly reveals key High/Low liquidity zones across multiple timeframes
✅ Helps synchronize market structure across D/W/M levels
✅ Useful for identifying impulses, breakouts, reversals, and liquidity runs
✅ Highlights levels price frequently revisits
✅ Eliminates the need for additional MTF tools
✅ Alerts automate breakout detection for both intraday and swing traders
Suitable for all markets : Forex, Crypto, Indices, Stocks, Futures.
