SMC BOS - Structure Breaks & Median Continuation ProjectionsThis tool shows what usually happens after a Break of Structure (BOS).
It scans past BOS events on your chart, finds the ones most similar to the latest break (using ATR to filter by volatility), and then plots the median continuation path.
Optional percentile bands (P10–P90) display the possible range of outcomes around the median.
Key features:
• Automatic detection of bullish and bearish BOS events
• Library of past BOS with adjustable size and spacing
• ATR-based similarity and recency weighting
• Median continuation projections with optional percentile bands
• Customizable colors, signals, and stats table
• Works on any market and timeframe
Use cases:
• See how price typically behaves after a BOS
• Support SMC analysis with data-driven projections
• Improve trade planning by visualizing likely continuations
• Apply across crypto, forex, stocks, and futures
Originality:
Instead of only marking BOS, this script learns from history and projects forward the median path of the most similar past cases, adjusted for volatility. It turns BOS signals into practical continuation scenarios.
Instructions:
Add the indicator to your chart. When a BOS is detected, the projection is drawn automatically.
Use the settings to adjust the library, ATR weighting, projection style, percentile bands, and the display of signals or stats.
For questions or customization, contact Julien Eche (Julien_Eche) on TradingView.
SMC

Apex Edge – HTF Overlay Candles“Trade your 5m chart with the eyes of the 1H — Apex Edge brings higher-timeframe structure and liquidity sweeps directly onto your execution chart.”
Apex Edge – HTF Overlay Candles
The Apex Edge – HTF Overlay Candles indicator overlays higher-timeframe (HTF) candles directly onto your lower-timeframe chart. Instead of flipping between timeframes, you see HTF structure “breathe” live on your execution chart.
What It Does
• HTF Body Boxes → open/close zones drawn as semi-transparent rectangles.
• HTF Wick Boxes → high/low extremes projected as envelopes around each body.
• Midpoint Line → a dynamic equilibrium line that flips bias as price trades above or below.
• Sweep Arrows → one-time markers showing the first liquidity raid at HTF highs or lows.
Under the Hood
This isn’t just a visual overlay — it’s engineered for accuracy and performance in PineScript.
1. HTF Data Retrieval
• Uses request.security() to import open, high, low, close, time from any selected HTF.
• lookahead=barmerge.lookahead_off ensures OHLC values update bar by bar as the HTF
candle builds.
• When the HTF bar closes, boxes and midpoint lock to historical values — matching the
native HTF chart exactly.
2. Box Construction
• Body box: built from HTF open → close.
• Wick box: built from HTF high → low.
• Boxes extend dynamically across each HTF period, updating in real time, then freeze at
close.
3. Midpoint Logic
• (htfOpen + htfClose) / 2 calculates intrabar midpoint.
• Line drawn edge-to-edge across the active HTF body.
• Style, width, color, and opacity are user-controlled.
4. Sweep Detection
• Flags (sweepedHigh / sweepedLow) prevent clutter: only the first tap per side per HTF
candle is marked.
• Lower-timeframe price breaking the HTF high/low triggers the sweep arrow.
• Arrows are offset above/below wick envelopes for clean visuals.
5. Customisation
• Every layer (body, wick, midpoint, arrows) has independent color + opacity settings.
• Arrow size, arrow color, and transparency are adjustable.
• Default HTF = 1H (perfect for 5m/15m traders) but can be switched to 30m, 4H, Daily,
etc.
Why It’s Useful
• HTF intent + LTF execution without chart hopping.
• Liquidity mapping: see where liquidity is swept in real time.
• Bias clarity: midpoint line defines HTF equilibrium.
• Clean signals: only the first sweep prints — no spam.
What Makes It Different
Most MTF overlays just plot candles or single lines. This tool:
• Splits body vs wick zones for institutional precision.
• Updates live intrabar (no repainting).
• Highlights liquidity sweeps clearly.
• Built for readability and professional use — not another retail signal toy.
Cheat-Sheet Playbook
1️⃣ Structure Bias
• Above midpoint line = bullish intent.
• Below midpoint line = bearish intent.
• Chop around midpoint = no clear direction.
2️⃣ Liquidity Sweeps
• ▲ Green up arrow below wick box = sell-side liquidity taken → watch for longs.
• ▼ Red down arrow above wick box = buy-side liquidity taken → watch for shorts.
• First sweep is the cleanest.
3️⃣ Trade Logic
• Body box = where institutions transact.
• Wick box = liquidity traps.
• Midpoint = bias filter.
• Best setups occur when sweep + midpoint flip align.
4️⃣ Example (5m + 1H Overlay)
1. ▲ Green up arrow prints below HTF wick.
2. Price reclaims the body box.
3. Midpoint flips to support.
4. Enter long → stop below sweep → targets = midpoint first, opposite wick second.
In short:
• Boxes = structure
• Wicks = liquidity pools
• Midpoint = bias line
• Arrows = liquidity sweeps
This is your SMC edge on one chart — HTF structure and liquidity fused directly into your execution timeframe.

Apex Edge – Wolfe Wave HunterApex Edge – Wolfe Wave Hunter
The modern Wolfe Wave, rebuilt for the algo era
This isn’t just another Wolfe Wave indicator. Classic Wolfe detection is rigid, outdated, and rarely tradable. Apex Edge – Wolfe Wave Hunter re-engineers the pattern into a modern, SMC-driven model that adapts to today’s liquidity-dominated markets. It’s not about drawing pretty shapes – it’s about extracting precision entries with asymmetric risk-to-reward potential.
🔎 What it does
Automatic Wolfe Wave Detection
Identifies bullish and bearish Wolfe Wave structures using pivot-based logic, symmetry filters, and slope tolerances.
Channel Glow Zones
Highlights the Wolfe channel and projects it forward into the future (bars are user-defined). This allows you to see the full potential of the trade before price even begins its move.
Stop Loss (SL) & Entry Arrow
At the completion of Wave 5, the algo prints a Stop Loss line and a tiny entry arrow (green for bullish, red for bearish). but the colours can be changed in user settings. This is the “execution point” — where the Wolfe setup becomes tradable.
Target Projection Lines
TP1 (EPA): Derived from the traditional 1–4 line projection.
TP2 (1.272 Fib): Optional secondary profit target.
TP3 (1.618 Fib): Optional extended target for large runners.
All TP lines extend into the future, so you can track them as price evolves.
Volume Confirmation (optional)
A relative volume filter ensures Wave 5 is formed with meaningful market participation before a setup is confirmed.
Alerts (ready out of the box)
Custom alerts can be fired whenever a bullish or bearish Wolfe Wave is confirmed. No need to babysit the charts — let the script notify you.
⚙️ Customisation & User Control
Every trader’s market and style is different. That’s why Wolfe Wave Hunter is fully customisable:
Arrow Colours & Size
Works on both light and dark charts. Choose your own bullish/bearish entry arrow colours for maximum visibility.
Tolerance Levels
Adjust symmetry and slope tolerance to refine how strict the channel rules are.
Tighter settings = fewer but cleaner zones.
Looser settings = more frequent setups, but with slightly lower structural quality.
Channel Glow Projection
Define how many bars forward the channel is drawn. This controls how far into the future your Wolfe zones are extended.
Stop Loss Line Length
Keep the SL visible without it extending infinitely across your chart.
Take Profit Line Colors
Each TP projection can be styled to your preference, allowing you to clearly separate TP1, TP2, and TP3.
This isn’t a one-size-fits-all tool. You can shape Wolfe detection logic to match the pairs, timeframes, and market conditions you trade most.
🚀 Why it’s different
Classic Wolfe waves are rare — this script adapts the model into something practical and tradeable in modern markets.
Liquidity-aligned — many setups align with structural sweeps of Wave 3 liquidity before driving into profit.
Entry built-in — most Wolfe scripts only draw the structure. Wolfe Wave Hunter gives you a precise entry point, SL, and projected TPs.
Backtest-friendly — you’ll quickly discover which assets respect Wolfe waves and which don’t, creating your own high-probability Wolfe watchlist.
⚠️ Limitations & Disclaimer
Not all markets respect Wolfe Waves. Some FX pairs, metals, and indices respect the structure beautifully; others do not. Backtest and create your own shortlist.
No guaranteed sweeps. Many entries occur after a liquidity sweep of Wave 3, but not all. The algo is designed to detect Wolfe completion, not enforce textbook liquidity rules.
Probabilistic, not predictive. Wolfe setups don’t win every time. Always use risk management.
High-RR focus. This is not a high-frequency tool. It’s designed for precision, asymmetric setups where risk is small and reward potential is large.
✅ The Bottom Line
Apex Edge – Wolfe Wave Hunter is a modern reimagination of the Wolfe Wave. It blends structural geometry, liquidity dynamics, and algo-driven execution into a single tool that:
Detects the pattern automatically
Provides SL, entry, and TP levels
Offers alerts for hands-off trading
Allows deep customisation for different markets
When it hits, it delivers outstanding risk-to-reward. Backtest, refine your tolerances, and build your watchlist of assets where Wolfe structures consistently pay.
This isn’t just Wolfe detection — it’s Wolfe trading, rebuilt for the modern trader.
Developer Notes - As always with the Apex Edge Brand, user feedback and recommendations will always be respected. Simply drop us a message with your comments and we will endeavour to address your needs in future version updates.

SMC Structure SuiteSMC Structure Suite — BOS, CHOCH & Order Blocks
This indicator provides automated Smart Money Concepts (SMC) tools to help traders analyze market structure objectively. It is designed for traders who want to quickly identify shifts in price behavior without manually marking charts.
Core Features
Market Structure Recognition
Automatically detects Higher Highs (HH), Lower Lows (LL), Higher Lows (HL), and Lower Highs (LH). Detection uses a pullback validation mechanism to confirm swing structure.
BOS & CHOCH Detection
Identifies Break of Structure (BOS) for potential continuation and Change of Character (CHOCH) for possible reversals.
Order Block Highlighting
Marks bullish and bearish order blocks when confirmed by price action. Options allow choosing mitigation style (wick touch or body close). Blocks are hidden when invalidated.
Multi-Timeframe Analysis
Works on any timeframe. Historical analysis allows reviewing past structure.
Customizable Visuals
Colors, label positions, and background style can be adjusted for a clear chart.
Alert System
Alerts are provided for trend changes to monitor potential shifts in market direction in real time.
Disclaimer
This indicator is a tool to assist with chart analysis. It does not guarantee results and is not financial advice. Use appropriate risk management.

Killzones SMT + IFVG detectorKillzones SMT + IFVG Detector
Summary
This strategy implements a specific intraday workflow inspired by ICT-style concepts.
It combines:
Killzone session levels (recording untouched highs/lows)
SMT divergence between NQ and ES (exclusive sweep logic)
IFVG confirmation (3-bar imbalance + width filter + inversion guard)
and an optional smart exit engine
The components are not simply mashed together: they interact in sequence.
A setup only confirms if all conditions line up (time window → untouched level sweep → divergence → valid IFVG → confirmation candle → risk filter).
Workflow
Killzones & session levels
Tracks highs/lows inside default killzones (19:00–23:00, 01:00–04:00, 08:30–10:00, 11:00–12:00, 12:30–15:00, chart timezone).
Stores untouched levels forward; sweeps trigger candidate signals.
SMT divergence (exclusive sweep)
Bullish SMT : one index sweeps its low while the other remains above its session low.
Bearish SMT : one index sweeps its high while the other remains below its session high.
Detection supports “Sweep (Cross)” or “Exact Tick.”
Session IDs are tracked so once a side has fired, later re-touches can’t re-trigger .
IFVG confirmation
Locks the first valid 3-bar IFVG after SMT.
Confirmation requires a candle close beyond the IFVG boundary in the direction of the close.
IFVGs must meet a minimum width filter (default 1.0 point).
Inversion guard: ignores IFVGs already inverted before SMT.
Optional “re-lock” keeps tracking the latest IFVG until confirmation/expiry.
Smart exit engine
Initial stop from opposite wick (+ buffer).
Fixed TP (default 40 points).
Dynamic stop escalation at progress thresholds (BE → 50% → 80% of target).
Safety gates
Weekend lockout (Fri 16:40 → Sun 18:00).
Same-bar sweep of high & low cancels setups.
Max initial stop filter skips oversized setups.
Optional cooldown bars.
Alerts
SMT Bullish/Bearish : divergence detected this bar.
Confirm Long/Short : IFVG confirmation triggered.
Default Strategy Properties (used in screenshots/backtests)
Initial capital: $25,000
Order size: 1 contract
Commission: $1.25 per contract per side
Slippage: 2 ticks
Backtest window: Jun 16, 2025 – Sep 14, 2025
These settings are intentionally conservative. If you change them, your results will differ.
How to use
Apply on an NQ or ES futures chart (1–5 min).
Choose your killzones and detection mode.
Select confirmation symbol (NQ, ES, or “Sweeper”).
Enable/disable IFVG re-lock.
Review signals and use alerts for automation if desired.
Limitations
Strict filters reduce trade count; extend backtest window for more samples.
Works best on NQ/ES; not validated elsewhere.
Past performance is not indicative of future results.
This is an educational tool ; not financial advice.

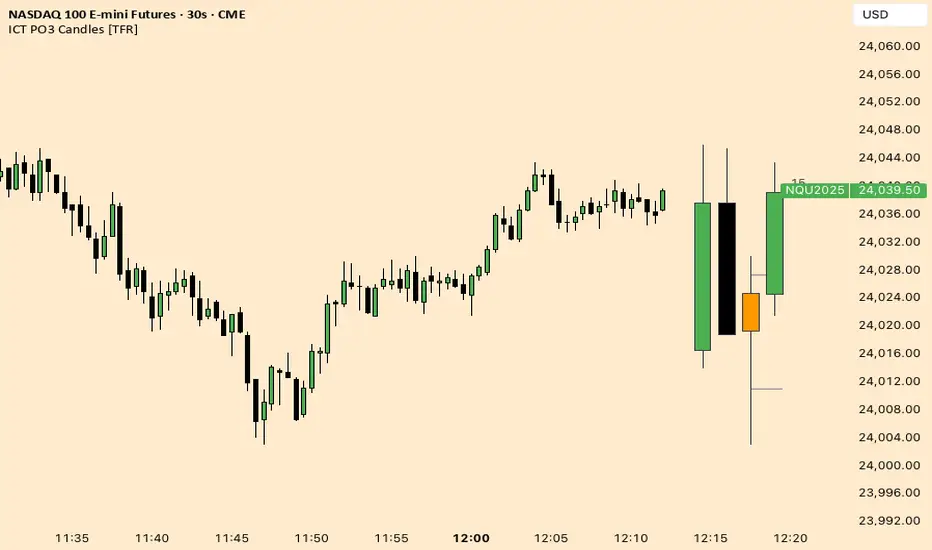
ICT Fractal HTF Candles [TFR]ICT HTF Fractal Candles
This indicator overlays higher timeframe (HTF) candles directly on your current chart for better multi-timeframe analysis. It plots up to the last 4 candles from a user-selected timeframe (5m, 15m, 1h, 4h, or 1D) with customizable body and border colors.
Features:
Displays the last 4 higher timeframe candles (open, high, low, close) on your current chart.
Customizable bullish, bearish, and inside close candle colors.
Optional midpoint wick lines (top and bottom) for precision reference, with extendable length for clarity.
Optional candle midpoint line for additional confluence.
Overlay mode allows you to see HTF structure without switching chart timeframes.
Timeframe label display so you always know which HTF is being plotted.
Offset control for shifting candle position.
Use Case:
This tool helps traders apply ICT concepts like PO3, midpoint reference levels, and multi-timeframe confirmation without constantly switching between charts. It’s particularly useful for identifying liquidity zones, midpoint reactions, and higher timeframe market structure while executing on a lower timeframe.
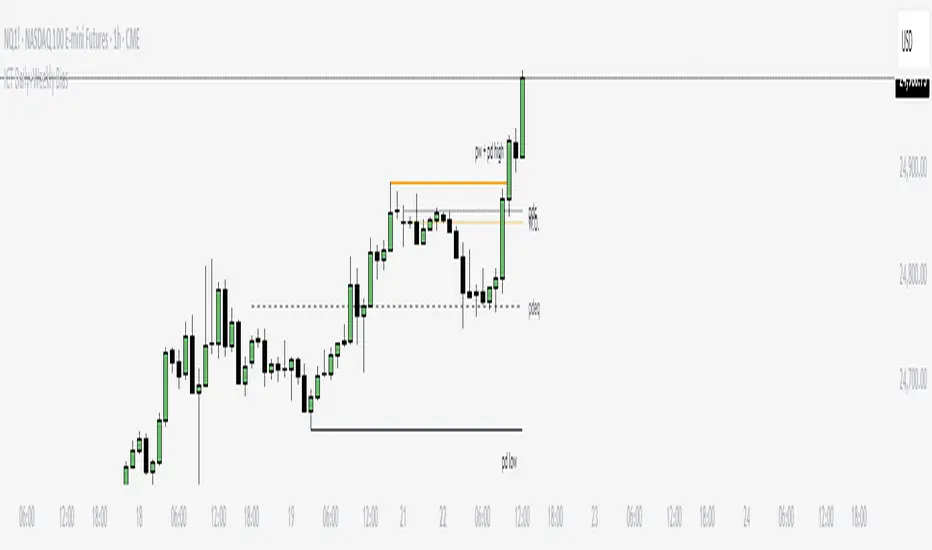
ICT Daily+Weekly BiasPrevious Day & Week Levels — Daily+Weekly Bias Visualizer
Plots previous-day (PDH/PDL/PDEQ) and previous-week (PWH/PWL) reference levels.
Use them to frame bias and identify the Draw on Liquidty.
Definitions
• PDH/PDL: Prior day high/low.
• PDEQ: Prior day equilibrium = (PDH + PDL) / 2.
• PWH/PWL: Prior week high/low.
Features
• PDH/PDL lines with optional labels at left or right edge.
• PDEQ line (0.5 of PD Range) with optional label.
• PWH/PWL lines with optional labels.
• Custom colors, styles, and width controls.
• Optional Price Labels
• Timeframe visibility limit.
• Lines extend and stop on mitigation (when breached).
*Also included in ICT ULT (All In One) Indicator
*Feel free to suggest improvement in the comments
ICT NDOG/NWOGICT NDOG / NWOG — Opening Gap Visualizer
Plots daily (NDOG) and weekly (NWOG) opening gaps.
An opening gap is the price range between the previous close and the new session’s open.
Features:
• Optional border lines at gap high/low.
• Optional Consequent Encroachment line (50%).
• Optional Quadrant lines (25% and 75%).
• Color customization
• Custom NDOG and NWOG amount (separated)
*Also included in ICT ULT (All In One) Indicator
*Feel free to suggest improvement in the comments

SMC ToolBox [WinWorld]👋 INTRODUCTION
SMC ToolBox indicator is not just a simple indicator, but rather a collection of SMC-related algorithms, that our teams has found to make the most profound impact on determination process of the most high-quality liquidity zones and points of interests ( further – POIs ), hence the name of the indicator – Tool Box (and it also sounds cool :) .
From candle patterns to complex orderflow detection algorithm, ToolBox indicator will help any trader with search for useful tools, solving the needs from confirming position entry levels to trend-following and mean reversion opportunities.
❓ WHY DID WE BUILD THIS?
This indicator was initially built for our team's internal use for the sole purpose of gathering all actively used non-structure-related algorithms* in one place, so we could have only the tools that are truly needed at hand at any point of time. After we showed this tool to our trading partners, they were surprised about how light, fast and useful ToolBox was and they advised us on sharing this with our community and, after giving it a proper thought, we decided to follow their advice.
Funnily enough , after researching TradingView's open-source script library, we haven't found even one instance of even remotely alike indicators, so it fair to say that we are one of the first people to release this kind of SMC-related indicator bundles on the market and we strongly that TradingView's community will find this tool of use.
🤷♂️ WHY SHOULD YOU CARE AT ALL?
Frankly speaking, we are not the first people to build our own algorithms of such popular indicators like Equal Highs and Lows (EQHL), Previous Day High Low (PDHL), Orderflow (OF) and etc., but we are definitely one of the first teams to implement these indicators with the help of algorithms, that are actually used by the most professional traders on YouTube and other social media trading influencers. Simply taking trades from our SCOBs, OFs, EQHLs and etc. won't print you millions overnight, but what these algos will do is help you with being aware of is potentially laying ahead of you with a very clean probability.
Why does it matter? It simple: better market awareness gives you an edge over other trades, which use old algorithms, which are clearly outdated, so beating such traders in the long run is just a game of time for you, so good algorithms do matter. Each indicator inside ToolBox is there to help you develop this market awareness and forge your edge bit by bit.
Now let's talk about what is inside the ToolBox.
🔍 OVERVIEW
At the moment of publishing ToolBox contains 8 indicators, so say "Hello" to:
Price Border Bands (further – PBB) ;
Ordeflow (further – OF) ;
Equal Highs & Lows (further – EQHL) ;
Previous Day High & Low ( further – PDHL) ;
Single Candle Order Block (further – SCOB) ;
Institutional Funding Candle (further – IFC) ;
Engulfing Candle (further – EC) ;
Inside Bars (further – IB) .
Some of them you may know, some of them you may not, so let's review each of them one by one.
📍 INDICATOR: Price Border Bands (PBB)
Price Border Bands indicator is a simple yet useful algorithm, based on Triangular Moving Average (TMA), which helps determine extreme price spikes, which on average act as meaningful mean reversion opportunities. It also is a good an effective "verifier" of POIs and zones of interest (further – ZOI) .
We advise on using this indicator this way:
Look for price going beyond upper or lower band of PBB;
Look for price reaching POI or ZOI;
Start searching for your entry point.
The most common sign of potential price reversal, which PBB searches for, is intense price spike, which signals about "liquidity clearing" or, in simple terms, manipulation .
Manipulation of the price inside the POI or price being "stopped" by POI is a screaming sign of the potentional following reversal. See the example of such situation on the screenshot below:
Additionally we need to talk about trend filter inside PBB, which colours the bars on the chart under certain conditions. If bars on the chart are being coloured in gray – this is your sign to stop trading on this asset? because there is risk to catch an uncomfortably big price spike, which might turn the '+' of your position's PnL in to '-'. See the example of PBB highlighting bar's of risky price zone in gray colour on the screenshot below:
In order to continue trading you need to wait for bars to stop being coloured in gray OR confirm the fact that price made Change of Character (ChoCh) in reverse to the previous direction of price, which was marked as risky by PBB.
And last but not least: if you see POI being reach by price inside the bands of PBB, then consider this POI weak and avoid trading it. See the example of weak POI inside PBB bands on the screenshot below:
📍 INDICATOR: Orderflow (OF)
Orderflow indicator is an algorithm, which detects Sell-to-Buy (furthert – STB) or Buy-to-Sell (further – BTS) manipulations, using the algorithm of impulse & correction price movement detection, taken from one of our previously built indicators – Impulse Correction SCOB Mapper (ICSM) .
Let's explain the terms from above:
Impulse – series of bars, each bar of which consecutively updated previous bar's high and then last candle broke previous bar's low ;
Correction – series of bars, each bar of which consecutively updated previous bar's low and then last candle broke previous bar's high ;
STB – a type of price manipulation, which can be described as a correction of price inside global upward movemnt;
BTS – a type of price manipulation, which can be describd as a impulse of price inside global downward movement.
Unlike traditional order blocks, which are often narrower and more selective, Orderflow zones cover a wider price range and present a higher probability of mitigation. This makes them more reliable for entries in ovaerage in comparison to classic orderblocks.
Let's review examples of bullish and bearish orderflows on the screenshots below:
Bullish orderflows (STBs) (blue boxes with "OF" text inside)
Bearish orderflows (BTSs) (orange boxes with "OF" text inside)
The usage of ZOIs, detected by OF algorithm, is pretty straightforward: take trades against the ordeflow block, that price has reached. Even though we don't recommend relying on Orderflow blocks as sole producers of signals, you can use them as such in way, that can be described like this:
Place stop-loss (SL) beyond the furthest border of OF block (bottom of the bullish OF or top of the bearish OF), that price has reached;
Aim for >2:1 RR ratio and place your take-profit (TP) accordingly.
You can see the example setups of OF blocks as signal producers on the screenshots below:
Examples of LONG trades, taken from price reaching bullish OF block.
Examples of SHORT trades, taken from price reaching bearish OF block.
Summarising, Orderflow can be described as a tool that helps determine the STB and BTS price manipulations, which are great price ZOIs and can be used both as confirmation tools for your exisiting signals and sole signal producers, in which case such they needed to be handled extra mindfully and preferrably bonded with other tools for additional confirmation. We personally recommend using Ordeflow as confirmation tool, because ZOIs, detected by Orderflow, are usually the price ranges, around which traders tend to place their stop-losses, which only gives more strength to these zones for supporting the price and helps traders with "trading from support/resistance" strategies gain additional edge.
📍 INDICATOR: Equal Highs & Lows (EQHL)
EQHL indicator is an algorithm, which scans the extremums of impulse and correction movements, detected by our ICSM indicator , and marks ones which are roughly or equaly placed on the same price levels. Equal highs (further – EQH) and equal lows (further – EQL) are local liquidity pools, where stop orders and resting orders cluster; price often gravitates to these zones for liquidity “top-ups,” after which a reaction or continuation to the next liquidity source may occur. Basically, EQHL algorithm highlights clusters of equal extremes as navigational anchors for “collect → react → confirm” scenarios.
Talking about usage, we advise to not take swept or reached EQHLs as entries by themselves. Evaluate them alongside HTF structure, Inducement (IDM), orderblocks (OB), orderflow (OF), candle pattern context (e.g., IFC/EC) on the LTF and etc. Intended usage scenario of this algorithm is something like this:
Price reaches EQH/EQL;
Price hangs around the reached EQH/EQL;
Another tool (for example, OF or OB) signals about price reversals from the level of reached EQH/EQL;
Trader starts looking for an entry.
See the examples of EQHLs, which algorithms maps on the chart, on the screenshots below:
Equal Lows (EQLs)
Equal Highs (EQHs)
📍 INDICATOR: Previous Day High & Low (PDHL)
PDHL indicator is an algorithm, princples of work of which can be derived from its name: algorithm tracks previous day's high and low and displays it on the chart.
Previous day's high and low are fundamental POIs in any financial market, which are traded not only by SMC traders, but by many other traders, especially by traders, which consider these POIs are one of the most crucial, because they usually highly liquidity-rich and can signal about wondeful reversal opportunities.
We expect traders to use PDHL algorithm as confirmation tool when trading by mean reversion strategies. Usage of PDHL as signal source is advised against, but traders are free to experiment nevertheless.
PDHL algorithm shows two types of PDHLs on the chart: active PDHL (solid line) and swept PDHL (dashed line) . You can the examples of PDHLs, detected by our algorithm, on the screenshot below:
📍 INDICATOR: Single Candle Order Block (SCOB)
SCOB indicator is an algorithm, which marks a very specific POIS, which are based on of the most simple yet highly profound SMC and candle pattern principles and are usually a good alternative for classic orderblocks.
Principles of SCOB detection are very simple:
Price sweeps previous candle's extremum (high/low). So called "liquidity sweep" ;
Immediately after step 1 price forms a fair value gap (FVG).
You can see basic examples of bearish and bullish SCOBs on the screenshot below:
As a matter of fact, SCOB can be used both as a confirmation tool and source of signals. However! To be a source of signals, SCOB is most suitable to be used while trading on lower timeframe (LTF), while trading on a higher timeframe (HTF) on average requires to look at SCOB as a POI rather than as independent source of signals. That being said, we would like additionally to point out, that due to the nature of SCOB being an orderblock, this tool by its nature is best suitable as confirmation tool and we expect traders to use it as such, but either way this indicator is quite multifunctional and can be used by each trader for a more specific purposes.
SCOBs, which are detected by our algorithm, are painted on the chart either as coloured candles (SCOBs without inside bars) or coloured boxes (SCOBs with inside bars) . You can see examples of SCOBs, which were detected by our SCOB algorithm, on the screenshot below:
📍 INDICATOR: Institutional Funding Candle (IFC)
IFC is a candle, which is a more strict version of SCOB. Our algorithms detects an IFC, if SCOB satisfies these conditions:
SCOB candle has large shadow (more than 50% of candle's body);
SCOB candle has large range ( | high - low | is more than a certain value, which is base on ATR).
That's basically it! Being simple as that, IFC represents itself as a high-trust SCOB, which on average has larger chance of reversing price when IFC candle is reached by it and our practice shows that it is indeed the case. IFC candles are usually go hand in hand with large price and volume spikes, which are believed to be caused by large institutional players, who trading eager to catch retail trader's stop orders, which they usually place around POIs like IFC and SCOB.
We expect traders to use IFC as a tool for entry confirmation bias, especially when considering IFC from HTF.
You can see IFC, which our algoritms detects on the chart, on the screenshot below:
📍 INDICATOR: Engulfing Candle (EC)
An Engulfing Candle is a candle, which occurs when the current candle’s body engulfs the prior candle’s body, showing a short-term shift in demand/supply balance. In SMC context, it is most useful around POIs/liquidity as a contextual confirmation element. The indicator marks bullish and bearish EC without implying a “must reverse” outcome – it’s a focus cue, not a promise.
As with any other alike tool, this algorithm should not be used as sole source of signals, but rather as a confirmation tool. ECs near support/resistance zones or POIs are typically more impactufl than those inside choppy consolidations. Structural and LTF price impulse confirmation usually enhances existing position bias in a positive way.
You can see examples of engulfing candles on the screenshots below:
Bullish engulfing candles
Bearish engulfing candles
📍 INDICATOR: Inside Bars (IB)
Inside Bars are bars, which are contained inside the range of high and low prices of the bars preceding them. This algorithm was designed to showcase periods of potential price consolidation/volatylity compression and quite often precedes price movement towards closest liquidity POIs and ZOIs. When price finally breaks out of its previous range, it usually provides good opportunities for entering trades using breakout strategies (especially ones, that are based on SMC principles) .
You can see examples of IBs, which are detected by our algorithm on the chart, on the screenshot below:
That was a long list of features, now let's talk about settings now.
🔔 WHAT ABOUT ALERTS?
At the moment of publishing this indicator includes alerts for all algorithms, which are included inside, except for Inside Bars (IB) algorithm .
⚙️ SETTINGS
At the moment of publishing most of the settings in this indicator are about styling for indicator's visuals, because by design most of the included algorithms (excluding PBB) don't rely on inputs of any technical kind. Let's review them.
ToolBox | General Styling
Text Size – (Tiny, Small, Normal, Large) – defines text size of indicator's visuals, which use text-based visuals.
Price Border Bands | Main Settings
Show Price Border Bands – toggles on/off the display of PBB;
Half Length – defines amount of bars, used for calculation of the PBB's TMA;
Price Source – defines price source for PBB's TMA;
ATR Multiplier – affects the width of PBB's bands;
ATR Period – affects the amount of bars for ATR calculation.
Orderflow (OF) | Settings
Bullish OF – toggles on/off the display & colour of bullish OF;
Bearish OF – toggles on/off the display & colour of bearish OF;
Show border – toggles on/off the display of OF blocks' border.
Single Candle Order Block (SCOB) | Settings
Show SCOB – toggles on/off the display of SCOB;
Bullish – toggles on/off the colour of bullish SCOB;
Bearish – toggles on/off the colour of bearish SCOB.
Equal High/Lows (EQHL) | Settings
Show EQH/EQL – toggles on/off the display of PDH/PDL;
EQH – toggles on/off the colour of EQH;
EQL – toggles on/off the colour of EQL.
Institutional Funding Candle (IFC) | Settings
Show IFC – toggles on/off the display of IFC;
Bullish – toggles on/off the colour of bullish IFC;
Bearish – toggles on/off the colour of bearish IFC.
Previous Day High & Low (PDHL) | Settings
Show PDH/PDL – toggles on/off the display of PDH/PDL;
Show PDH/PDL – toggles on/off the display of the past history of swept PDH/PDL;
Show previous day divider – toggles on/off the display of dashed gray line, which separates new day from previous one;
Bullish – toggles on/off the colour of bullish IFC;
Bearish – toggles on/off the colour of bearish IFC.
Engulfing Candle (EC) | Settings
Show engulfing candles – toggles on/off the display of EC;
Bullish – toggles on/off the colour of bullish EC;
Bearish – toggles on/off the colour of bearish EC.
Inside Bars (IB) | Settings
Show inside bars – toggles on/off the display of IB;
Bullish – toggles on/off the colour of bullish IB;
Bearish – toggles on/off the colour of bearish IB.
Alerts | POI
Alert Frequency – (Once Per Bar, Once Per Bar Close) – defines alert frequency of the indicator's alert for all POIs;
* all other buttons from this group of settings toggle alerts on/off.
PBB;
OF;
SCOB;
EQH;
EQL;
IFC;
PDH;
PDL;
EC.
🏁 AFTERWORD
SMC ToolBox indicator is designed to be the ultimate swiss knife, which might bring you quantifiable results when trying to crack the market's secret of where the liquidity is placed. This indicator doesn't produce any particular signals not it gives any financial advice, but it helps you deepen understanding about potential existing liquidity zones and price points by employing principles of SMC algorithms, which are most commonly used by retail traders on a daily basis.
You can view this indicator as a Christmas candy box: you pick only the candles (indicators) you need and want. We expect any trader to use this indicator by exactly same way: you should take onlt the things you need to enhance your strategy, not worrying about what to do with other indicators, fi they don't suit you.
Lastly, we would like to share our team's recommendations (they are optional, of course) on how to use certain POIs from ToolBox:
Use PBB as a filter for validating POis. Pay close attention to the rule "don't trade POIs, which are located inside the bands of PBB" (described above in "INDICATOR: PBB") ;
Use Orderflow to find short-term and mid-term trading opportunitions for trend-following strategies, using OF blocks as resistance in bearish trend and support in bullish trend;
Use EQHL and PDHL indicators when trading by mean-reversion strategies on intraday timeframes. These indicators will be especially of use to forex, stock and crypto traders;
Use SCOB and IFC indicators when trading by mean-reversion strategy to find short-term reversal opportunities;
Use ECs and IBs as confirmation/denial tools for your entry ideas. We recommend avoiding trading If price is currently going inside HTF's IB range.
We have no doubts that SMC ToolBox indicator will be of use to any trader, who employs and desire to employ SMC principles in his strategy. We will be waiting for your feedback, meanwhile you can ask your questions in the comments :)
Sincerely,
WinWorld team.

Smart Money Footprint & Cost Basis Engine [AlgoPoint]Smart Money Footprint & Cost Basis Engine
This indicator is a comprehensive market analysis tool designed to identify the "footprints" of Smart Money (institutions, whales) and pinpoint high-probability reaction zones. Instead of relying on lagging averages, this engine analyzes the very structure of the market to find where large players have shown their hand.
How It Works: The Core Logic
The indicator operates on a multi-stage confirmation process to identify and validate Smart Money zones:
Smart Money Detection (The Trigger): The engine first scans the chart for signs of intense, urgent buying or selling. It does this by identifying Fair Value Gaps (FVGs) created by large, high-volume Displacement Candles. This is our initial Point of Interest (POI).
Cost Basis Calculation (The Average Price): Once a potential Smart Money move is detected, the indicator calculates the Volume-Weighted Average Price (VWAP) for that specific move. This gives us a highly accurate estimate of the average price at which the large players entered their positions.
Historical Confirmation (The "Memory"): This is the indicator's most unique feature. It checks its historical database to see if a similar Smart Money move (in the same direction) has occurred in the same price area in the past. If a match is found, the zone's significance is confirmed.
Verified Cost Basis Zone (The Final Output): A zone that passes all the above checks is drawn on the chart as a high-probability Verified Cost Basis Zone. These are the "memory zones" where the market is likely to react upon a re-visit.
How to Use This Indicator
Cost Basis Zones (The Boxes):
Green Boxes: Bullish zones where Smart Money likely accumulated positions. When the price returns here, a BUY reaction is expected.
Red Boxes: Bearish zones where Smart Money likely distributed positions. When the price returns here, a SELL reaction is expected.
Zone Strength (★★★): Each zone is created with a star rating. More stars indicate a higher-confidence zone (based on factors like volume intensity and historical confirmation).
BUY/SELL Signals: A signal is only generated when the price enters a zone AND the confirmation filters (if enabled in the settings) are passed.
Zone Statuses:
Green/Red: Active and waiting to be tested.
Gray: The zone has been tested, and a signal was produced.
Dark Gray (Invalidated): The zone was broken decisively and is no longer considered valid support/resistance.
Key Settings
Signal Accuracy Filters: You can enable/disable three powerful filters to balance signal quantity and quality:
Momentum Confirmation (Stoch): Waits for momentum to align with the zone's direction.
Candlestick Confirmation (Engulfing): Waits for a strong reversal candle inside the zone.
Lower Timeframe MSS Confirmation: The most advanced filter; waits for a trend shift on a lower timeframe before giving a signal.
Historical Confirmation:
Require Historical Confirmation: Toggle the "Memory" feature on/off. Turn it off to see all potential SM zones.
Tolerance Calculation Method: Choose between a dynamic ATR Multiplier (recommended for all-around use) or a fixed Percentage to define the zone size.

SMC Suite - OB . Breaker . Liquidity Sweep . FVGSMC Suite — Order Blocks • Breaker • Liquidity Sweep • FVG
What it does:
Maps institutional SMC structure (OB → Breaker flips, Liquidity Sweeps, and 3-bar FVGs) and alerts when price retests those zones with optional r ejection-wick confirmation .
Why this isn’t “just a mashup”?
This tool implements a specific interaction between four classic SMC concepts instead of only plotting them side-by-side:
1. OB → Breaker Flip (automated): When price invalidates an Order Block (OB), the script converts that zone into a Breaker of opposite bias (bullish ⇄ bearish), extends it, and uses it for retest signals.
2. Liquidity-Gated FVGs : Fair Value Gaps (3-bar imbalances) are optionally gated—they’re only drawn/used if a recent liquidity sweep occurred within a user-defined lookback.
3. Retest Engine with Rejection Filter : Entries are not whenever a zone prints. Signals fire only if price retests the zone, and (optionally) the candle shows a rejection wick ≥ X% of its range.
4. Signal Cooldown : Prevents spam by enforcing a minimum bar gap between consecutive signals.
These behaviors work together to catch the sequence many traders look for: sweep → impulse → OB/FVG → retest + rejection.
Concepts & exact rules
1) Impulsive move and swing structure
• A bar is “ impulsive ” when its range ≥ ATR × Impulsive Mult and it closes in the direction of the move.
• Swings use Pivot Length (lenSwing) on both sides (HH/LL detection). These HH/LLs are also used for sweep checks.
2) Order Blocks (OB)
• Bullish OB : last bearish candle body before an i mpulsive up-move that breaks the prior swing high . Zone = min(open, close) to low of that candle.
• Bearish OB : last bullish candle body before an impulsive down-move that breaks the prior swing low . Zone = high to max(open, close).
• Zones extend right for OB Forward Extend bars.
3) Breaker Blocks (automatic flip)
If price invalidates an OB (closes below a bullish OB’s low or above a bearish OB’s high), that OB flips into a Breaker of opposite bias:
• Invalidated bullish OB → Bearish Breaker (resistance).
• Invalidated bearish OB → Bullish Breaker (support).
Breakers get their own style/opacity and are used for separate Breaker Retest signals.
4) Liquidity Sweeps (decluttered)
• Bullish sweep : price takes prior high but closes back below it.
• Bearish sweep : price takes prior low but closes back above it.
Display can be tiny arrows (default), short non-extending lines, or hidden. Old marks auto-expire to keep the chart clean.
5) Fair Value Gaps (FVG, 3-bar)
• Bearish FVG : high < low and current high < low .
• Bullish FVG : low > high and current low > high .
• Optional gating: only create/use FVGs if a sweep occurred within ‘Recent sweep’ lookback.
6) Retest signals (what actually alerts)
A signal is true when price re-enters a zone and (optionally) the candle shows a rejection wick:
• OB Retest LONG/SHORT — same-direction retest of OB.
• Breaker LONG/SHORT — opposite-direction retest of flipped breaker.
• FVG LONG/SHORT — touch/fill of FVG with rejection.
You can require a wick ratio (e.g., bottom wick ≥ 60% of range for longs; top wick for shorts). A cooldown prevents back-to-back alerts.
How to use
1. Pick timeframe/market : Works on any symbol/TF. Many use 15m–4h intraday and 1D swing.
2. *Tune Pivot Length & Impulsive Mult:
• Smaller = more zones and quicker flips; larger = fewer but stronger.
3. Decide whether to gate FVGs with sweeps : Turn on “Require prior Liquidity Sweep” to focus on post-liquidity setups.
4. Set wick filter : Start with 0.6 (60%) for cleaner signals; lower it if too strict.
5. Style : Use the Style / Zones & Style / Breakers groups to set colors & opacity for OB, Breakers, FVGs.
6. Alerts : Add alerts on any of:
• OB Retest LONG/SHORT
• Breaker LONG/SHORT
• FVG LONG/SHORT
Choose “Once per bar close” to avoid intrabar noise.
Inputs (key)
• Swing Pivot Length — swing sensitivity for HH/LL and sweeps.
• Impulsive Move (ATR ×) — defines the impulse that validates OBs.
• OB/FVG Forward Extend — how long zones project.
• Require prior Liquidity Sweep — gate FVG creation/usage.
• Rejection Wick ≥ % — confirmation filter for retests.
• Signal Cooldown (bars) — throttles repeated alerts.
• Display options for sweep marks — arrows vs short lines vs hidden.
• Full color/opacity controls — independent palettes for OB, Breakers, and FVGs (fills & borders).
What’s original here
• Automatic OB → Breaker conversion with separate retest logic.
• Liquidity-conditioned FVGs (FVGs can be required to follow a recent sweep).
• Unified retest engine with wick-ratio confirmation + cooldown.
• Decluttered liquidity visualization (caps, expiry, and non-extending lines).
• Complete styling controls for zone types (fills & borders), plus matching signal label colors.
🔹 Notes
• This script is invite-only.
• It is designed for educational and discretionary trading use, not as an autotrader.
• No performance guarantees are implied — always test on multiple markets and timeframes.

20/40/60Displays three consecutive, connected range boxes showing high/low price ranges for customizable periods. Boxes are positioned seamlessly with shared boundaries for continuous price action visualization.
Features
Three Connected Boxes: Red (most recent), Orange (middle), Green (earliest) periods
Customizable Positioning: Set range length and starting offset from current bar
Individual Styling: Custom colors, transparency, and border width for each box
Display Controls: Toggle borders, fills, and line visibility
Use Cases
Range Analysis: Compare volatility across time periods, spot breakouts
Support/Resistance: Use box boundaries as potential S/R levels
Market Structure: Visualize recent price development and trend patterns
Key Settings
Range Length: Bars per box (default: 20)
Starting Offset: Bars back from current to position boxes (default: 0)
Style Options: Colors, borders, and visibility controls for each box
Perfect for traders analyzing consecutive price ranges and comparing current conditions to recent historical periods.

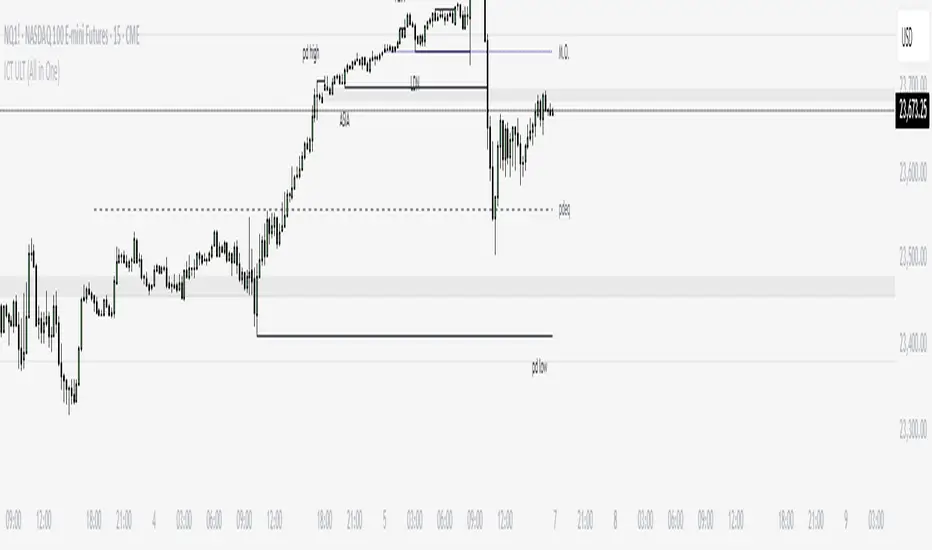
ICT ULT
This indicator is for lazy people like me who want to automate the process of marking certain ICT key levels using the indicator's features, such as:
Custom Killzone/Session Liquidity Levels in form of Highs and Lows
Killzone Drawings (Boxes)
Previous Day High/Low (PDH/PDL)
Previous Day Equlibrium (PDEQ)
Previous Week High/Low
New Day/Week Opening Gaps (NDOG/NWOG)
Custom Opening Prices (horizontal) (e.g. Midnight Open)
Custom Timestamps (vertical)
*Note: All features are completely customizable
inspired by: @tradeforopp
ICT Session High/Low LevelsThis indicator automatically plots the Highs and Lows of completed sessions and draws lines for the Asian session and London session. Levels are displayed only after each session has closed. A simple tool for liquidity work and intraday context (SMC/ICT).

BOS & CHoCH (v6, UA)The logic of the trading strategy
This is a well-structured and concise summary of a trading strategy based on market structure analysis. Here is the English translation.
Swings
ta.pivothigh/low on a selected structure timeframe (TF). When a swing is confirmed, we fix the level and the bar_index of the current chart as an anchor for a horizontal line.
BOS (Break of Structure)
A breakout of the last Swing High (SH) or Swing Low (SL) in the direction of the current trend.
CHoCH (Change of Character)
A breakout against the trend, signaling a potential trend reversal.
Breakout
By close or by high/low (you can switch the breakout confirmation mode to closing price).

IFVG by Toño# IFVG by Toño - Pine Script Indicator
## Overview
This Pine Script indicator identifies and visualizes **Fair Value Gaps (FVG)** and **Inverted Fair Value Gaps (IFVG)** on trading charts. It provides advanced analysis of price inefficiencies and their subsequent inversions when mitigated.
## Key Features
### 1. Fair Value Gap (FVG) Detection
- **Bullish FVG**: Detected when `low > high ` (gap between current low and high of 2 bars ago)
- **Bearish FVG**: Detected when `high < low ` (gap between current high and low of 2 bars ago)
- Visual representation using colored rectangles (green for bullish, red for bearish)
### 2. Inverted Fair Value Gap (IFVG) Creation
- **IFVG Formation**: When a FVG gets mitigated (price fills the gap with candle body), an IFVG is created
- **Color Inversion**: The IFVG takes the opposite color of the original FVG
- Mitigated bullish FVG → Creates red (bearish) IFVG
- Mitigated bearish FVG → Creates green (bullish) IFVG
- **Mitigation Logic**: Uses only candle body (not wicks) to determine when a FVG is filled
### 3. Customizable Display Options
- **Show Normal FVG**: Toggle visibility of regular Fair Value Gaps
- **Show IFVG**: Toggle visibility of Inverted Fair Value Gaps
- **Smart FVG Display**: Even when "Show Normal FVG" is disabled, FVGs that are part of IFVGs remain visible
- **Extension Control**: Option to extend FVGs until they are mitigated
### 4. IFVG Extension Methods
- **Full Cross Method**: IFVG remains active until price completely crosses through it (including wicks)
- **Number of Bars Method**: IFVG remains active for a specified number of bars (1-100)
### 5. Visual Mitigation Signals
- **Cross Markers**: Shows X-shaped markers when IFVGs are mitigated
- Green cross above bar: Bearish IFVG mitigated
- Red cross below bar: Bullish IFVG mitigated
### 6. Comprehensive Alert System
- **IFVG Formation Alerts**: Notifications when new IFVGs are created
- **IFVG Mitigation Alerts**: Notifications when IFVGs are filled/mitigated
- **Separate Controls**: Individual toggles for bullish and bearish IFVG alerts
## How It Works
### Step-by-Step Process:
1. **FVG Detection**: Script continuously scans for 3-bar patterns that create price gaps
2. **FVG Tracking**: Each FVG is stored with its coordinates, type, and status
3. **Mitigation Monitoring**: Script watches for candle bodies that fill the FVG
4. **IFVG Creation**: Upon mitigation, creates an IFVG with opposite polarity at the same location
5. **IFVG Management**: Tracks and extends IFVGs according to chosen method
6. **Visual Updates**: Dynamically updates colors and visibility based on user settings
## Use Cases
- **Support/Resistance Analysis**: IFVGs often act as strong support/resistance levels
- **Market Structure Understanding**: Helps identify how market inefficiencies get filled and reversed
- **Entry/Exit Timing**: Can be used to time entries around IFVG formations or mitigations
- **Confluence Analysis**: Combine with other technical analysis tools for stronger signals
## Configuration Parameters
- **Colors**: Customizable colors for bullish/bearish FVGs and IFVGs
- **Extension**: Choose how long to display gaps on the chart
- **Alerts**: Full control over notification preferences
- **Visual Clarity**: Options to show/hide different gap types for cleaner charts
## Technical Specifications
- **Pine Script Version**: 5
- **Overlay**: True (displays directly on price chart)
- **Max Boxes**: 500 (supports up to 500 simultaneous gaps)
- **Performance**: Optimized array management for smooth operation
This indicator is particularly valuable for traders who use **Smart Money Concepts (SMC)** and **Inner Circle Trader (ICT)** methodologies, as it provides clear visualization of how institutional order flow creates and fills market inefficiencies.

ChrisFe SMC Full Tool (EMA 200 + VWAP)🚀📊 SMC Killzone Pro Indicator — Complete, smooth & 100% customizable
💡 Designed for demanding traders: clear display, soft colors, no aggressive elements.
⚙️ Everything is fully customizable: enable/disable each module, change colors, choose exactly what to display.
🔹 SMC Killzone Pro by Chris Foe
Based on Smart Money Concepts, this indicator blends aesthetics & performance.
✨ Features included:
📅 Sessions – Asia, London, New York (precise time zones)
🎯 Custom Killzones – Refine your entry timing
📈 Dynamic VWAP + adjustable MA
🔍 Key Levels – PDH, PDL, PWH, PWL, MID, Daily/Weekly Open
⚡ Optimized display – Hides unnecessary zones on higher TFs
🎨 Full customization – Colors, transparency, styles…
💎 Why choose it?
✔️ Professional power with a smooth & intuitive interface
✔️ Works on all timeframes – from M1 to H4, always clean & efficient

Apex Edge – Liquidity RaiderApex Edge – Liquidity Raider
The Predator That Hunts Where Retail Never Looks
The Liquidity Raider is not your average liquidity line plotter.
This is an institutional-grade hunting system that tracks the pools of liquidity Smart Money algos stalk — and tells you exactly when price is circling in for the strike.
Where most retail tools simply mark lines, this one acts like a predator:
Scans the chart dynamically to detect clustered highs & lows (pivot-based liquidity zones).
Filters noise with sensitivity & price rounding so you only get real liquidity levels — not every random swing.
Plots live BSL (Buy-Side Liquidity) & SSL (Sell-Side Liquidity) lines in clean dotted format.
Auto-deletes levels when swept, so your chart stays clean and focused.
Triggers directional arrows when price comes within your specified % distance to the target liquidity pool — before the market moves.
EMA confluence layer lets you align with institutional flow (customizable Fast & Slow EMAs).
Core Power
Cluster Logic – Finds high-probability liquidity zones using repeated pivot levels.
Sweep Awareness – Lines vanish the moment liquidity is taken, keeping focus on the next pool.
Proximity Strike Detection – Arrow signals only when price is within striking range.
Directional Clarity – Red arrows = targeting BSL, Green arrows = targeting SSL.
Scalable Across Timeframes – Adapts to your chart’s timeframe with dynamic lookback scaling.
Institutional Flow Filter – Optional EMA confirmation keeps you aligned with the real trend.
How to Use
Identify liquidity pools – Dotted green = buy-side, dotted red = sell-side.
Watch proximity arrows – These mean price is in range and hunting that pool.
Align with EMA bias – Enter only in the direction of institutional momentum.
Target the sweep – Your take profit is where the liquidity is resting.
Why Liquidity Raider Wins
This is not a lagging signal system.
It’s a real-time, clean, predictive tool designed to mimic the targeting logic of high-frequency algos.
By removing swept levels and focusing only on the next available pools, Liquidity Raider keeps you one step ahead of the crowd — and perfectly positioned for the kill shot.

Session Liquidity [TakingProphets]Session Liquidity
Session Liquidity maps the intraday landscape that ICT/SMC traders care about: each session’s high/low prints, key opens (Midnight, True Day/6PM, 8:30), and prior period reference levels (Previous Week/Day and optional Mon/Tue/Wed). It auto-draws and extends clean horizontal levels, updates them live, and optionally preserves “mitigated” tags so you can review what price consumed. To keep charts readable, overlapping labels at the same price are merged into a single combined label (e.g., LON.H + PDH + PWH) with smart anti-overlap placement.
What it does (at a glance)
– Tracks Asia, London, NY AM, NY Lunch, and NY PM session highs/lows in your chosen timezone (default America/New_York).
– Draws key opens: Midnight Open, True Day Open (6 PM), and 8:30 Open.
– Plots Previous Week High/Low (PWH/PWL) and Previous Day High/Low (PDH/PDL) with optional Mon/Tue/Wed references.
– Live extension: lines extend to the current bar; when a level is traded through you can either remove it or keep a left-anchored “mitigated” label.
– Combined labels: when multiple levels share the same price, the script shows one label listing all tokens (e.g., LON.L + PWL).
– Timeframe governor: a Timeframe Limit hides drawings on higher resolutions to avoid clutter (e.g., show on ≤ 30 min only).
– Styling controls: per-feature colors, dotted/dashed/solid styles, and label size/position (session labels left/center/right logic handled via label types and offsets).
How it works:
– Sessions are defined with TradingView’s session input strings. While you are “in session,” the script updates running highs/lows and stores their bar indices. When the session closes, it freezes the prints and draws two horizontal lines: one at the session high (token “ASIA.H”, “LON.H”, “NYAM.H”, “NYLU.H”, “NYPM.H”) and one at the session low (“…L”).
– Prior period levels come from higher-timeframe requests: Previous Week’s High/Low from W, Previous Day from D (plus Mon/Tue/Wed using simple daily offsets). New periods wipe and redraw lines/labels cleanly.
– Key opens are stamped exactly when they occur (00:00 for Midnight, 18:00 for True Day, 08:30 for the print), then extended forward.
– Mitigation logic: if price trades beyond a level, either remove it entirely (Show Mitigated Levels = off) or stop extending the line and drop a small, persistent left-justified label where mitigation occurred (Show Mitigated Levels = on).
– Label combining: on each update, per-level labels are optionally cleared and replaced with one combined label per price level. The script groups by tick index, merges tokens (e.g., LON.H + PDH), and uses a small vertical offset loop to avoid label collisions at the same x-position.
Inputs you control
– Timeframe Limit: drawings will not appear on charts greater than or equal to this resolution.
– Timezone: default America/New_York.
– Label Settings
– Show Labels / Show Session High/Low Levels.
– Show Mitigated Levels: keep a small label where a level was traded through.
– Combine overlapping level labels: merge tokens into one label if prices match.
– Label sizes for levels and for session start/end text (sizes: Tiny/Small/Normal/Large).
– Visual Settings
– Colors for level lines and label text.
– Styles (Solid/Dashed/Dotted) for Previous Week and Previous Day blocks.
– Custom Labels
– Rename tokens for each session print (e.g., ASIA.H, LON.L, NYAM.H, etc.) to match your playbook.
– Key Opens
– Toggle Midnight Open, True Day Open (6 PM), and 8:30 Open lines; customize colors.
– Previous Week / Previous Day
– Toggle PWH/PWL and PDH/PDL; optionally plot Mon/Tue/Wed reference prints.
– Macro Sessions (toodegrees-style bracket)
– Toggle two macro windows (9:45–10:15 and 10:45–11:15).
– Choose bracket height in ticks, line style, label size/text, and optional price projection.
– The bracket is dynamic during its window (extends across the window; top adapts to new highs + chosen height; label centers on completion).
How to use it:
Pick your Timeframe Limit (e.g., 30) so the map only shows where you execute.
Enable the sessions you trade and keep the timezone aligned to your venue.
Turn on the prior period levels you care about (PWH/PWL, PDH/PDL, Mon/Tue/Wed).
Choose whether to preserve mitigated levels. If you journal, keeping mitigated tags helps with post-session review.
Enable combined labels to reduce clutter and spotlight confluence (e.g., LON.H aligning with PDH).
Use Macro windows for playbook timing (9:45–10:15, 10:45–11:15) to visualize typical volatility brackets.
Practical notes
– The indicator is a context and mapping tool; it does not produce signals. Use with your own bias, PD arrays, and execution model.
– Very long lookbacks or many toggles can push object limits on lower-powered machines. Use Timeframe Limit and feature toggles to keep things light.
– If you use custom sessions, ensure they do not overlap unexpectedly in your timezone.
– “Combine labels” intentionally removes per-level labels in favor of one merged label per price level; mitigated labels are preserved by design.
What’s unique here
– A full intraday “session print” system (Asia/London/NY AM/NY Lunch/NY PM) with clean freezing at session close and live line extension.
– True Day/Midnight/8:30 opens integrated into the same framework for a single, coherent liquidity map.
– Prior period structure (week/day + optional Mon/Tue/Wed) and toodegrees-style macro windows in one tool.
– Robust label merging by tick level with anti-overlap logic so multi-signal confluence is readable at a glance.

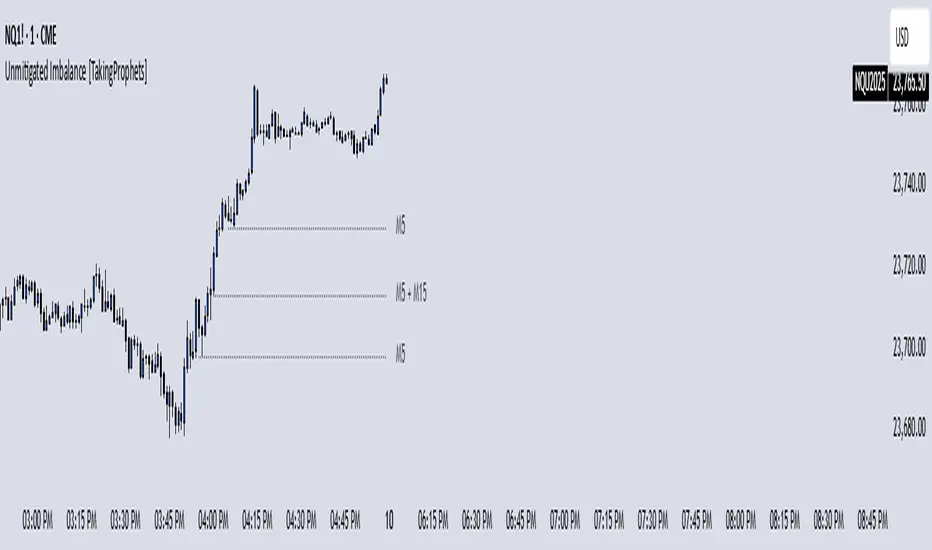
Unmitigated Imbalances [TakingProphets] (High Timeframe)Unmitigated Imbalances
Unmitigated Imbalance is designed to automatically detect and display active Fair Value Gaps (FVGs) across multiple higher timeframes and your current chart. It only keeps the ones that remain unmitigated, helping you clearly see where price has “unfinished business” and potential liquidity draw areas. The tool extends these levels forward until they are tagged according to your chosen mitigation criteria, then removes them automatically.
The indicator uses the classic 3-bar FVG structure:
– Bearish FVG forms when the low of the third candle back is above the high of the first candle.
– Bullish FVG forms when the high of the third candle back is below the low of the first candle.
– Each detected gap must meet a minimum size threshold, which is determined automatically from the Sensitivity setting and adjusted for the symbol type.
Higher timeframes (up to 4) can be plotted simultaneously with your current chart’s gaps. The script merges overlapping levels from different timeframes into one clean label, showing all the contributing timeframes together (for example: M15 + H1 + H4). This makes it easy to spot high-confluence levels without cluttering your chart.
Key features
– Multi-timeframe detection: up to 4 custom HTFs plus your current chart.
– Automatic gap size filtering based on chosen Sensitivity (High, Medium, Low).
– Choice of Wick or Close-based mitigation logic.
– Lookback control: 1 Day, 1 Week, 1 Month, or Max.
– Combined labels for overlapping gaps with clear timeframe tags.
– Separate color and style settings for each timeframe’s bullish and bearish gaps.
– Labels can be positioned Left, Right, or Center Above for maximum clarity.
– Automatic line extension until mitigation or until they exceed the lookback period.
How to use
Select your desired higher timeframes in the HTF1–HTF4 settings.
Choose the Sensitivity level to control the minimum gap size detected.
Decide on Wick or Close mitigation according to your trading rules.
Use the Lookback setting to limit how far back the script checks for gaps.
Watch for levels where multiple timeframe labels are stacked — these can carry greater significance.
Incorporate the levels into your existing strategy, using them as context rather than entry signals.
Practical notes
– Current timeframe gaps reset each trading day to keep the chart relevant to intraday bias.
– Higher timeframe gaps remain until mitigated or until the lookback period expires.
– Large lookback periods with multiple HTFs can increase chart load — adjust settings as needed.
– This indicator is a mapping and context tool, not a signal generator. Always apply it alongside your own analysis.
Watermark [TakingProphets] Watermark
A fully customizable watermark & chart info panel to keep your charts branded, organized, and informative — without clutter.
Special thanks to for inspiring the original concept that led to this expanded version.
📌 Overview
Perfect for:
Traders who stream, record, or share charts
Keeping essential info (symbol, TF, date, price) visible
Intraday traders who want day-of-week labels without messy vertical lines
✨ Key Features
1. Personal Watermark
Custom text, colors, size, opacity
Position anywhere: Top, Middle, Bottom × Left, Center, Right
Alignment options: left, center, right
Optional border with adjustable color or hide completely
2. Chart Info Panel
Show any combination of:
Custom text
Symbol
Timeframe (auto-formatted)
Date (MM-DD-YYYY)
Last price
Day of the week
Position independently from watermark
Adjustable background opacity
3. Day-of-Week Labels
Labels Sunday → Saturday at session start or midday
Works on intraday ≤ 15m timeframes
Option to hide weekends
Place labels Top or Bottom
⚙️ How to Use
Enable Watermark → Personal Watermark Settings → Toggle Show Watermark, enter your text, style it.
Set Up Info Panel → Chart Information Panel → Select details, choose position, adjust style.
Add Day Labels → Day of Week Labels Settings → Turn on for intraday charts.
💡 Tips
Lower background opacity for a subtle look.
Use bright colors for streaming so your brand stands out.
Hide unused features to keep charts clean & fast.
🙏 Acknowledgments
This script’s concept was inspired by toodegrees.
Developed by TakingProphets — tools for traders who value clarity, precision, and style.
⚠️ Disclaimer:
This script is for informational purposes only. It is not financial advice. Always trade responsibly and manage your risk.

Multi Timeframe Fair Value Gap Indicator ProMulti Timeframe Fair Value Gap Indicator Pro | MTF FVG Imbalance Zones | Institutional Supply Demand Levels
🎯 The Most Comprehensive Multi-Timeframe Fair Value Gap (FVG) Indicator on TradingView
Transform Your Trading with Institutional-Grade Multi-Timeframe FVG Analysis
Keywords: Multi Timeframe Indicator, MTF FVG, Fair Value Gap, Imbalance Zones, Supply and Demand, Institutional Trading, Order Flow Imbalance, Price Inefficiency, Smart Money Concepts, ICT Concepts, Volume Imbalance, Liquidity Voids, Multi Timeframe Analysis
📊 WHAT IS THIS INDICATOR?
The Multi Timeframe Fair Value Gap Indicator Pro is the most advanced FVG detection system on TradingView, designed to identify high-probability institutional supply and demand zones across multiple timeframes simultaneously. This professional-grade tool automatically detects Fair Value Gaps (FVGs), also known as imbalance zones, liquidity voids, or inefficiency gaps - the exact areas where institutional traders enter and exit positions.
🔍 What Are Fair Value Gaps (FVGs)?
Fair Value Gaps are three-candle price formations that create imbalances in the market structure. These gaps represent areas where buying or selling was so aggressive that price moved too quickly, leaving behind an inefficient zone that price often returns to "fill" or "mitigate." Professional traders use these zones as high-probability entry points.
Bullish FVG: When the low of candle 3 is higher than the high of candle 1
Bearish FVG: When the high of candle 3 is lower than the low of candle 1
⚡ KEY FEATURES
📈 Multi-Timeframe Analysis (MTF)
- 12 Timeframes Simultaneously: 1m, 3m, 5m, 15m, 30m, 45m, 1H, 2H, 3H, 4H, Daily, Weekly
- Real-Time Detection: Instantly identifies FVGs as they form across all selected timeframes
- Customizable Timeframe Selection: Choose which timeframes to display based on your trading style
- Higher Timeframe Confluence: See when multiple timeframes align for stronger signals
🎨 Three Professional Visual Themes
1. Dark Intergalactic: Futuristic neon colors with high contrast for dark mode traders
2. Light Minimal: Clean, professional appearance for traditional charting
3. Pro Modern: Low-saturation colors for extended screen time comfort
📊 Advanced FVG Dashboard
- Live FVG Counter: Real-time count of active bullish and bearish gaps
- Total Zone Tracking: Monitor all active imbalance zones at a glance
- Theme-Adaptive Display: Dashboard automatically adjusts to your selected visual theme
- Strategic Positioning: Optimally placed to not interfere with price action
🔧 Smart Zone Management
- Dynamic Zone Updates: FVG boxes automatically adjust when price touches them
- Mitigation Detection: Visual feedback when zones are tested or filled
- Color-Coded Status: Instantly see untested vs tested zones
- Extended Projection: Option to extend boxes to the right for future reference
- Timeframe Labels: Optional labels showing which timeframe each FVG originated from
💡 Intelligent Features
- Automatic Zone Cleanup: Removes fully mitigated FVGs to keep charts clean
- Touch-Based Level Adjustment: Zones adapt to partial fills
- Maximum Box Management: Optimized to handle 500 simultaneous FVG zones
- Performance Optimized: Efficient code ensures smooth operation even with multiple timeframes
🎯 TRADING APPLICATIONS
Day Trading & Scalping
- Use 1m, 3m, 5m FVGs for quick scalp entries
- Combine with higher timeframe FVGs for directional bias
- Perfect for futures (ES, NQ, MNQ), forex, and crypto scalping
Swing Trading
- Focus on 1H, 4H, and Daily FVGs for swing positions
- Identify major support/resistance zones
- Plan entries at untested higher timeframe gaps
Position Trading
- Utilize Daily and Weekly FVGs for long-term positions
- Identify institutional accumulation/distribution zones
- Major reversal points at significant imbalance areas
Multi-Timeframe Confluence Trading
- Stack multiple timeframe FVGs for high-probability zones
- Confirm entries when lower and higher timeframe FVGs align
- Professional edge through timeframe confluence
📚 HOW TO USE THIS INDICATOR
Step 1: Add to Your Chart
Click "Add to Favorites" and apply to any trading instrument - works on all markets including stocks, forex, crypto, futures, and indices.
Step 2: Configure Your Timeframes
In settings, select which timeframes you want to monitor. Day traders might focus on 1m-15m, while swing traders might use 1H-Weekly.
Step 3: Choose Your Visual Theme
Select from three professional themes based on your preference and trading environment.
Step 4: Identify Trading Opportunities
For Long Entries:
- Look for Bullish FVGs (green/cyan zones)
- Wait for price to return to untested zones
- Enter when price shows rejection from the FVG zone
- Higher timeframe FVGs provide stronger support
For Short Entries:
- Look for Bearish FVGs (red/pink zones)
- Wait for price to return to untested zones
- Enter when price shows rejection from the FVG zone
- Higher timeframe FVGs provide stronger resistance
Step 5: Manage Risk
- Place stops beyond the FVG zone
- Use partially filled FVGs as trailing stop levels
- Exit when opposite FVGs form (reversal signal)
🏆 WHY THIS IS THE BEST MTF FVG INDICATOR
✅ Most Comprehensive
- More timeframes than any other FVG indicator
- Advanced features not found elsewhere
- Professional-grade visual presentation
✅ Institutional-Grade
- Based on smart money concepts (SMC)
- ICT (Inner Circle Trader) methodology compatible
- Used by professional prop traders
✅ User-Friendly
- Clean, intuitive interface
- Detailed tooltips and descriptions
- Works out-of-the-box with optimal defaults
✅ Continuously Updated
- Regular improvements and optimizations
- Community feedback incorporated
- Professional development by PineProfits
🔥 PERFECT FOR
- Scalpers seeking quick FVG fills
- Day Traders using multi-timeframe analysis
- Swing Traders identifying major zones
- ICT/SMC Traders following smart money
- Prop Firm Traders needing reliable setups
- Algorithmic Traders building systematic strategies
- Technical Analysts studying market structure
- All Experience Levels from beginners to professionals
💎 ADVANCED TIPS
1. Confluence is Key: The strongest signals occur when multiple timeframe FVGs align at the same price level
2. Fresh vs Tested: Untested FVGs (original color) are stronger than tested ones (gray/muted color)
3. Time of Day: FVGs formed during high-volume sessions (London/NY) are more reliable
4. Trend Alignment: Trade FVGs in the direction of the higher timeframe trend for best results
5. Volume Confirmation: Combine with volume indicators for enhanced reliability
📈 INDICATOR SETTINGS
Visual Settings
- Visual Theme: Choose between Dark Intergalactic, Light Minimal, or Pro Modern
- Show Branding: Toggle PineProfits branding on/off
General Settings
- Move box levels with price touch: Dynamically adjust FVG zones
- Change box color with price touch: Visual feedback for tested zones
- Extend boxes to the right: Project zones into the future
- Plot Timeframe Label: Show origin timeframe on each FVG
- Show FVG Dashboard: Toggle the summary dashboard
Timeframe Selection
Select any combination of 12 available timeframes (1m to Weekly)
🚀 GET STARTED NOW
1. Click "Add to Favorites" to save this indicator
2. Apply to your chart - works on any instrument
3. Join thousands of traders already using this professional tool
4. Follow PineProfits for more institutional-grade indicators
⚖️ DISCLAIMER
This indicator is for educational and informational purposes only. It should not be considered financial advice. Always do your own research and practice proper risk management. Past performance does not guarantee future results. Trade responsibly.
© PineProfits - Professional Trading Tools for Modern Markets
If you find this indicator valuable, please leave a like and comment. Your support helps me create more professional-grade tools for the TradingView community!

SMC Pro - Smart Money Concepts🎯 SMC Pro - Complete Smart Money Concepts Trading System with Trade Alerts
The Most Comprehensive SMC/ICT Indicator Built for Real Traders
After extensive research into what retail and prop firm traders actually need, I've created SMC Pro - a complete Smart Money Concepts indicator that solves the biggest problems with existing SMC tools.
🚀 What Makes This Different:
✅ COMPLETE TRADE SETUP ALERTS - Not just structure breaks! Get full trade setups with:
* Entry, Stop Loss & Target Prices
* Risk/Reward Calculations
* 5-Point Confluence Scoring
* Visual Trade Labels on Chart
✅ INTELLIGENT FILTERING - No more chart spam:
* Minimum structure size filter (ATR-based)
* Minimum bars between signals
* Volume confirmation for order blocks
* Clean, actionable signals only
📊 Core Features:
1. Market Structure Analysis
* Break of Structure (BOS) with smart filtering
* Change of Character (CHoCH) detection
* Clear directional bias identification
* Prevents excessive signal clustering
2. Order Blocks
* Volume-confirmed institutional zones
* Automatic mitigation tracking
* Entry points for trade setups
3. Fair Value Gaps
* ATR-based size filtering
* Automatic fill detection
* Confluence factor for trades
4. Liquidity Zones
* Buy-side & Sell-side liquidity mapping
* Sweep detection with alerts
* Target zones for trades
5. Risk Management Integration
* Automatic R:R calculation
* Position sizing guidance
* Minimum R:R filtering (default 2:1)
🎯 5-Point Trade Confluence System:
1. Market structure alignment
2. Recent structure break (BOS/CHoCH)
3. Order block at current price
4. Fair value gap support
5. Liquidity target available
Minimum score of 3/5 required for trade alerts (adjustable)
⚙️ Smart Settings:
* Swing Length: 10 (default) - adjust for sensitivity
* Min Bars Between Signals: 20 - prevents clustering
* Min Structure Size: 1.0 ATR - filters noise
* Min Confluence Score: 3/5 - quality control
* Target R:R: 2:1 minimum - proper risk management
📱 Alert Types:
* 🎯 Trade Setup Alerts - Complete entry/exit plans
* ✅ Structure Breaks - BOS & CHoCH notifications
* 📊 Order Block Touch - Price at key zones
* 💧 Liquidity Sweeps - Stop hunts detected
💡 Pro Tips:
* Start with default settings
* Use on 15m+ timeframes for cleaner signals
* Increase confluence requirement for prop firm trading
* Enable volume confirmation for higher quality OBs
* Dashboard shows real-time setup status
🔧 If You Get Too Many Signals:
* Increase Swing Length to 15-20
* Increase Min Bars Between to 30-50
* Increase Min Structure Size to 1.5 ATR
* Raise Min Confluence Score to 4 or 5
This indicator is the result of solving real problems traders face with SMC/ICT concepts. It's designed to give you clean, actionable trade setups - not just mark up your chart with zones.
Built with Pine Script v6 for maximum performance and reliability.
Trade with confluence. Trade with confidence. Trade smart. 🎯
