Smooth

Turbo Scaler - The Art Of Being (too) EarlyIntroduction
Fast smooth indicators that produce early signals can sound utopic but mathematically its not a huge deal, the effect of early outputs based on smooth inputs can be seen on differentiators crosses, this is why i propose this indicator that aim to return extra fast signals based on a slightly modified max-min normalization method. The indicator introduce inherent smoothing without having an huge impact on the indicator reactivity.
The Indicator
The indicator is based on max-min normalization (like the stochastic oscillator) however instead of using the highest/lowest of the input we use the highest and lowest of the moving average of the input. This process using as input the closing price and the moving average closing price will return two lines, and because of the nature of max-min normalization we can see that the trigger line (in orange) produce earlier crosses. length control the highest/lowest period while smooth control the output lines smoothness (50 by default).
alpha control the scaling amount, with higher values of alpha creating more constrained scale, when alpha = 1 the scale is in a range of (0,1) while lower values of alpha can make the output move more freely.
alpha = 0.25
alpha = 1
Higher values of alpha create earlier signals.
Downsides Of Early Crosses
Of course such indicator make us exposed to the trend as seen below.
We can nonetheless protect ourselves against such cases scenarios by lowering alpha.
lowering alpha allow to catch movements of the trend without loosing much reactivity at the cost of an increased umber of trades.
Possible Uses
The proposed indicator allow for an high number of uses because of its scale, reactive nature...etc. A method that allow us to go with the main trend is by taking into account the crosses between the lines and the sign of the lines, for example :
The first signal (green) happen when the main line (in blue) crossover the trigger (orange) while both are > 0, the same happen with the second signal however both lines are < 0. This method can use certain levels instead of the sign (main line crossover trigger while both > 0.7...etc).
This method is great for the indicator because such cases scenarios does not happen a lot with ranging markets, we can clearly that when trending the trigger can have the tendency to be flat and higher than 0 thus allowing for the main line to produce those signals.
Conclusion
I have presented a super reactive crosses indicator based on max-min normalization with the ability to both be smooth and produce early entries/exits signals, different methods have been presented in order to allow for different setups using this indicator.
The introduction of the alpha parameter allow for more control which is what those kind of indicators needs. I hope you find an use to it :)
Support Me
Making indicators sure is hard, it takes time and it can be quite lonely to, so i would love talking with you guys while making them :) There isn't better support than the one provided by your friends so drop me a message.

Powered Kaufman Adaptive Moving AverageIntroduction
The ability the Kaufman adaptive moving average (KAMA) has to be flat during ranging markets and close to the price during trending markets is what make this moving average one of the most useful in technical analysis. KAMA is calculated by using exponential averaging using the efficiency ratio (ER) as smoothing variable where 1 > ER > 0 . An increasing efficiency ratio indicate a trending market. Based on one of my latest indicator (see Kaufman Adaptive Bands) i propose this modified KAMA that allow to emphasis the abilities of KAMA by powering the efficiency ratio. I also added a new option that allow for even more adaptivity.
The Indicator
The indicator is a simple KAMA of period length that use a powered ER with exponent factor .
When factor = 1 the indicator is a simple KAMA, however when factor > 1 there can be more emphasis on the flattening effect of KAMA.
You can also restrain this effect by using 1 > factor > 0
Note that when the exponent is lower than 1 and greater than 0 you are basically applying a nth square root to the value, for example pow(2,0.5) = sqrt(2) because 1/0.5 = 2, in our case :
pow(ER,factor > 1) < ER and pow(ER,1 > factor > 0) > ER
Self Powered P-KAMA
When the self powered option is checked you are basically powering ER with the reciprocal of ER as exponent, however factor does no longer change anything. This can give interesting results since the exponent depend on the market trend strength.
In orange the self powered KAMA of period length = 50 and in blue a basic powered KAMA with a factor of 3 and a period of length = 50.
Conclusion
Applying basic math to indicators is always fun and easy to do, if you have adaptive moving averages using exponential averaging try powering your smoothing variable in order to see interesting results. I hope you like this indicator. Thanks for reading !

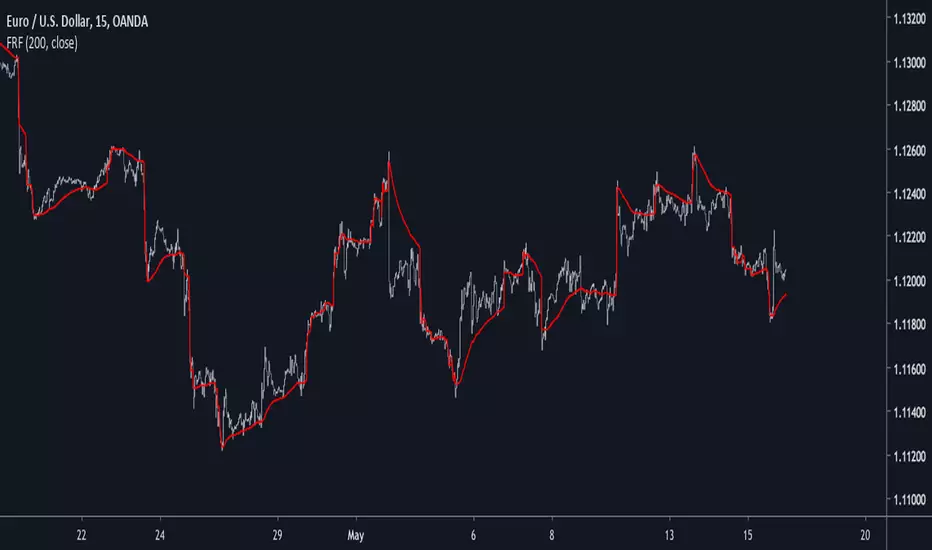
Motion Smoothness Index Introduction
Its holiday time for me, i have been working here a lot. But no leaving before publishing. Telling when market price is smooth or rough is not the easiest task, so today i present a trend metric indicator that allow you to give you this kind of information.
The Indicator
The indicator is in an approximate range of (0,1) with mean x̄ decaying for higher length's, when the indicator is below 0.5 the market is smooth, else rough, this is the simple interpretation. The indicator is simply the ratio of the price residual standard deviation and the price standard deviation.
Higher value of length will make the indicator less accurate when it comes to detect rough market price, you can still use the indicator direction or its running mean to give you insights but 0.5 is still the recommended detection threshold.
In More Depth
Even tho market is random by nature there can still be structures in the price (cycles and trends), the fractional BM model will tell you that market price is sometimes auto-correlated (trending) or non auto-correlated (ranging), knowing what is the current market state is therefore important, when price is rough it can means an excess in noise thus exhibiting an uncorrelated market at the contrary of a smoother price that can allow for auto-correlation.
Now, market is infected by noise, and thats really unfortunate but the noise posses various properties that can allow for all the structures we see in market price. So thinking about the market allowing for possible profits during auto-correlated states is encouraging.
Conclusion
Although the indicator measure smoothness/roughness it can still be interpreted as a trend/range state detector. I hope it provide to be useful.
I wish you all good holidays and see you next time ! Thanks for reading !
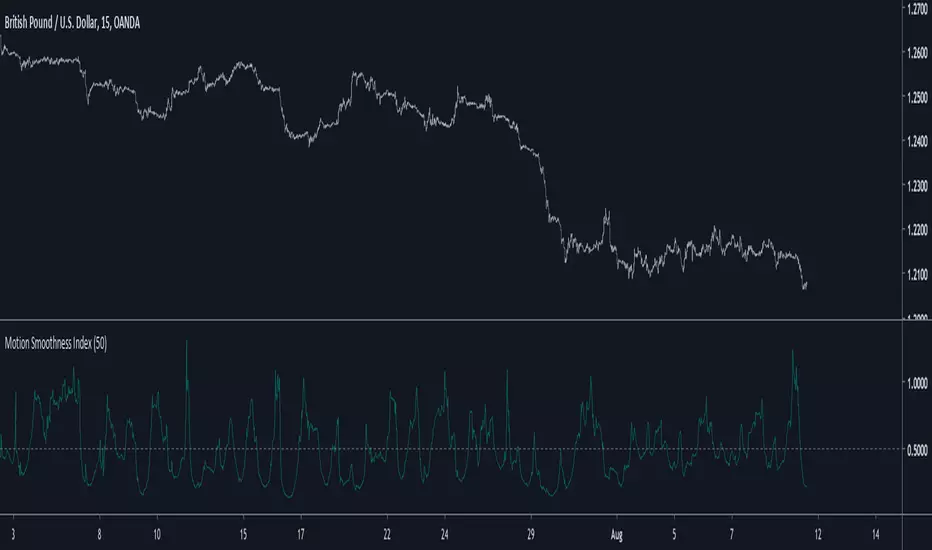
Hybrid Convolution FilterIntroduction
Today i propose an hybrid filter that use a classical FIR architecture while using recursion. The proposed method aim to reduce the lag generated by fir filters. This particular filter is a sine weighted moving average, but you can change it since the indicator is built with the custom filter template (1). Even if it use recursion it still is a FIR filter since the impulse response is finite.
The Indicator
In red the hybrid swma and in blue the classic swma of both the same period. The difference can be seen.
The switch between the input price and the past values of the previous convolution values is made by using exponential averaging, the window function is the same as f(x) in the code.
Any filter can use this architecture, the indicator is built around the custom fir template, see (1)
Conclusion
I presented a FIR filter using recursion in its calculation, the integration is made with respect to the proposed template, therefore any user can simply modify f(x) to have different filter without the need to make any change. However curious users might want to change the window function of the exponential averager, in order to do so change sgn = f(i/length) in line 11 for sgn = fun(i/length) where fun is your custom function, make sure to add it at the start of the script where all the other functions declarations are.
Thanks for reading !
(1)
Bilateral Stochastic Oscillator - For The Sake Of EfficiencyIntroduction
The stochastic oscillator is a feature scaling method commonly used in technical analysis, this method is the same as the running min-max normalization method except that the stochastic oscillator is in a range of (0,100) while min-max normalization is in a range of (0,1). The stochastic oscillator in itself is efficient since it tell's us when the price reached its highest/lowest or crossed this average, however there could be ways to further develop the stochastic oscillator, this is why i propose this new indicator that aim to show all the information a classical stochastic oscillator would give with some additional features.
Min-Max Derivation
The min-max normalization of the price is calculated as follow : (price - min)/(max - min) , this calculation is efficient but there is alternates forms such as :
price - (max - min) - min/(max - min)
This alternate form is the one i chosen to make the indicator except that both range (max - min) are smoothed with a simple moving average, there are also additional modifications that you can see on the code.
The Indicator
The indicator return two main lines, in blue the bull line who show the buying force and in red the bear line who show the selling force.
An orange line show the signal line who represent the moving average of the max(bull,bear), this line aim to show possible exit/reversals points for the current trend.
Length control the highest/lowest period as well as the smoothing amount, signal length control the moving average period of the signal line, the pre-filtering setting indicate which smoothing method will be used to smooth the input source before applying normalization.
The default pre-filtering method is the sma.
The ema method is slightly faster as you can see above.
The triangular moving average is the moving average of another moving average, the impulse response of this filter is a triangular function hence its name. This moving average is really smooth.
The lsma or least squares moving average is the fastest moving average used in this indicator, this filter try to best fit a linear function to the data in a certain window by using the least squares method.
No filtering will use the source price without prior smoothing for the indicator calculation.
Relationship With The Stochastic Oscillator
The crosses between the bull and bear line mean that the stochastic oscillator crossed the 50 level. When the Bull line is equal to 0 this mean that the stochastic oscillator is equal to 0 while a bear line equal to 0 mean a stochastic oscillator equal to 100.
The indicator and below a stochastic oscillator of both period 100
Using Levels
Unlike a stochastic oscillator who would clip at the 0 and 100 level the proposed indicator is not heavily constrained in a range like the stochastic oscillator, this mean that you can apply levels to trigger signals
Possible levels could be 1,2,3... even if the indicator rarely go over 3.
Its then possible to create strategies using such levels as support or resistance one.
Conclusion
I've showed a modified stochastic oscillator who aim to show additional information to the user while keeping all the information a classical stochastic oscillator would give. The proposed indicator is no longer constrained in an hard range and posses more liberty to exploit its scale which in return allow to create strategies based on levels.
For pinescript users what you can learn from this is that alternates forms of specific formulas can be extremely interesting to modify, changes can be really surprising so if you are feeling stuck, modifying alternates forms of know indicators can give great results, use tools such as sympy gamma to get alternates forms of formulas.
Thanks for reading !
If you are looking for something or just want to say thanks try to pm me :)

Fisher Least Squares Moving AverageIntroduction
I already estimated the least-squares moving average numerous times, one of the most elegant ways was by rescaling a linear function to the price by using the z-score, today i will propose a new smoother (FLSMA) based on the line rescaling approach and the inverse fisher transform of a scaled moving average error with the goal to provide an alternative least-squares smoother, the indicator won't use the correlation coefficient and will try to adresses problems such as overshoots and lag reduction.
Line Rescaling Method
For those who did not see my least squares moving average estimation using the line rescaling method here is a resume, we want to fit a polynomial function of degree 1 to the price by reducing the sum of squares between the price and the filter, squares is a term meaning the squared difference between the price and its estimation. The line rescaling technique work as follow :
1 - get the z-score of a line.
2 - multiply this z-score with the correlation between the price and a line.
3 - multiply the precedent result with the standard deviation of the price, then sum that to a simple moving average.
This process is shorter than the classical least-squares moving average method.
Z-Score Derivation And The Inverse Fisher Transform
The FLSMA will use a similar approach to the line rescaling technique but instead of using the correlation during step 2 we will use an alternative calculated from the error between the estimate and the price.
In order to do so we must use the inverse fisher transform, the inverse fisher transform can take a z-score and scale it in a range of (1,-1), it is possible to estimate the correlation with it. First lets create our modified z-score in the form of : Z = ma((y - Y)/e) where y is the price, Y our output estimate and e the moving average absolute error between the price and Y and lets call it scaled smoothed error , then apply the inverse fisher transform : r = IFT(Z) = tanh(Z) , we then multiply the z-score of the line with it.
Performance
The FLSMA greatly reduce the overshoots, this mean that the maximas of abs(r) are lower than the maxima's of the absolute correlation, such case is not "bad" but we can see that the filter is not closer to the price than the LSMA during trending periods, we can assume the filter don't reduce least-squares as well as the LSMA.
The image above is the running mean of the absolute error of each the FLSMA (in red) and the LSMA (in blue), we could fix this problem by multiplying the smooth scaled error by p where p can be any number, for example :
z = sma(src - nz(b ,src),length)/e * p where p = 2
In red the FLSMA and in blue the FLSMA with p = 2 , the greater p is the less lag the FLSMA will have.
Conclusion
It could be possible to get better results than the LSMA with such design, the presented indicator use its own correlation replacement but it is possible to use anything in a range of (1,-1) to multiply the line z-score. Although the proposed filter only reduce overshoots without keeping the accuracy of the LSMA i believe the code can be useful for others.
Thanks for reading.

SVAMA - A Non Parametric Adaptive Moving Average Based On VolumeIntroduction
Technical indicators often have parameters settings that the user must enter, those are inconvenient when the user must design a strategy because such settings must be optimized, it must also been noted that the optimal settings at time t could change at time t+n , this is why non parametric indicators are more efficient. Today i propose a moving average adapting to the market volume without using parameters affecting the smoothing.
The Indicator
The volume is rescaled in a range of (1,0) by using max or min normalization. Exponential averaging is used to provide the moving average.
When using max normalization the moving average react faster when the volume is closer to its all time high, when using min normalization the moving average react faster when the volume is closer to its all time low. You can select the method (max or min) from the "Method" parameter.
Volume tend to be higher and more periodic with higher time-frames, this is why lower time-frames might return smoother results when using the Max method. It is recommended to use the Max method when we want a faster moving average while the Min method is more suited to get a slower moving average.
Both methods can provide an interesting MA-Cross system when used on higher time frames.
Conclusion
There should be more non parametric indicators, this would allow for faster and easier optimization processes when creating a strategy, in theory any indicator using a moving average or highest/lowest could be made non parametric by using a running mean or running max/min but the indicator might loose important information.
This is one of my main focus right now since such indicators could also allow for improvements when used with artificial intelligence. I hope you find an use to it, don't hesitate to send me your suggestions.
Thanks for reading !

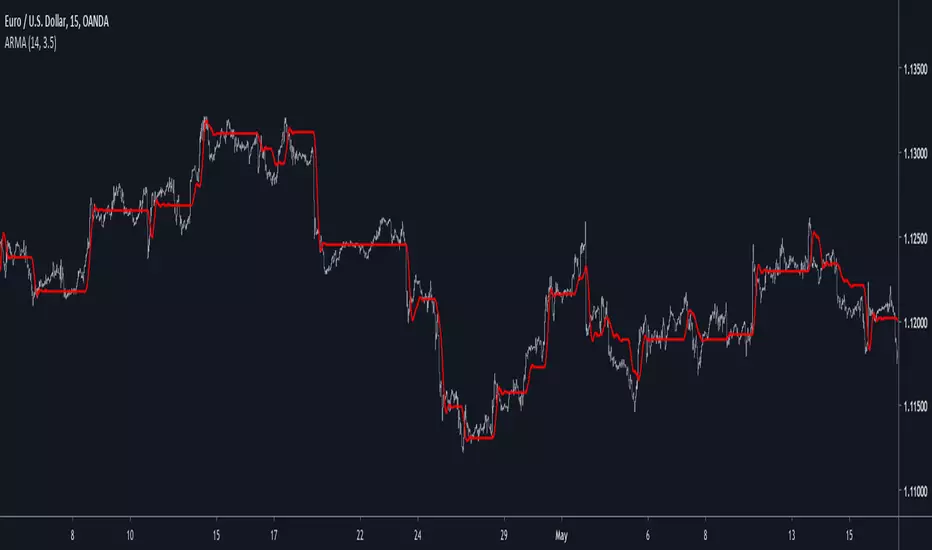
Adaptive Autonomous Recursive Moving AverageIntroduction
Using conditions in filters is a way to make them adapt to those, i already used this methodology in one of my proposed indicators ARMA which gave a really promising adaptive filter, ARMA tried to have a flat response when dealing with ranging market while following the price when the market where trending or exhibiting volatile movements, the filter was terribly simple which is one of its plus points but its down points where clearly affecting its performance thus making it almost impractical.
Today i propose a new filter A2ARMA which aim to correct all the bad behaviours of ARMA while having a good performance on various markets thanks to the added adaptivity.
Fixes And Changes
ARMA was dealing with terribles over/under-shoots which affected its performance, adding a zero-lag option made the thing even worse, in order to fix those mistakes i first cleaned the code, then i removed the offset for src in d , this choice is optional but the filter is sometimes more accurate this way.
The major change is the use of an adaptive moving average instead of the triangular moving average that smoothed the output, this adaptive moving average is calculated using exponential averaging while using the efficiency ratio as smoothing variable, this choice surprisingly removed the majority of overshoots while adding more adaptivity to the filter.
The Indicator
The Indicator work the same way as ARMA, not reacting during flat market periods while following the price when this one is volatile or trending. length control the smoothing amount while gamma determine how the filter is affected during flat market periods, gamma = 0 is just a double smoothed adaptive moving average, higher values of gamma will filter flat markets with a certain degree.
On Intel Corp with gamma = 0, i want to filter the flat period starting at July 10, gamma = 3 will certainly help us on this task.
Hooray, the problem appear to be solved ! Lower values of gamma also produce desirable effect as shown below :
gamma = 2
So far so good, but gamma or length might have different optimal values depending on the market, also problems still exists as shown here :
Seagate is tricky, gamma at 2.4 might help
The relationship between length and gamma is somewhat complicated.
On Different Markets
While some filters will process market price the same way no matter the market they are affected, A2ARMA will change drastically depending of the market.
On AMD
On EURUSD
On BTCUSD
Comparison With ARMA
ARMA with parameters roughly matching A2RMA, overall most of the problems i wanted to fix where indeed fixed.
Conclusion
A huge thanks for the support i received during this "Blank Page" period i'am suffering, ARMA was an indicator i really wanted to further develop without giving up on the code simplicity and i think this version might provide useful results, we can also notice that the decision making is easier with this version of the indicator thanks to the added coloring (which would have been impossible with ARMA).
My work don't have license attached to it, feel free to modify and share your findings, mentioning is appreciated :)
Thanks for reading !

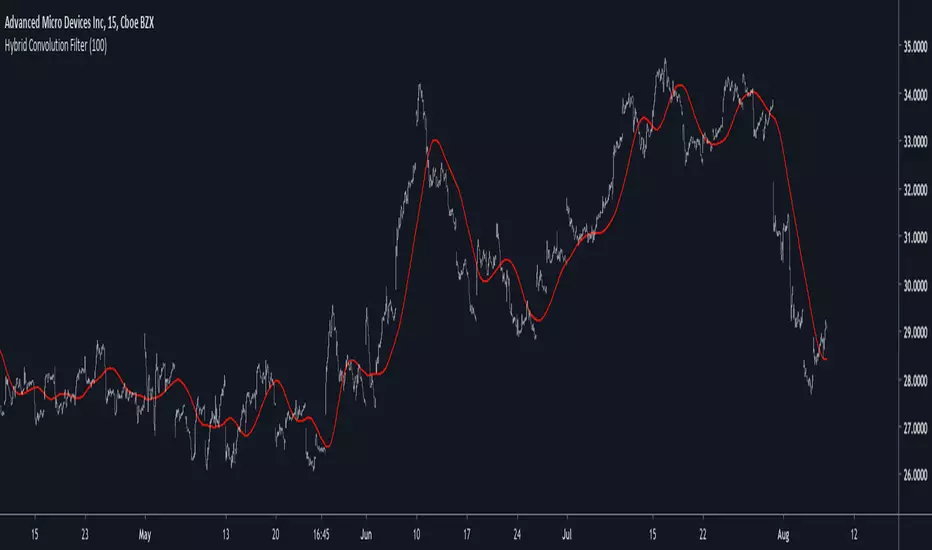
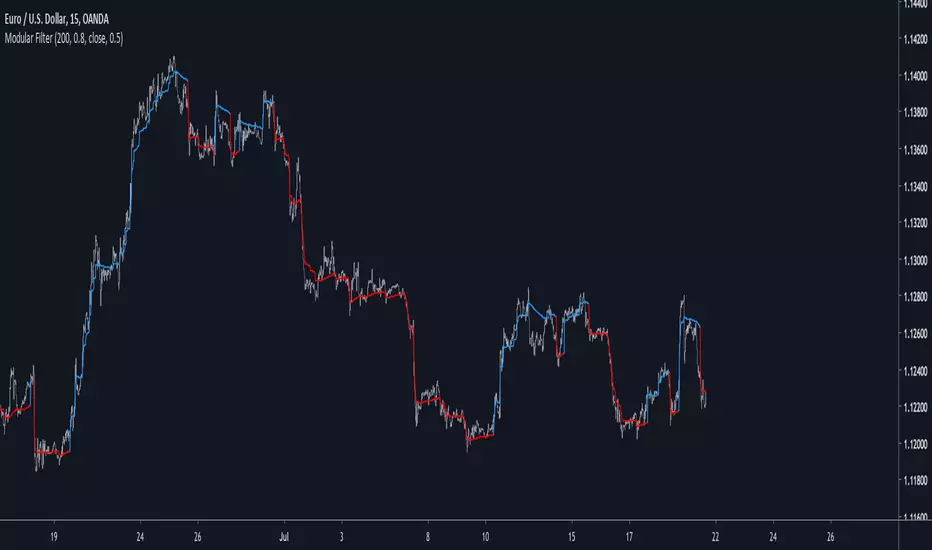
Modular Filter - Spot Trends And Smooth PriceIntroduction
This indicator can have a wide variety of usages, and since it is based on exponential averaging then the whole indicator can be made adaptive, thus ending up with a really promising tool. This indicator who can both smooth price and act as a trailing stop depending on user preferences, i tried to make it as reactive, stable and efficient as possible in order to both smooth and spot trends, lets view it more in depth.
The Indicator
line 8 and 9 create two bands, one upper and one lower, then based on certain conditions the indicator will only return a certain band or an average of both with different weights, this weight is controlled by the beta parameter, values of 1 will return a simple filter while values of 0 will return a classical trailing stop.
beta = 0
The indicator can use output values as input, thus using smoother values as input, in order to do so just check "Feedback", this help the overall output to be smoother as well as giving more long terms signals
The amount of feedback is controlled by the feedback weighting parameter, lower values will weight more the output values thus creating smoother results.
Feedback weighting of 0.2
Using beta = 0 thus having the indicator act as a trailing stop while having the feedback option activated return more long terms signals. Notes that the colors are based on the initial conditions of the indicator.
Conclusion
You can replace length and change alpha for any smoothing variable such as the efficiency ratio or anything with scale (1,0), same goes for beta and the feedback weighting parameter, this is why the indicator is "Modular" in addition of providing different usages. This indicator can look like cluster filters (smooth price monarch, forexguru) , filters with the ability to follow the price quite fine while being stables. I really hope you find an use to it.
Thanks for reading !
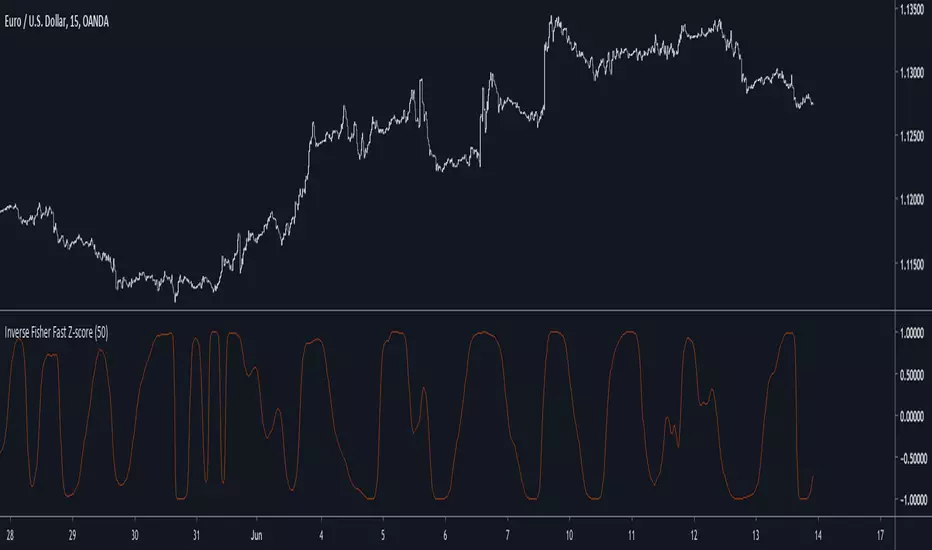
Inverse Fisher Fast Z-scoreIntroduction
The fast z-score is a modification of the classic z-score that allow for smoother and faster results by using two least squares moving averages, however oscillators of this kind can be hard to read and modifying its shape to allow a better interpretation can be an interesting thing to do.
The Indicator
I already talked about the fisher transform, this statistical transform is originally applied to the correlation coefficient, the normal transform allow to get a result similar to a smooth z-score if applied to the correlation coefficient, the inverse transform allow to take the z-score and rescale it in a range of (1,-1), therefore the inverse fisher transform of the fast z-score can rescale it in a range of (1,-1).
inverse = (exp(k*fz) - 1)/(exp(k*fz) + 1)
Here k will control the squareness of the output, an higher k will return heavy side step shapes while a lower k will preserve the smoothness of the output.
Conclusion
The fisher transform sure is useful to kinda filter visual information, it also allow to draw levels since the rescaling is in a specific range, i encourage you to use it.
Notes
During those almost 2 weeks i was even lazier and sadder than ever before, so i think its no use to leave, i also have papers to publish and i need tv for that.
Thanks for reading !
Autonomous Recursive Moving AverageIntroduction
People often ask me what is my best indicators, i can't really respond to this question with a straight answer but i would say you to check this indicator. The Autonomous Recursive Moving Average (ARMA) is an adaptive moving average that try to minimize the sum of squares thanks to a ternary operator, this choice can seem surprising since most of the adaptive moving averages adapt to a smoothing variable thanks to exponential averaging, but there are lot of downsides to this method, i really wanted to have a flat filter during flat markets and this is what i achieved.
The Indicator
length control the amount of smoothing during trending periods, gamma is the trend sensitivity threshold, higher values of gamma will make an overall flat filter, adjust gamma to skip ranging markets.
gamma = 2, we can adjust to 3 while preserving smoothing reactivity with trading periods.
gamma = 3
low length and higher gamma create more boxy result, the filter add overshoots directly in the output, its unfortunate.
The Zero-Lag option can reduce the lag as well as getting additional flat results without changing gamma.
Conclusion
The indicator need work, but i can't leave without publishing it, the overshoots are a big problems, changing sma for another stable filter can help. I hope you find an use to it, i really like this indicator.
Thanks for reading
Simple CycleIntroduction
A simple and really clean cycle oscillator, in fact its quite precise even if the script use recursion which can sometime produce totally uncorrelated results.
On The Code
The calculations start with a who is a smoothing/averaging constant. Then comes src who is the input and is defined as the sum of the closing price with the output, then the output is high-pass filtered in b , after that the output is just the weighted average of the input change with b .
All those recursions and detrending steps make the indicator able to highlights cycles.

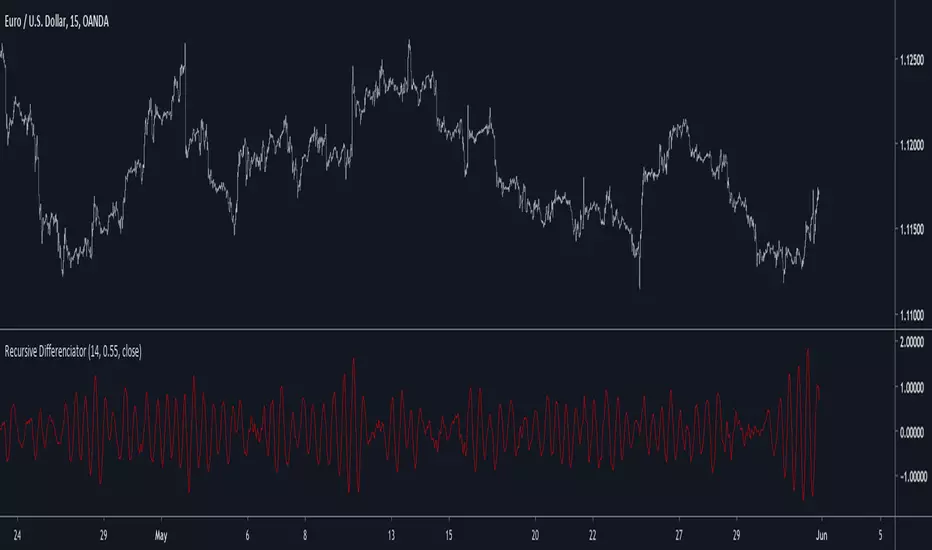
Recursive DifferenciatorIntroduction
Cycles can be spotted by using a wide range of methods, most of them will involve bandpass filtering, here i will show a method using recursion with the change() function.
The Indicator
As i explained in other indicators using recursion i posted rescaling the input is important, i will use the rsi of an exponential moving average as input. alpha control the amount of output the indicator will use as input, values closer to 0.5 will use more input resulting in more periodic results.
Lowering alpha when length is higher can help get more periodic results.
Conclusion
I have showed a new cycle indicator using recursion. Recursion with oscillators can highlights cycles in price thus being easier to predict.
Thanks for reading !
Zero-Lag Smoothed CycleOld indicator ! But its a simple trick to have a zero-lag smoothing effect, i think i did it because the smoothing was kinda asymmetrical with the detrended line. So even if the result appear quite good take into account that the detrended line isn't always correlated with the price.

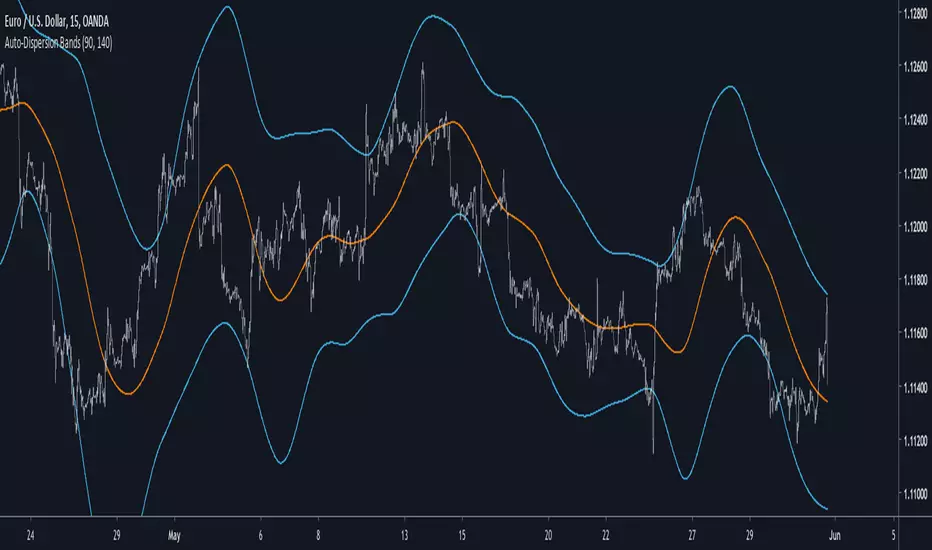
Auto-Dispersion BandsIntroduction
A really old indicator as well, thus i have no much ideas of what is going on with it, but i know that those bands returns good reversals points. The indicator don't use standard deviation, instead its a simple differencing of the price and the price length bars back who will provide a dispersion measurement, thus the name auto-dispersion.
The Indicator
The smooth parameter allow the band to cross the price, if smooth is low the chance of crosses are lower.
smooth = 3
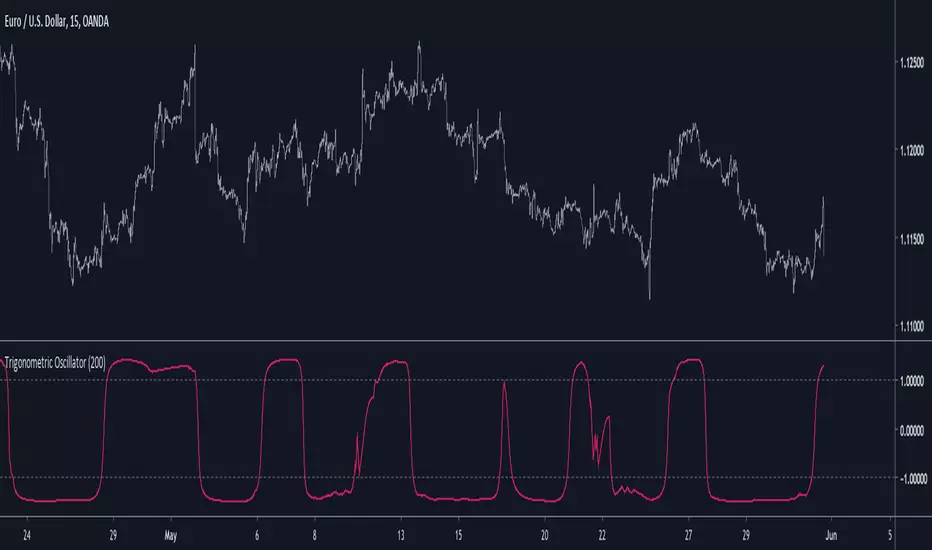
Trigonometric OscillatorIts a pretty old script and i have absolutely no idea how i did it, the code kinda look like the phase wrapping/unwrapping formula. This indicator is an oscillator, sometimes its reactivity is impressive so i think its a good idea to post it, feel free to experiment with it.
Recursive RsiIntroduction
I have already posted a classic indicator using recursion, it was the stochastic oscillator and recursion helped to get a more predictive and smooth result. Here i will do the same thing with the rsi oscillator but with a different approach. As reminder when using recursion you just use a fraction of the output of a function as input of the same function, i say a fraction because if you feedback the entire output you will just have a periodic function, this is why you average the output with the input.
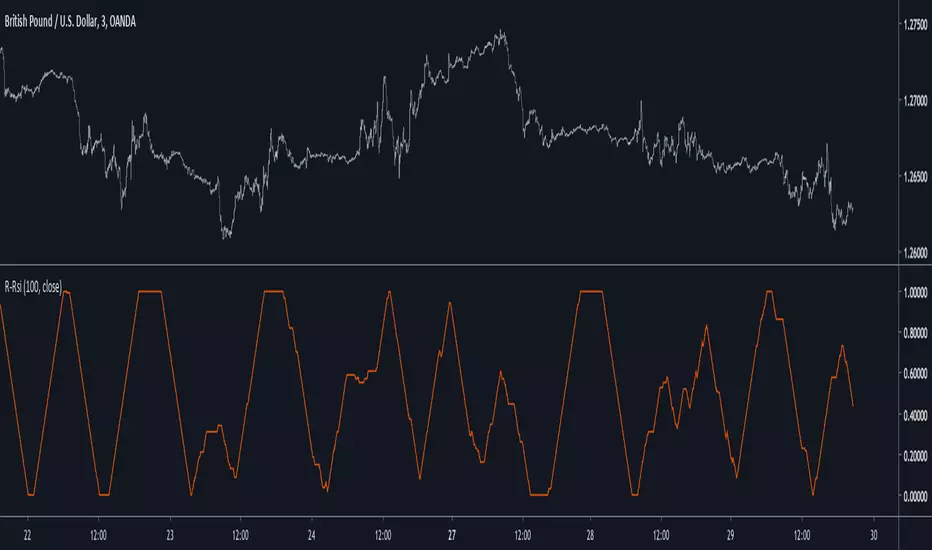
The Indicator
The indicator will use 50% of the output and 50% of the input, remember that when using feedback always rescale your input, else the effect might be different depending on the market you are in. You can interpret the indicator like a normal rsi except if you plan to use the 80/20 level, depending on length the scale might change, if you need a fixed scale you can always rescale b by using an rsi or stochastic oscillator.
Conclusion
I have presented an rsi oscillator using a different type of recursion structure than the recursive stochastic i posted in the past, the result might be more predictive than the original rsi. Hope you like it and thanks for reading !
Turbo TriggerSome Words
This indicator is a collaboration between me and Himeyuri, i encourage you to check her profile and follow her www.tradingview.com
Introduction
A lot of indicators include a "trigger" line, it can be a smoothed version of another input, in this case the trigger will generate signals from his crosses with the input. The purpose of this indicator is to provide a fast trigger line to generate earlier signals as well as avoiding some whipsaw.
The Indicator
There are two lines, a bull line (blue) and the trigger (orange) , when the trigger cross over the bull line a buy signal is generated, when the trigger cross under the bull line a sell signal is generated. The trigger is made from the smoothed difference between the bull and bear line.
smooth control the smoothness of the output. The Bull/Bear Mode is an idea proposed by Himeyuri that involve plotting the bear line instead of the trigger.
Bull/Bear Mode, the lines are somewhat asymmetrical from each others.
Conclusion
We have showcased a new indicator who use a really fast trigger line to generate earlier signals, if some are way to earlier you can still increase smooth in order to correct reactivity. I hope you find a use to it.
Thanks for reading !
A big thanks to Himeyuri who is a great student and great pinescripter.

Non Parametric Adaptive Moving AverageIntroduction
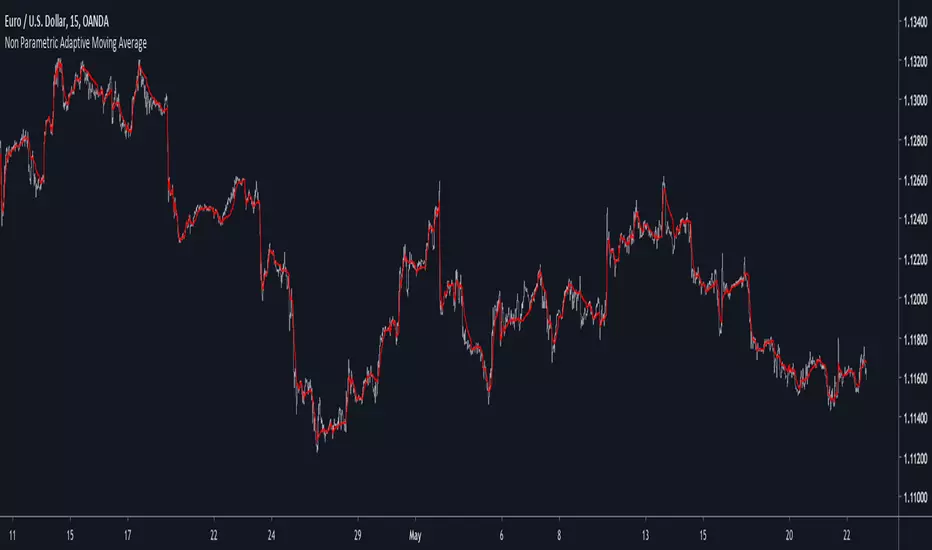
Not be confused with non-parametric statistics, i define a "non-parametric" indicator as an indicator who does not have any parameter input. Such indicators can be useful since they don't need to go through parameter optimization. I present here a non parametric adaptive moving average based on exponential averaging using a modified ratio of open-close to high-low range indicator as smoothing variable.
The Indicator
The ratio of open-close to high-low range is a measurement involving calculating the ratio between the absolute close/open price difference and the range (high - low) , now the relationship between high/low and open/close price has been studied in econometrics for some time but there are no reason that the ohlc range ratio may be an indicator of volatility, however we can make the hypothesis that trending markets contain less indecision than ranging market and that indecision is measured by the high/low movements, this is an idea that i've heard various time.
Since the range is always greater than the absolute close/open difference we have a scaled smoothing variable in a range of 0/1, this allow to perform exponential averaging. The ratio of open-close to high-low range is calculated using the vwap of the close/high/low/open price in order to increase the smoothing effect. The vwap tend to smooth more with low time frames than higher ones, since the indicator use vwap for the calculation of its smoothing variable, smoothing may differ depending on the time frame you are in.
1 minute tf
1 hour tf
Conclusion
Making non parametric indicators is quite efficient, but they wont necessarily outperform classical parametric indicators. I also presented a modified version of the ratio of open-close to high-low range who can provide a smoothing variable for exponential averaging. I hope the indicator can help you in any way.
Thanks for reading !
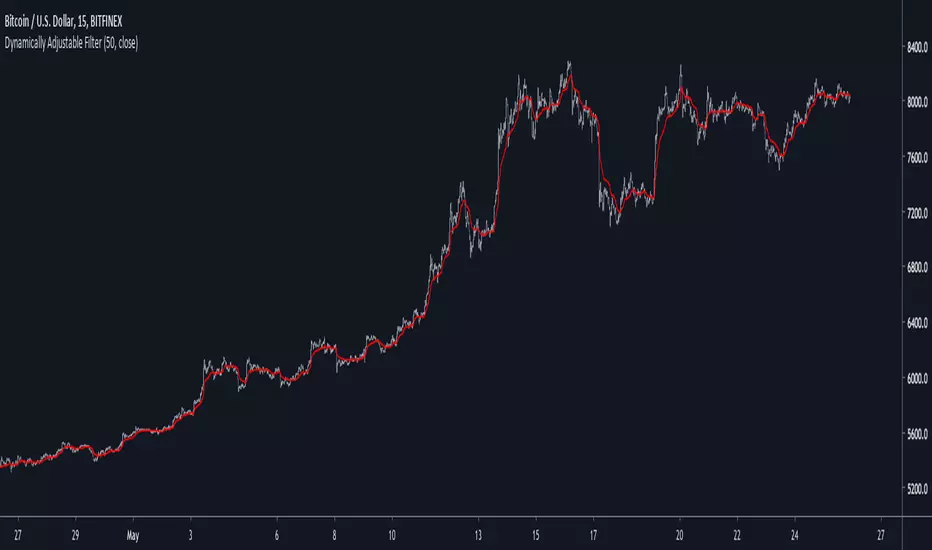
Dynamically Adjustable FilterIntroduction
Inspired from the Kalman filter this indicator aim to provide a good result in term of smoothness and reactivity while letting the user the option to increase/decrease smoothing.
Optimality And Dynamical Adjustment
This indicator is constructed in the same manner as many adaptive moving averages by using exponential averaging with a smoothing variable, this is described by :
x= x_1 + a(y - x_1)
where y is the input price (measurements) and a is the smoothing variable, with Kalman filters a is often replaced by K or Kalman Gain , this Gain is what adjust the estimate to the measurements. In the indicator K is calculated as follow :
K = Absolute Error of the estimate/(Absolute Error of the estimate + Measurements Dispersion * length)
The error of the estimate is just the absolute difference between the measurements and the estimate, the dispersion is the measurements standard deviation and length is a parameter controlling smoothness. K adjust to price volatility and try to provide a good estimate no matter the size of length . In order to increase reactivity the price input (measurements) has been summed with the estimate error.
Now this indicator use a fraction of what a Kalman filter use for its entire calculation, therefore the covariance update has been discarded as well as the extrapolation part.
About parameters length control the filter smoothness, the lag reduction option create more reactive results.
Conclusion
You can create smoothing variables for any adaptive indicator by using the : a/(a+b) form since this operation always return values between 0 and 1 as long as a and b are positive. Hope it help !
Thanks for reading !
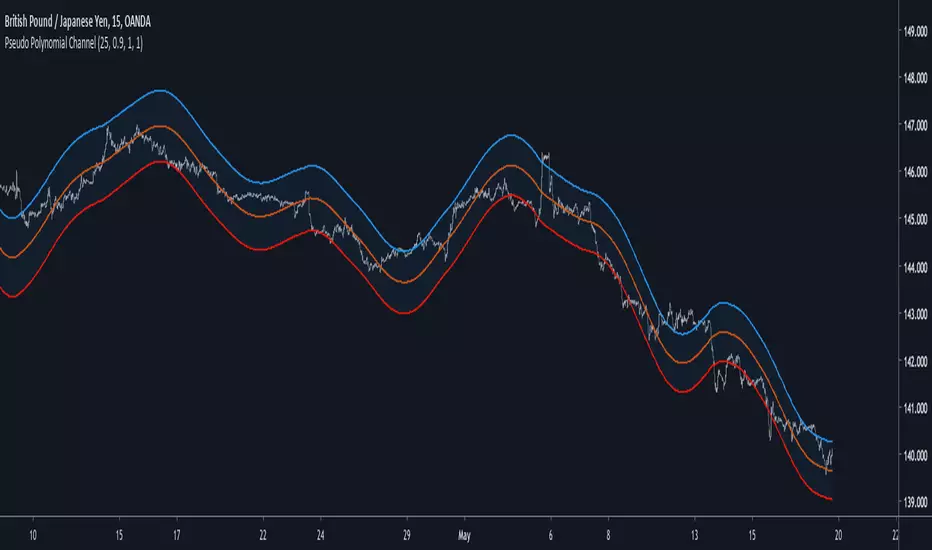
Pseudo Polynomial ChannelIntroduction
Back when i started using pine i made a script called periodic channel who aimed to rescale an average correlated sine wave to the price...don't worked very well. So i tried to fix problems induced by the indicator without much success, i had to redo it from scratch while abandoning the idea of rescaling correlated smooth functions to the price, at that time i also received requests regarding polynomial channel, some plateformes included this indicator, this led me to the idea to estimate it in order to both respond to the periodic channel problems and the requests i received, i have tried many many things and recently i tweaked a linear extrapolation to have an approximation.
Linear Extrapolation To Pseudo Polynomial Regression
I could be wrong but a polynomial regression must use constant parameters in order to provide a really smooth output, at least constant for a set of time. The moving averages forms (Savitzky-Golay moving average) who smooth polynomials across a window to the data don't have such smoothness, so how to estimate a polynomial regression while having a parameter providing control over the smoothness, a response to this is by using a recursive linear extrapolation. I posted a linear extrapolation indicator long ago, i used the same formula while adding a function to morph the output and the input in the form of :
morph * output + (1-morph) * input
How can this provide an estimate of a polynomial regression ? Well i'm not even sure myself but if you use the output as input (morph = 1) for the linear extrapolation function you should get a rough estimate of a line, this is what i thought at first and it proved to be right
Based on this observation i thought that it would be possible to get polynomial results by lowering morph, and as expected it worked well but showed a periodic pattern, this is why i smooth k in line 10.
0.9 for morph work well, higher values create sometimes smoother results but damage heavily the estimation.
Parameters
Morph have been introduced earlier, it control the amount of output and input the linear extrapolation should process, lower values create rougher but more stables results, if you see that the estimation is going nuts lower morph or change length, also lower length if you increase morph .
High overshoot, morph to 0.8 can help have a better estimation at the cost of less smoothness.
Length control the indicator smoothing, this parameter differ heavily from other filters, therefore low values can create mid/long term smoothing, it can also depend on which market instrument you are applying it, so there are no fixed optimal length.
Mult control how spread the bands are, to do so mult multiply the cumulative mean error, you can change this error measurement by anything you want like standard deviation/atr/range but take into account that you may create a separate parameter to control the error instead of length . Mult can be a float and like length can have different optimal values depending on the market the indicator is applied to.
Flatten do exactly what is name imply, it flatten the overall output to have a better estimation, can be a float. The result is less smooth.
Flatten = 2
More Exemples
BTCUSD length = 25 and mult = 4
XPDUSD length = 25 and mult = 1
ALPHABET length = 6 and morph = 0.99
Conclusion
I tried to estimate a polynomial channel by using recursion in the linear extrapolation function. This build is way more stable than the periodic channel but its still a bit inaccurate in my opinion. I hope this code can still help someone build something really nice, if so share your results :)
I apologize for those expecting a legit polynomial channel build but i really don't know how to do that, as i said parameters for the regression must be constants, i hope it still fine :)
Thanks for reading !
Falling-Rising FilterIntroduction
This is a modification of an old indicator i made. This filter aim to adapt to market trend by creating a smoothing constant using highest and lowest functions. This filter is visually similar to the edge-preserving filter, this similarity can make this filter quite good for MA cross strategies.
On The Filter Code
a = nz(a ) + alpha*nz(error ) + beta*nz(error )
The first 3 terms describe a simple exponential filter where error = price - a , beta introduce the adaptive part. beta is equal to 1 when the price is greater or lower than any past price over length period, else beta is equal to alpha , someone could ask why we use two smoothing variable (alpha, beta) instead of only beta thus having :
a = nz(a ) + beta*nz(error )
well alpha make the filter converge faster to the price thus having a better estimation.
In blue the filter using only beta and in red the filter using alpha and beta with both length = 200 , the red filter converge faster to the price, if you need smoother results but less precise estimation only use beta .
Conclusion
I have presented a simple indicator using rising/falling functions to calculate an adaptive filter, this also show that when you create an exponential filter you can use more terms instead of only a = a + alpha*(price - a ) . I hope you find this indicator useful.
Thanks for reading !