Template For Custom FIR Filters - Make Your Moving AverageIntroduction
FIR filters (finite impulse response) are widely used in technical analysis, there is the simple or arithmetic moving average, the triangular, the weighted, the least squares...etc. A FIR filter is characterized by the fact that its impulse response (the output of a filter using an impulse as input) is finite, this mean that the impulse response won't have infinite outputs unlike IIR filters.
They are extremely simple to design to, even without the Fourier transform, this is why i post this template that will let you create custom filters from step responses. Don't hesitate to post your results.
How It Works
Originally you create your filters from the frequency response you want your filter to have, this is because the inverse Fourier transform of the frequency response is the filter impulse response.
After that step you use convolution (convolution is the sum of the product between the signal and the impulse response) and you will have your filter. But we don't have Fourier transforms in pine so how can we possibly make FIR filters from convolution ? Well here the thing, the impulse response is the derivative of the step response and the step response is the sum of the impulse response, this mean we can create filters from step responses.
Step response of a moving average.
Step responses are easy to design, you just need a function that start at 0 and end up at 1.
How To Use The Template
All the work is done for you, the only thing you need to do is to enter your function at line 5 :
f(x)=> your function
For example if you want your filter to have a step response equal to sqrt(x) just enter :
f(x)=> sqrt(x)
This will give the following filter output :
You can create custom step responses from online graphing tools like fooplot or wolfram alpha, i recommend fooplot.
You can also design your filter step response from the line 14/15/16, b will be your filter step response, just use a , for example b = pow(a,2) , then replace output in plot by b and use overlay false, you can also plot step , if you like your step response copy the content of b and paste after f(x) => .
Filter Characteristics
The impulse response determine how many of a certain signal you want in your filter, this is also called weighting, you can think of filter design as cooking where your ingredients are the the signal at different periods and the impulse response determine how many of an ingredient you must include in the recipe. The step response can also tell you about your filter characteristics, for example :
This one converge faster to the step function, this mean that the filter will have less lag.
However this one converge slower to the step function, this mean the filter might have more lag but could be smoother.
Be aware that you must find a good weighting balance, else you can have output equals to the signal or just a delayed version of the signal without smoothing.
Real Case
Lets design a sine weighted moving average (swma), this FIR filter use the first 180 degrees of a sine wave function as impulse response.
Impulse response of the swma.
We can design it from the step response without much problems, remember that the impulse response is the derivative of the step response, therefore the derivative of the step response is equal to the first 180 degrees of a sine wave, the derivative of the cosine function is a sine function, therefore :
f(x)=> .5*(1 - cos(x*pi))
And voila.
Designing A BandPass Filter
The bandpass filter like a low-pass and high pass filter, you can think of it as a smooth oscillator.
To design a bandpass filter your step response must be bell shaped, or starting at 0 and ending at 0, for example :
f(x)=>sin(x*pi) give :
Conclusion
Just use fooplot and experiment, you could get nice filters, i will try to post some using this template but it would be really nice to have other people use it. If you need further help pm me.
Thanks for reading !
Smoothing
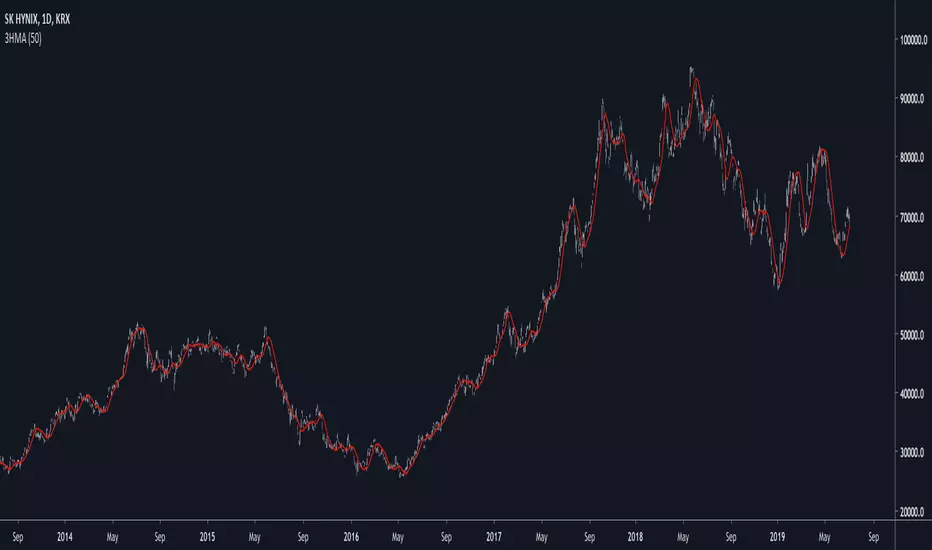
3HMAIntroduction
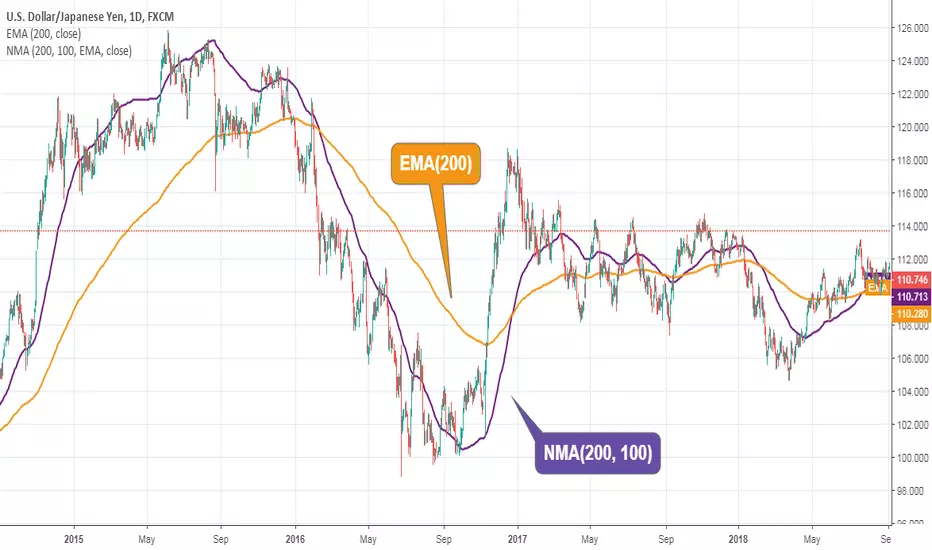
The Hull smoothing method aim to reduce the lag of a moving average by using a simple calculation involving smoothing with a moving average of period √p the subtraction of a moving average of period p/2 multiplied by 2 with another moving average of period p , however it is possible to extend this calculation by introducing more terms thus reducing both the lag and overshoot of the classical HMA.
Comparison
The proposed filter add 1 more term to the classical hull moving average thus ending with : sma(sma(p/3) * 3 - sma(p/2) - sma(p),p) , this can be developed as long as every terms add to total unity, more terms will often require more smoothing, this is why i replace √p by p .
In blue a HMA and in red the proposed filter of both period 50. The third term added allow for more reactivity which sometimes allow for overshoots with lower amplitudes.
Conclusions
Adding more terms to certain filtering methods can correct certain behaviours as well as reducing lag or increasing smoothing.
R2-Adaptive RegressionIntroduction
I already mentioned various problems associated with the lsma, one of them being overshoots, so here i propose to use an lsma using a developed and adaptive form of 1st order polynomial to provide several improvements to the lsma. This indicator will adapt to various coefficient of determinations while also using various recursions.
More In Depth
A 1st order polynomial is in the form : y = ax + b , our indicator however will use : y = a*x + a1*x1 + (1 - (a + a1))*y , where a is the coefficient of determination of a simple lsma and a1 the coefficient of determination of an lsma who try to best fit y to the price.
In some cases the coefficient of determination or r-squared is simply the squared correlation between the input and the lsma. The r-squared can tell you if something is trending or not because its the correlation between the rough price containing noise and an estimate of the trend (lsma) . Therefore the filter give more weight to x or x1 based on their respective r-squared, when both r-squared is low the filter give more weight to its precedent output value.
Comparison
lsma and R2 with both length = 100
The result of the R2 is rougher, faster, have less overshoot than the lsma and also adapt to market conditions.
Longer/Shorter terms period can increase the error compared to the lsma because of the R2 trying to adapt to the r-squared. The R2 can also provide good fits when there is an edge, this is due to the part where the lsma fit the filter output to the input (y2)
Conclusion
I presented a new kind of lsma that adapt itself to various coefficient of determination. The indicator can reduce the sum of squares because of its ability to reduce overshoot as well as remaining stationary when price is not trending. It can be interesting to apply exponential averaging with various smoothing constant as long as you use : (1- (alpha+alpha1)) at the end.
Thanks for reading

Well Rounded Moving AverageIntroduction
There are tons of filters, way to many, and some of them are redundant in the sense they produce the same results as others. The task to find an optimal filter is still a big challenge among technical analysis and engineering, a good filter is the Kalman filter who is one of the more precise filters out there. The optimal filter theorem state that : The optimal estimator has the form of a linear observer , this in short mean that an optimal filter must use measurements of the inputs and outputs, and this is what does the Kalman filter. I have tried myself to Kalman filters with more or less success as well as understanding optimality by studying Linear–quadratic–Gaussian control, i failed to get a complete understanding of those subjects but today i present a moving average filter (WRMA) constructed with all the knowledge i have in control theory and who aim to provide a very well response to market price, this mean low lag for fast decision timing and low overshoots for better precision.
Construction
An good filter must use information about its output, this is what exponential smoothing is about, simple exponential smoothing (EMA) is close to a simple moving average and can be defined as :
output = output(1) + α(input - output(1))
where α (alpha) is a smoothing constant, typically equal to 2/(Period+1) for the EMA.
This approach can be further developed by introducing more smoothing constants and output control (See double/triple exponential smoothing - alpha-beta filter) .
The moving average i propose will use only one smoothing constant, and is described as follow :
a = nz(a ) + alpha*nz(A )
b = nz(b ) + alpha*nz(B )
y = ema(a + b,p1)
A = src - y
B = src - ema(y,p2)
The filter is divided into two components a and b (more terms can add more control/effects if chosen well) , a adjust itself to the output error and is responsive while b is independent of the output and is mainly smoother, adding those components together create an output y , A is the output error and B is the error of an exponential moving average.
Comparison
There are a lot of low-lag filters out there, but the overshoots they induce in order to reduce lag is not a great effect. The first comparison is with a least square moving average, a moving average who fit a line in a price window of period length .
Lsma in blue and WRMA in red with both length = 100 . The lsma is a bit smoother but induce terrible overshoots
ZLMA in blue and WRMA in red with both length = 100 . The lag difference between each moving average is really low while VWRMA is way more precise.
Hull MA in blue and WRMA in red with both length = 100 . The Hull MA have similar overshoots than the LSMA.
Reduced overshoots moving average (ROMA) in blue and WRMA in red with both length = 100 . ROMA is an indicator i have made to reduce the overshoots of a LSMA, but at the end WRMA still reduce way more the overshoots while being smoother and having similar lag.
I have added a smoother version, just activate the extra smooth option in the indicator settings window. Here the result with length = 200 :
This result is a little bit similar to a 2 order Butterworth filter. Our filter have more overshoots which in this case could be useful to reduce the error with edges since other low pass filters tend to smooth their amplitude thus reducing edge estimation precision.
Conclusions
I have presented a well rounded filter in term of smoothness/stability and reactivity. Try to add more terms to have different results, you could maybe end up with interesting results, if its the case share them with the community :)
As for control theory i have seen neural networks integrated to Kalman flters which leaded to great accuracy, AI is everywhere and promise to be a game a changer in real time data smoothing. So i asked myself if it was possible for a neural networks to develop pinescript indicators, if yes then i could be replaced by AI ? Brrr how frightening.
Thanks for reading :)

Smoothed RWI(Random Walk Index)Smoothed Random Walk Index.
It gives slightly slower but less false signal than stochastic.
If it draws double bottom with higher low, long entry is considered.
If it draws double with lower high, short entry is considered.
For more accuracy, another smoothed RWI with slower setting is needed.
If fast setting RWI draws lower high AND slower setting RWI is also going down(red color),
short entry is considered with more confidence.

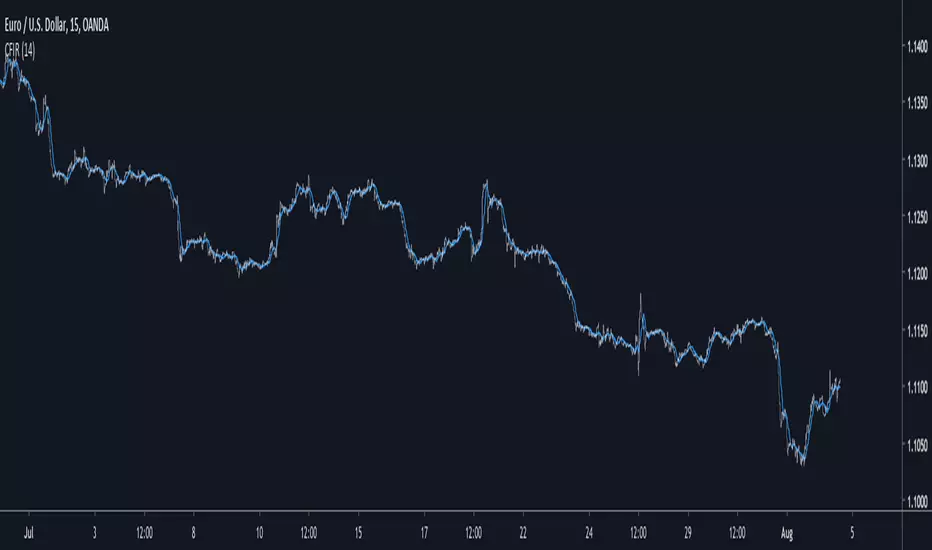
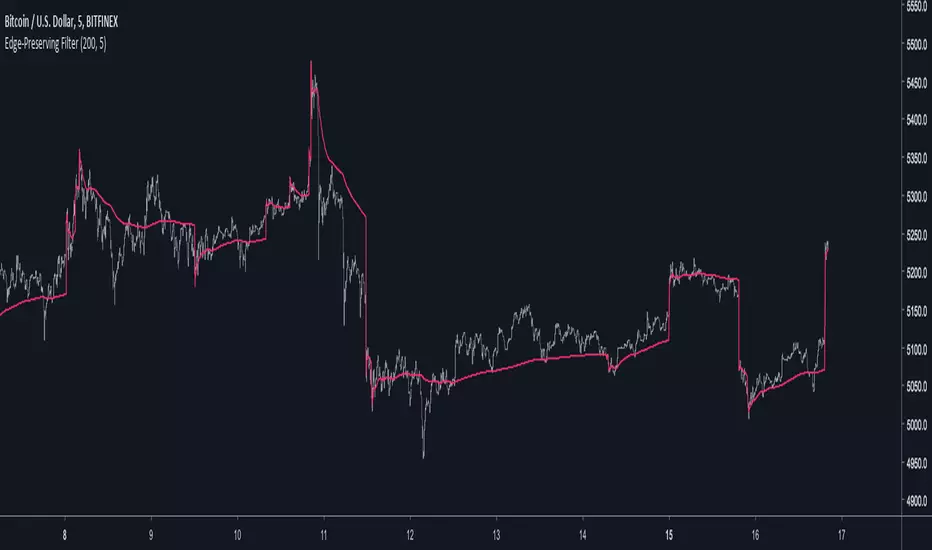
Edge-Preserving FilterIntroduction
Edge-preserving smoothing is often used in image processing in order to preserve edge information while filtering the remaining signal. I introduce two concepts in this indicator, edge preservation and an adaptive cumulative average allowing for fast edge-signal transition with period increase over time. This filter have nothing to do with classic filters for image processing, those filters use kernels convolution and are most of the time in a spatial domain.
Edge Detection Method
We want to minimize smoothing when an edge is detected, so our first goal is to detect an edge. An edge will be considered as being a peak or a valley, if you recall there is one of my indicator who aim to detect peaks and valley (reference at the bottom of the post) , since this estimation return binary outputs we will use it to tell our filter when to stop filtering.
Filtering Increase By Using Multi Steps Cumulative Average
The edge detection is a binary output, using a exponential smoothing could be possible and certainly more efficient but i wanted instead to try using a cumulative average approach because it smooth more and is a bit more original to use an adaptive architecture using something else than exponential averaging. A cumulative average is defined as the sum of the price and the previous value of the cumulative average and then this result is divided by n with n = number of data points. You could say that a cumulative average is a moving average with a linear increasing period.
So lets call CMA our cumulative average and n our divisor. When an edge is detected CMA = close price and n = 1 , else n is equal to previous n+1 and the CMA act as a normal cumulative average by summing its previous values with the price and dividing the sum by n until a new edge is detected, so there is a "no filtering state" and a "filtering state" with linear period increase transition, this is why its multi-steps.
The Filter
The filter have two parameters, a length parameter and a smooth parameter, length refer to the edge detection sensitivity, small values will detect short terms edges while higher values will detect more long terms edges. Smooth is directly related to the edge detection method, high values of smooth can avoid the detection of some edges.
smooth = 200
smooth = 50
smooth = 3
Conclusion
Preserving the price edges can be useful when it come to allow for reactivity during important price points, such filter can help with moving average crossover methods or can be used as a source for other indicators making those directly dependent of the edge detection.
Rsi with a period of 200 and our filter as source, will cross triggers line when an edge is detected
Feel free to share suggestions ! Thanks for reading !
References
Peak/Valley estimator used for the detection of edges in price.
Zero Phase Filtering [Repaint] - ExperimentalImportant !
The indicator is for experimental purpose only, it must not be used as a decisional tool but only as a visual one (like Zig-Zag, Fractal etc). The information this indicator display is uncertain and subject to drastic changes over time. If you have further question feel free to pm me.
Introduction
Most of the filters you will find are causal, this mean that they depend on present and past input values, this explain the lag they produce. Non causal filters however will use future input values. A well know way to get a zero-phase filter is by using the forward backward method, but this is not possible in pinescript as i recall. So we have to use some kind of function that will display future values, this is possible using the security function in version 2 or the one in version 3 using barmerge.lookahead_on .
The Use Of A Repainting Indicator
Its always better to filter data in order to have a clearer view of what is happening, this can be useful when doing some forecasting or doing less formal kind of analysis. However since it repaint you cant use it as a signal provider or use signals of other indicators using this filter as source.
For example if you want to forecast a smooth indicator, the forecast of this indicator under normal circumstances could still have lag associated with it, so you would have to react before your forecast, this wont happen if you apply this filter as your indicator source.
The Filter
We smooth with a simple moving average the price provided by the security function twice, length control the smoothing level. Since security depend on the time frame you are in you must select your time frame in the indicator parameter selection window.
Filtering using 45 minutes time frame close price in a 5 minutes chart, we fix this by selecting our time frame.
Consider the fact that the input of the indicator is just periodic price, so sometimes the lag can sometimes be less or more than 0 and the estimation not centered.
The indicator can work on time frames up to 1h, after that the filter have some lag, i tried fixing this and i ended up having data errors.
Applying our filter as source for the rsi oscillator.
Conclusion
It is possible to have a kind of zero-phase filters, but it would be better if pinescript could support backward indexing thus making us able to do forward backward filtering.
Since noise can affect our analysis, applying smoothing without having to use offset in plot can be considered useful.

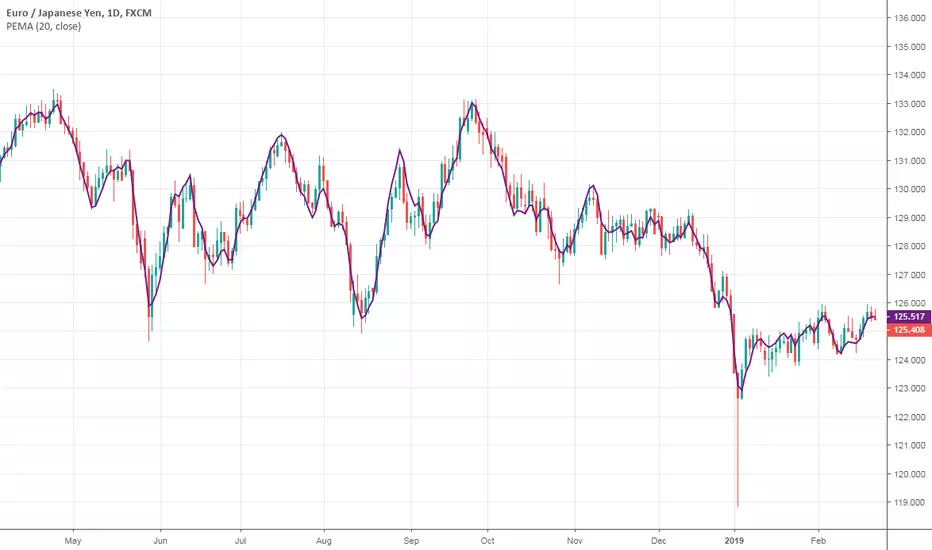
Pentuple Exponential Moving Average (PEMA)This type of moving average was originally developed by Bruno Pio in 2010. I just ported the original code from MetaTrader 5. The method uses a linear combination of EMA cascades to achieve better smoothness. Well, actually you can create your own X-uple EMA, but be sure that the combination' coefficients are valid.
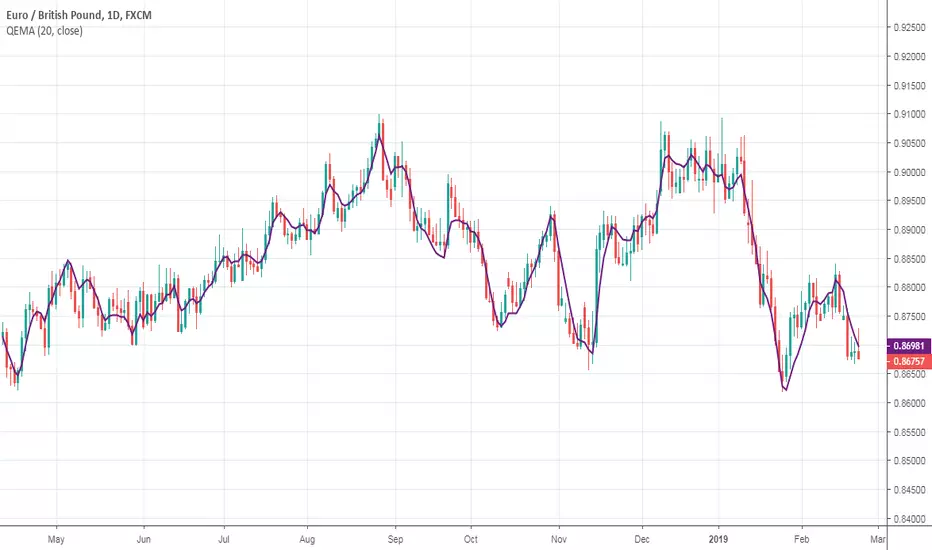
Quadruple Exponential Moving Average (QEMA)This type of moving average was originally developed by Bruno Pio in 2010. I just ported the original code from MetaTrader 5.
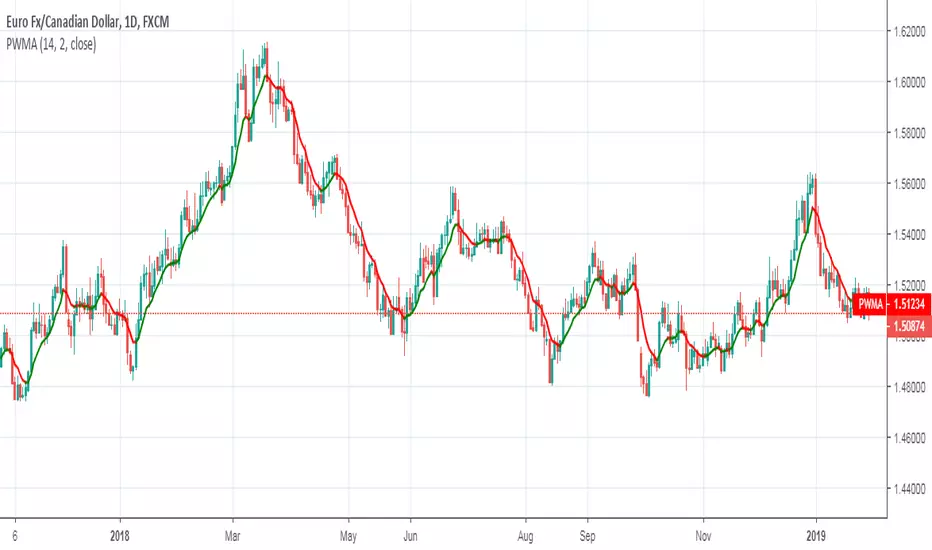
Parabolic Weighted Moving AverageThe weights of this moving average are powers of the weights of the standard weighted moving average WMA .
Remember:
When parameter Power = 0, you will get SMA .
When parameter Power = 1, you will get WMA .
Good luck!
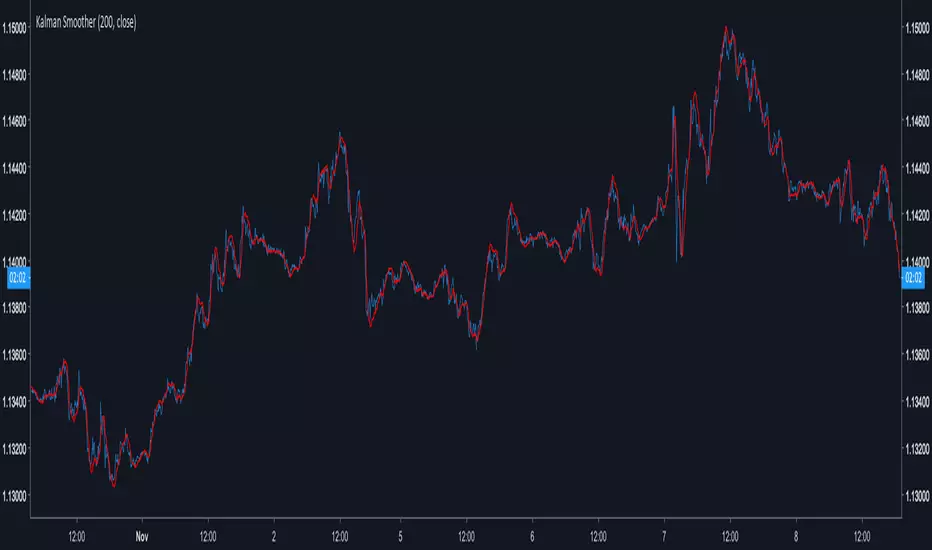
Kalman SmootherA derivation of the Kalman Filter.
Lower Gain values create smoother results.The ratio Smoothing/Lag is similar to any Low Lagging Filters.
The Gain parameter can be decimal numbers.
Kalman Smoothing With Gain = 20
For any questions/suggestions feel free to contact me
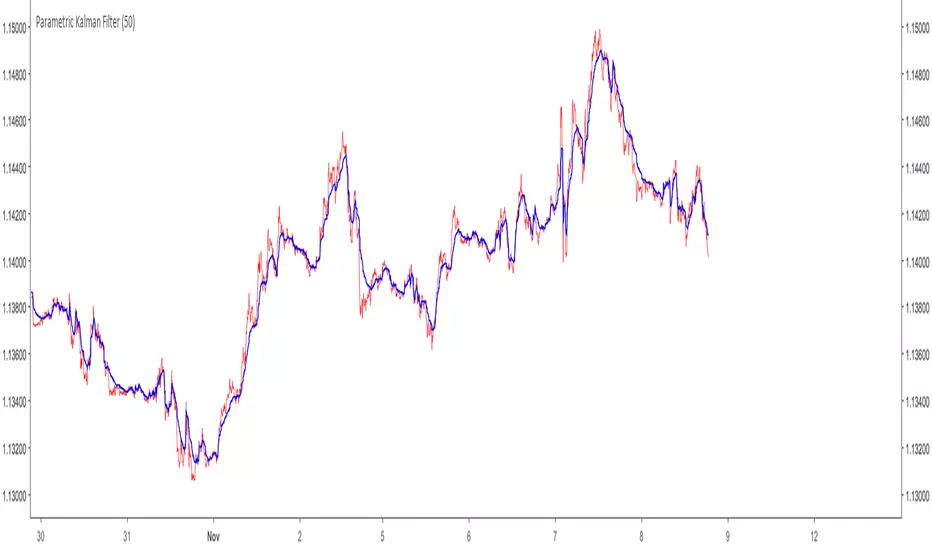
One Dimensional Parametric Kalman FilterA One Dimensional Kalman Filter, the particularity of Kalman Filtering is the constant recalculation of the Error between the measurements and the estimate.This version is modified to allow more/less filtering using an alternative calculation of the error measurement.
Camparison of the Kalman filter Red with a moving average Black of both period 50
Can be used as source for others indicators such as stochastic/rsi/moving averages...etc
For any questions/suggestions feel free to contact me

On Balance VolumeThis indicator was originally described by Joseph E. Granville in his book "Granville's New Key To Stock Market Profits" (1963).


Moving Average 3.0 (3rd Generation)Moving Average 3.0 (3rd Generation) script.
This indicator was originally developed and described by Dr. Manfred G. Dürschner in his paper "Gleitende Durchschnitte 3.0".
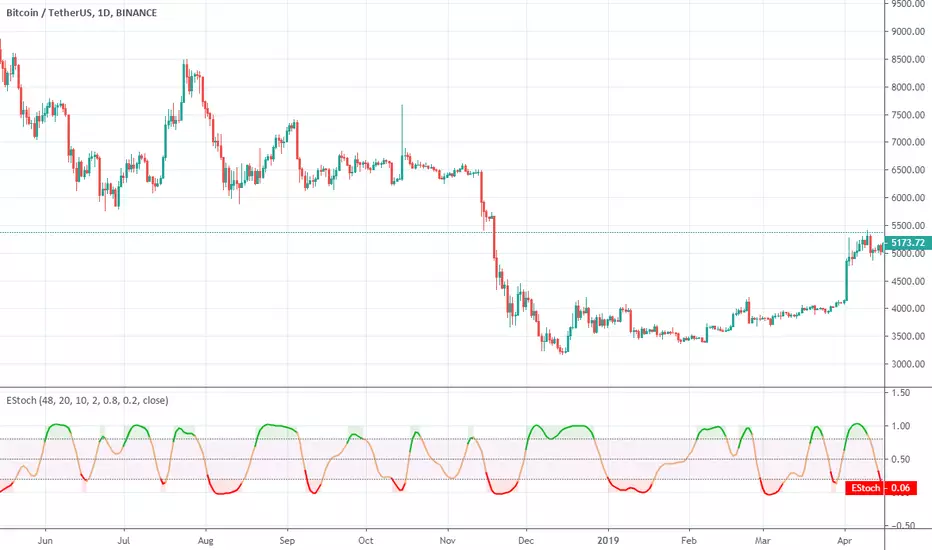
Ehlers StochasticEhlers Stochastic script.
This indicator was originally developed by John F. Ehlers (Stocks & Commodities V. 32:1: Predictive And Successful Indicators).
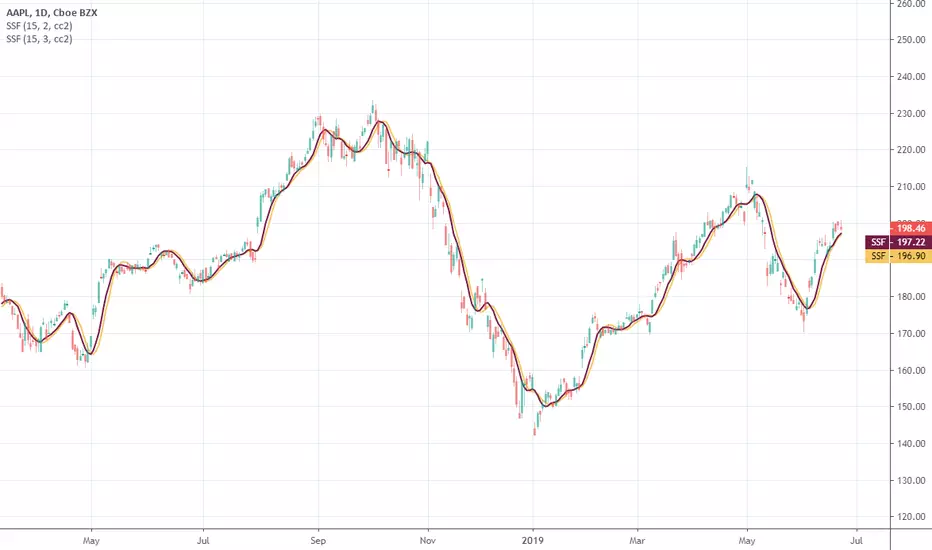
Ehlers Super Smoother FilterEhlers Super Smoother Filter script.
This indicator was originally developed by John F. Ehlers (see his book `Cybernetic Analysis for Stocks and Futures`, Chapter 13: `Super Smoothers`).
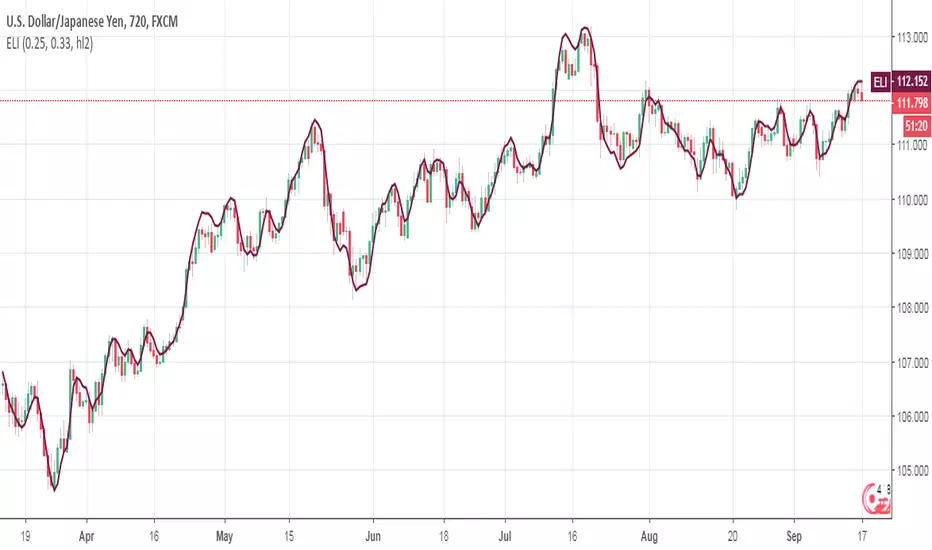
Ehlers Leading IndicatorEhlers Leading Indicator script.
This indicator was originally developed by John F. Ehlers (see his book `Cybernetic Analysis for Stocks and Futures`, Chapter 16: `Leading Indicators`).
Quadratic RegressionA quadratic regression is the process of finding the equation that best fits a set of data.This form of regression is mainly used for smoothing data shaped like a parabola.
Because we can use short/midterm/longterm periods we can say that we use a Quadratic Least Squares Moving Average or a Moving Quadratic Regression.
Like the Linear Regression (LSMA) a Quadratic regression attempt to minimize the sum of squares (sum of the squared difference between a set of data and an estimator), this is why
those kinds of filters have low lag .
Here the difference between a Least Squared Moving Average ( green ) and a Quadratic Regression ( red ) of both period 500
Here it look like the Quadratic Regression have a best fit than the LSMA

Hamming Windowed Volume Weighted Moving AverageApplying a window to the filter weights provides sometimes extra control over the characteristics of the filter.In this script an hamming window is applied to the volume before being used as a weight.In general this process smooth the frequency response of a filter.
Lets compare the classic vwma with hamming windowed vwma
Something i noticed is that windowed filters depending on their period ( high ones in general ) tend to make less bad crosses with the price ( at least with the hamming window )
Here are some data regarding number of crosses with period 50 with the hamming vwma in orange and the classic vwma in purple
Feel free to use the hamming window when using weighted filter.

Double Exponential SmoothingSingle Exponential Smoothing ( ema ) does not excel in following the data when there is a trend. This situation can be improved by the introduction of a second equation with a second constant gamma .
The gamma constant cant be lower than 0 and cant be greater than 1, higher values of gamma create less lag while preserving smoothness.Higher values of length must be followed by higher values of gamma in order to keep the lag low.
The first smoothing part consist of a classic ema but we add s-s1 to the previous smoothed value, this will help decrease lag.The second smoothing part then updates the trend, which is expressed as the difference between the last two values.

Holt Exponential Moving AverageHolt Exponential Moving Average indicator script.
This indicator was originally developed by Charles C. Holt (International Journal of Forecasting 20(1):5-10, March 2004: Forecasting seasonals and trends by exponentially weighted moving averages).
