SJA WINFUT B3-10
INDICATOR FOR WINFUT B3 – 5-minute chart.
This indicator was designed to trade the Bovespa index futures contract (WINFUT) on the 5-minute chart.
It integrates technical analysis and macroeconomic context elements.
It combines several indicators in which the system calculates a score weighted by color and intensity for each indicator, generating a metric called “STRENGTH %,” which reflects the dominance of buyers (green), sellers (red), or sideways movement (orange) at the moment.
The calculation is adapted to market hours:
Between 9:00 a.m. and 9:59 a.m., it considers only the available indicators; after 10:00 a.m., it uses all data.
The panel displays real-time information, including divergences between strength and price, providing robust decision support for short-term operations on the mini index.
Buying trend.
The more green indicators (at the top of the panel) and dark blue indicators (at the bottom of the panel) and the higher the strength percentage, the greater the probability of buying.
Selling trend.
The more red indicators (at the top of the panel) and dark blue indicators (at the bottom of the panel) and the higher the strength percentage, the greater the probability of selling.
Translated with DeepL.com (free version)
Statistics

SJA WINFUT B3-BRINDICATOR FOR WINFUT B3 – 5-minute chart.
This indicator was designed to trade the Bovespa index futures contract (WINFUT) on the 5-minute chart.
It integrates technical analysis and macroeconomic context elements.
It combines several indicators in which the system calculates a score weighted by color and intensity for each indicator, generating a metric called “STRENGTH %,” which reflects the dominance of buyers (green), sellers (red), or sideways movement (orange) at the moment.
The calculation is adapted to market hours:
Between 9:00 a.m. and 9:59 a.m., it considers only the available indicators; after 10:00 a.m., it uses all data.
The panel displays real-time information, including divergences between strength and price, providing robust decision support for short-term operations on the mini index.
Buying trend.
The more green indicators (at the top of the panel) and dark blue indicators (at the bottom of the panel) and the higher the strength percentage, the greater the probability of buying.
Selling trend.
The more red indicators (at the top of the panel) and dark blue indicators (at the bottom of the panel) and the higher the strength percentage, the greater the probability of selling.

JK_Traders_Reality_LibLibrary "JK_Traders_Reality_Lib"
This library contains common elements used in Traders Reality scripts
calcPvsra(pvsraVolume, pvsraHigh, pvsraLow, pvsraClose, pvsraOpen, redVectorColor, greenVectorColor, violetVectorColor, blueVectorColor, darkGreyCandleColor, lightGrayCandleColor)
calculate the pvsra candle color and return the color as well as an alert if a vector candle has apperared.
Situation "Climax"
Bars with volume >= 200% of the average volume of the 10 previous chart TFs, or bars
where the product of candle spread x candle volume is >= the highest for the 10 previous
chart time TFs.
Default Colors: Bull bars are green and bear bars are red.
Situation "Volume Rising Above Average"
Bars with volume >= 150% of the average volume of the 10 previous chart TFs.
Default Colors: Bull bars are blue and bear are violet.
Parameters:
pvsraVolume (float) : the instrument volume series (obtained from request.sequrity)
pvsraHigh (float) : the instrument high series (obtained from request.sequrity)
pvsraLow (float) : the instrument low series (obtained from request.sequrity)
pvsraClose (float) : the instrument close series (obtained from request.sequrity)
pvsraOpen (float) : the instrument open series (obtained from request.sequrity)
redVectorColor (simple color) : red vector candle color
greenVectorColor (simple color) : green vector candle color
violetVectorColor (simple color) : violet/pink vector candle color
blueVectorColor (simple color) : blue vector candle color
darkGreyCandleColor (simple color) : regular volume candle down candle color - not a vector
lightGrayCandleColor (simple color) : regular volume candle up candle color - not a vector
@return
adr(length, barsBack)
Parameters:
length (simple int) : how many elements of the series to calculate on
barsBack (simple int) : starting possition for the length calculation - current bar or some other value eg last bar
@return adr the adr for the specified lenght
adrHigh(adr, fromDo)
Calculate the ADR high given an ADR
Parameters:
adr (float) : the adr
fromDo (simple bool) : boolean flag, if false calculate traditional adr from high low of today, if true calcualte from exchange midnight
@return adrHigh the position of the adr high in price
adrLow(adr, fromDo)
Parameters:
adr (float) : the adr
fromDo (simple bool) : boolean flag, if false calculate traditional adr from high low of today, if true calcualte from exchange midnight
@return adrLow the position of the adr low in price
splitSessionString(sessXTime)
given a session in the format 0000-0100:23456 split out the hours and minutes
Parameters:
sessXTime (simple string) : the session time string usually in the format 0000-0100:23456
@return
calcSessionStartEnd(sessXTime, gmt)
calculate the start and end timestamps of the session
Parameters:
sessXTime (simple string) : the session time string usually in the format 0000-0100:23456
gmt (simple string) : the gmt offset string usually in the format GMT+1 or GMT+2 etc
@return
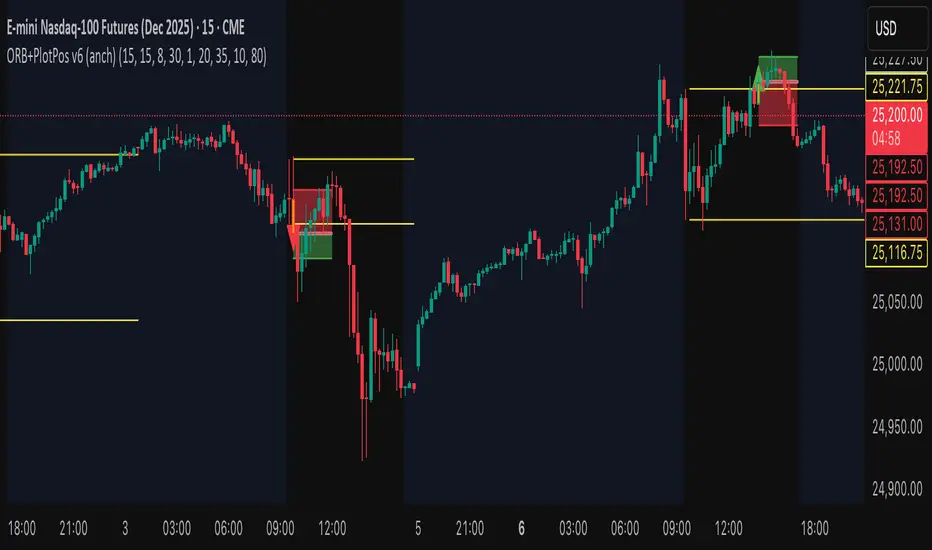
drawOpenRange(sessXTime, sessXcol, showOrX, gmt)
draw open range for a session
Parameters:
sessXTime (simple string) : session string in the format 0000-0100:23456
sessXcol (simple color) : the color to be used for the opening range box shading
showOrX (simple bool) : boolean flag to toggle displaying the opening range
gmt (simple string) : the gmt offset string usually in the format GMT+1 or GMT+2 etc
@return void
drawSessionHiLo(sessXTime, showRectangleX, showLabelX, sessXcolLabel, sessXLabel, gmt, sessionLineStyle)
Parameters:
sessXTime (simple string) : session string in the format 0000-0100:23456
showRectangleX (simple bool)
showLabelX (simple bool)
sessXcolLabel (simple color) : the color to be used for the hi/low lines and label
sessXLabel (simple string) : the session label text
gmt (simple string) : the gmt offset string usually in the format GMT+1 or GMT+2 etc
sessionLineStyle (simple string) : the line stile for the session high low lines
@return void
calcDst()
calculate market session dst on/off flags
@return indicating if DST is on or off for a particular region
timestampPreviousDayOfWeek(previousDayOfWeek, hourOfDay, gmtOffset, oneWeekMillis)
Timestamp any of the 6 previous days in the week (such as last Wednesday at 21 hours GMT)
Parameters:
previousDayOfWeek (simple string) : Monday or Satruday
hourOfDay (simple int) : the hour of the day when psy calc is to start
gmtOffset (simple string) : the gmt offset string usually in the format GMT+1 or GMT+2 etc
oneWeekMillis (simple int) : the amount if time for a week in milliseconds
@return the timestamp of the psy level calculation start time
getdayOpen()
get the daily open - basically exchange midnight
@return the daily open value which is float price
newBar(res)
new_bar: check if we're on a new bar within the session in a given resolution
Parameters:
res (simple string) : the desired resolution
@return true/false is a new bar for the session has started
toPips(val)
to_pips Convert value to pips
Parameters:
val (float) : the value to convert to pips
@return the value in pips
rLabel(ry, rtext, rstyle, rcolor, valid, labelXOffset)
a function that draws a right aligned lable for a series during the current bar
Parameters:
ry (float) : series float the y coordinate of the lable
rtext (simple string) : the text of the label
rstyle (simple string) : the style for the lable
rcolor (simple color) : the color for the label
valid (simple bool) : a boolean flag that allows for turning on or off a lable
labelXOffset (int) : how much to offset the label from the current position
rLabelOffset(ry, rtext, rstyle, rcolor, valid, labelOffset)
a function that draws a right aligned lable for a series during the current bar
Parameters:
ry (float) : series float the y coordinate of the lable
rtext (string) : the text of the label
rstyle (simple string) : the style for the lable
rcolor (simple color) : the color for the label
valid (simple bool) : a boolean flag that allows for turning on or off a lable
labelOffset (int)
rLabelLastBar(ry, rtext, rstyle, rcolor, valid, labelXOffset)
a function that draws a right aligned lable for a series only on the last bar
Parameters:
ry (float) : series float the y coordinate of the lable
rtext (string) : the text of the label
rstyle (simple string) : the style for the lable
rcolor (simple color) : the color for the label
valid (simple bool) : a boolean flag that allows for turning on or off a lable
labelXOffset (int) : how much to offset the label from the current position
drawLine(xSeries, res, tag, xColor, xStyle, xWidth, xExtend, isLabelValid, xLabelOffset, validTimeFrame)
a function that draws a line and a label for a series
Parameters:
xSeries (float) : series float the y coordinate of the line/label
res (simple string) : the desired resolution controlling when a new line will start
tag (simple string) : the text for the lable
xColor (simple color) : the color for the label
xStyle (simple string) : the style for the line
xWidth (simple int) : the width of the line
xExtend (simple string) : extend the line
isLabelValid (simple bool) : a boolean flag that allows for turning on or off a label
xLabelOffset (int)
validTimeFrame (simple bool) : a boolean flag that allows for turning on or off a line drawn
drawLineDO(xSeries, res, tag, xColor, xStyle, xWidth, xExtend, isLabelValid, xLabelOffset, validTimeFrame)
a function that draws a line and a label for the daily open series
Parameters:
xSeries (float) : series float the y coordinate of the line/label
res (simple string) : the desired resolution controlling when a new line will start
tag (simple string) : the text for the lable
xColor (simple color) : the color for the label
xStyle (simple string) : the style for the line
xWidth (simple int) : the width of the line
xExtend (simple string) : extend the line
isLabelValid (simple bool) : a boolean flag that allows for turning on or off a label
xLabelOffset (int)
validTimeFrame (simple bool) : a boolean flag that allows for turning on or off a line drawn
drawPivot(pivotLevel, res, tag, pivotColor, pivotLabelColor, pivotStyle, pivotWidth, pivotExtend, isLabelValid, validTimeFrame, levelStart, pivotLabelXOffset)
draw a pivot line - the line starts one day into the past
Parameters:
pivotLevel (float) : series of the pivot point
res (simple string) : the desired resolution
tag (simple string) : the text to appear
pivotColor (simple color) : the color of the line
pivotLabelColor (simple color) : the color of the label
pivotStyle (simple string) : the line style
pivotWidth (simple int) : the line width
pivotExtend (simple string) : extend the line
isLabelValid (simple bool) : boolean param allows to turn label on and off
validTimeFrame (simple bool) : only draw the line and label at a valid timeframe
levelStart (int) : basically when to start drawing the levels
pivotLabelXOffset (int) : how much to offset the label from its current postion
@return the pivot line series
getPvsraFlagByColor(pvsraColor, redVectorColor, greenVectorColor, violetVectorColor, blueVectorColor, lightGrayCandleColor)
convert the pvsra color to an internal code
Parameters:
pvsraColor (color) : the calculated pvsra color
redVectorColor (simple color) : the user defined red vector color
greenVectorColor (simple color) : the user defined green vector color
violetVectorColor (simple color) : the user defined violet vector color
blueVectorColor (simple color) : the user defined blue vector color
lightGrayCandleColor (simple color) : the user defined regular up candle color
@return pvsra internal code
updateZones(pvsra, direction, boxArr, maxlevels, pvsraHigh, pvsraLow, pvsraOpen, pvsraClose, transperancy, zoneupdatetype, zonecolor, zonetype, borderwidth, coloroverride, redVectorColor, greenVectorColor, violetVectorColor, blueVectorColor)
a function that draws the unrecovered vector candle zones
Parameters:
pvsra (int) : internal code
direction (simple int) : above or below the current pa
boxArr (array) : the array containing the boxes that need to be updated
maxlevels (simple int) : the maximum number of boxes to draw
pvsraHigh (float) : the pvsra high value series
pvsraLow (float) : the pvsra low value series
pvsraOpen (float) : the pvsra open value series
pvsraClose (float) : the pvsra close value series
transperancy (simple int) : the transparencfy of the vecor candle zones
zoneupdatetype (simple string) : the zone update type
zonecolor (simple color) : the zone color if overriden
zonetype (simple string) : the zone type
borderwidth (simple int) : the width of the border
coloroverride (simple bool) : if the color overriden
redVectorColor (simple color) : the user defined red vector color
greenVectorColor (simple color) : the user defined green vector color
violetVectorColor (simple color) : the user defined violet vector color
blueVectorColor (simple color) : the user defined blue vector color
cleanarr(arr)
clean an array from na values
Parameters:
arr (array) : the array to clean
@return if the array was cleaned
calcPsyLevels(oneWeekMillis, showPsylevels, psyType, sydDST)
calculate the psy levels
4 hour res based on how mt4 does it
mt4 code
int Li_4 = iBarShift(NULL, PERIOD_H4, iTime(NULL, PERIOD_W1, Li_0)) - 2 - Offset;
ObjectCreate("PsychHi", OBJ_TREND, 0, Time , iHigh(NULL, PERIOD_H4, iHighest(NULL, PERIOD_H4, MODE_HIGH, 2, Li_4)), iTime(NULL, PERIOD_W1, 0), iHigh(NULL, PERIOD_H4,
iHighest(NULL, PERIOD_H4, MODE_HIGH, 2, Li_4)));
so basically because the session is 8 hours and we are looking at a 4 hour resolution we only need to take the highest high an lowest low of 2 bars
we use the gmt offset to adjust the 0000-0800 session to Sydney open which is at 2100 during dst and at 2200 otherwize. (dst - spring foward, fall back)
keep in mind sydney is in the souther hemisphere so dst is oposite of when london and new york go into dst
Parameters:
oneWeekMillis (simple int) : a constant value
showPsylevels (simple bool) : should psy levels be calculated
psyType (simple string) : the type of Psylevels - crypto or forex
sydDST (bool) : is Sydney in DST
@return
adrHiLo(length, barsBack, fromDO)
Parameters:
length (simple int) : how many elements of the series to calculate on
barsBack (simple int) : starting possition for the length calculation - current bar or some other value eg last bar
fromDO (simple bool) : boolean flag, if false calculate traditional adr from high low of today, if true calcualte from exchange midnight
@return adr, adrLow and adrHigh - the adr, the position of the adr High and adr Low with respect to price
drawSessionHiloLite(sessXTime, showRectangleX, showLabelX, sessXcolLabel, sessXLabel, gmt, sessionLineStyle, sessXcol)
Parameters:
sessXTime (simple string) : session string in the format 0000-0100:23456
showRectangleX (simple bool)
showLabelX (simple bool)
sessXcolLabel (simple color) : the color to be used for the hi/low lines and label
sessXLabel (simple string) : the session label text
gmt (simple string) : the gmt offset string usually in the format GMT+1 or GMT+2 etc
sessionLineStyle (simple string) : the line stile for the session high low lines
sessXcol (simple color) : - the color for the box color that will color the session
@return void
msToHmsString(ms)
converts milliseconds into an hh:mm string. For example, 61000 ms to '0:01:01'
Parameters:
ms (int) : - the milliseconds to convert to hh:mm
@return string - the converted hh:mm string
countdownString(openToday, closeToday, showMarketsWeekends, oneDay)
that calculates how much time is left until the next session taking the session start and end times into account. Note this function does not work on intraday sessions.
Parameters:
openToday (int) : - timestamps of when the session opens in general - note its a series because the timestamp was created using the dst flag which is a series itself thus producing a timestamp series
closeToday (int) : - timestamp of when the session closes in general - note its a series because the timestamp was created using the dst flag which is a series itself thus producing a timestamp series
@return a countdown of when next the session opens or 'Open' if the session is open now
showMarketsWeekends (simple bool)
oneDay (simple int)
countdownStringSyd(sydOpenToday, sydCloseToday, showMarketsWeekends, oneDay)
that calculates how much time is left until the next session taking the session start and end times into account. special case of intraday sessions like sydney
Parameters:
sydOpenToday (int)
sydCloseToday (int)
showMarketsWeekends (simple bool)
oneDay (simple int)

Swing Data - SimplifiedThe swing data indicator by jfsrev but simplified. Thank you jfsrev for your work!
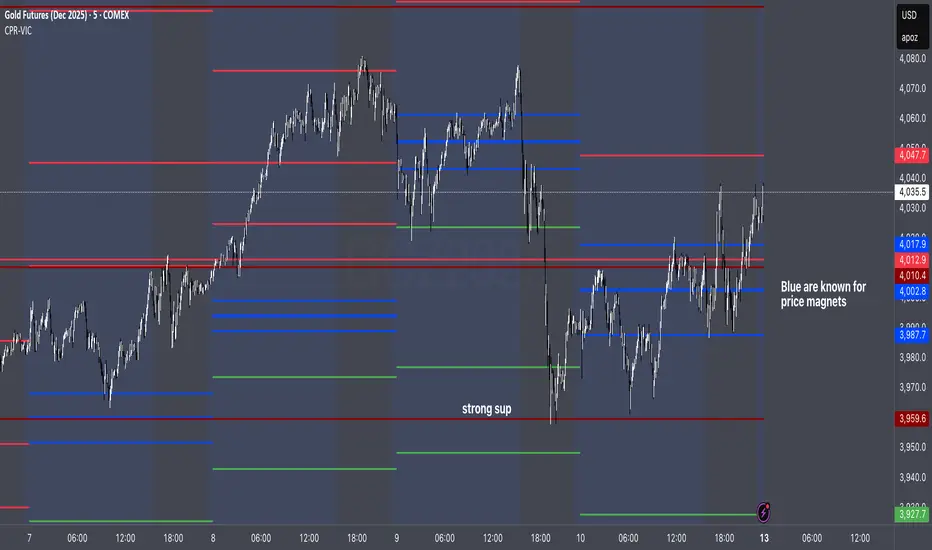
CPR by VictorVCentral Pivot Range
Where price is vs CPR
Above TC: bullish bias; TC/BC act as support. Hold above TC → trend day likely.
Inside CPR (BC–TC): balanced/choppy; expect mean reversion between edges until a clean break.
Below BC: bearish bias; BC/TC act as resistance.
Width of the CPR
Narrow: energy coiled → higher chance of breakout/trend day.
Wide: balanced market → range-bound behavior more likely.
Shift vs yesterday
CPR shifted up: bullish undertone.
Shifted down: bearish undertone.
Overlapping: neutral/indecisive.
Intraday tells
Acceptance: Several candles holding outside BC/TC = expansion in that direction.
Rejection: Wicks through BC/TC that close back inside = likely fade back toward the opposite edge.
Pivot (P) magnet: On non-trend days, price often gravitates back to P.
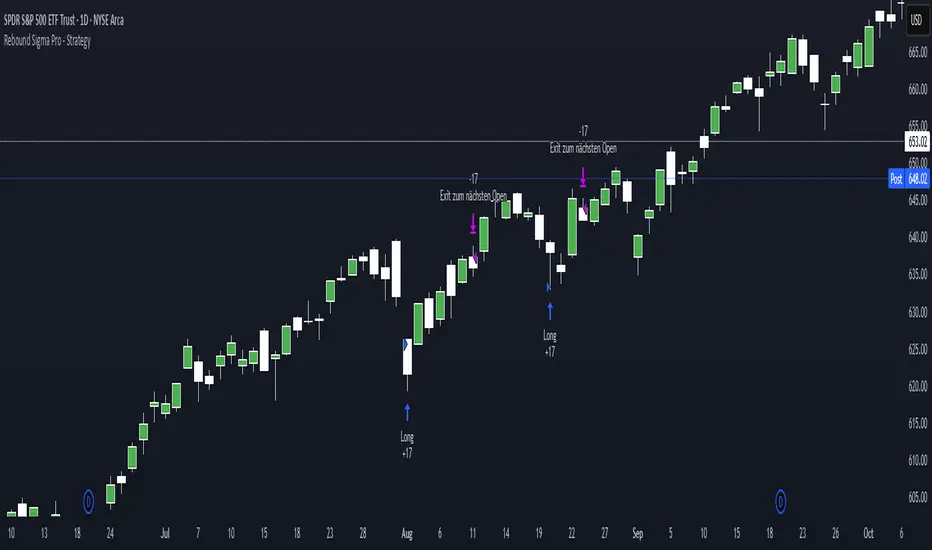
Rebound Sigma Pro - IndicatorOverview
Rebound Sigma Pro is a mean-reversion indicator that detects statistically oversold conditions in trending markets.
It helps traders identify potential short-term rebounds based on momentum exhaustion and volatility-adjusted entry zones.
Concept
The indicator combines two quantitative components:
Short-term momentum to detect short-term exhaustion
Trend filter to ensure setups align with the long-term direction
When a stock in an uptrend becomes temporarily oversold, a limit-entry signal is plotted.
The trade is then tracked until short-term conditions normalize or a time-based exit occurs.
Visual Signals
Green Triangle: Suggests placing a limit order for the next session
Green Circle: Confirms entry was filled
Red Triangle: Signals an exit for the next session’s open
Orange Background: Pending order
Green Background: Position active
Red Background: Exit phase
Yellow Line: Entry reference price
User Inputs
Limit Entry (% below previous close) – Default 1 %
Use Limit Entry – Switch between limit or market entries
Enable Time Exit – Optional holding-period constraint
Maximum Holding Days
All other internal parameters (momentum length, filters) are pre-configured.
Alerts
Limit Order Signal: New setup detected
Entry Confirmed: Order filled
Exit Signal: Exit expected next day
Usage
Designed for liquid equities and ETFs
Works best in confirmed uptrends
Backtesting encouraged to adapt parameters per symbol and timeframe
Notes
Not an automated strategy; manual order execution required
Past behavior does not imply future performance
Always apply sound position sizing and risk management
Disclaimer
This indicator is provided for educational and analytical purposes only.
It does not constitute financial advice or performance assurance.

Rebound Sigma Pro - StrategyOverview
Rebound Sigma Pro is a mean-reversion indicator that detects statistically oversold conditions in trending markets.
It helps traders identify potential short-term rebounds based on momentum exhaustion and volatility-adjusted entry zones.
Concept
The indicator combines two quantitative components:
Short-term momentum to detect short-term exhaustion
Trend filter to ensure setups align with the long-term direction
When a stock in an uptrend becomes temporarily oversold, a limit-entry signal is plotted.
The trade is then tracked until short-term conditions normalize or a time-based exit occurs.
Visual Signals
Green Triangle: Suggests placing a limit order for the next session
Green Circle: Confirms entry was filled
Red Triangle: Signals an exit for the next session’s open
Orange Background: Pending order
Green Background: Position active
Red Background: Exit phase
Yellow Line: Entry reference price
User Inputs
Limit Entry (% below previous close) – Default 1 %
Use Limit Entry – Switch between limit or market entries
Enable Time Exit – Optional holding-period constraint
Maximum Holding Days
All other internal parameters (momentum length, filters) are pre-configured.
Alerts
Limit Order Signal: New setup detected
Entry Confirmed: Order filled
Exit Signal: Exit expected next day
Usage
Designed for liquid equities and ETFs
Works best in confirmed uptrends
Backtesting encouraged to adapt parameters per symbol and timeframe
Notes
Not an automated strategy; manual order execution required
Past behavior does not imply future performance
Always apply sound position sizing and risk management
Disclaimer
This indicator is provided for educational and analytical purposes only.
It does not constitute financial advice or performance assurance.
Uptrick: Relative Strength Rotation SystemIntroduction
The Uptrick: Relative Strength Rotation System is an indicator engineered to implement a regime-aware tactical allocation strategy across a predefined set of user-specified assets. It visualizes a simulated equity curve produced by a closed, managed rotation engine. The system is designed to identify relative strength relationships dynamically and rotate into stronger-performing assets, while offering an optional fallback into a defensive state when market conditions are deemed unfavorable by the logic.
Overview
This indicator allocates capital by continuously evaluating the relative strength between all asset pairs within the selected group. Unlike simplistic momentum models or rank-based selectors, this system uses internally calculated scores that compare each asset across multiple dimensions, forming a comprehensive decision matrix. These scores are evaluated through a regime-aware layer that determines whether the system should remain invested or move into an idle allocation. The rotation logic is implemented through a rebalancing structure that maintains exposure to a single asset at any time, or transitions into a fallback asset such as cash or PAXG based on internal conditions. Outputs include a dynamically colored equity curve, context-sensitive labels, and optional overlays comparing buy-and-hold performance of the selected assets.
Originality
The indicator utilizes a scoring matrix based on custom asset-to-asset comparative ratios, resulting in a relational framework that evaluates assets in the context of each other rather than in isolation. Each asset is analyzed through multiple statistical dimensions, including trend strength and normalized deviation using Z-score calculations. These metrics form the foundation of an adaptive matrix used to derive consensus leadership. A key differentiator lies in the optional routing of idle allocations to PAXG—a tokenized gold asset—offering a non-cash defensive alternative that introduces both diversification and risk modulation not typically seen in rotation models. The engine also includes an override layer that filters decisions through market state awareness, adding tactical discipline during ambiguous or bearish regimes. Taken together, these features form a self-contained rotation mechanism with multiple embedded controls and fallback logic, all of which are abstracted from the user.
Inputs and Features
Exponential Length (EMA Length)
Specifies the smoothing length used by one of the internal scoring models. Lower values allow for more responsive asset comparisons, while longer values smooth out short-term volatility in score changes.
Z Score
Controls the statistical lookback length used for normalized relative comparisons. This Z-score is a cornerstone of the system’s comparative matrix, standardizing inter-asset ratio behaviors to detect statistically significant deviations from recent behavior. It allows the rotation engine to isolate and prioritize sustained leadership across assets, regardless of price volatility.
Rebalance Every N Bars
Sets how frequently the system evaluates potential changes in leadership. This controls the cadence of reallocation and can be tuned for faster or slower responsiveness.
When Bearish / Neutral, go to
Lets the user select how the system behaves during non-confirmed or bearish conditions. It can either route to a flat cash-equivalent state or into a user-defined defensive asset (such as PAXG), introducing an added layer of optional protection.
Cash Filter
Activates an override that forces the system into an idle state during unfavorable market regimes, even if a leader is otherwise present. This regime-aware mechanism adds another layer of conditional control to mitigate exposure risk.
Start Date
Defines the point in history from which the equity simulation begins. All calculations and equity values prior to this point are excluded.
Asset Inputs (Asset 1 to Asset 4)
Allow the user to specify up to four assets to be evaluated within the rotation universe. These may include crypto, forex, or other tradable symbols supported by TradingView.
PAXG Fallback Asset
Specifies the asset used as a fallback when the idle state is active and the defensive mode is set to PAXG rather than cash.
Color Settings
Users can customize the chart color palette for each asset and idle condition for enhanced clarity.
HODL Curve Toggles
Enable buy-and-hold equity curves for each input asset to be plotted for direct performance comparison with the system’s output.
Simple Mode
Reduces visual noise by simplifying the chart’s appearance and removing optional elements.
Background Color and Shadow Equity Fill
Offer additional styling options that reflect the system's current allocation, enhancing chart readability.
COLORED EQUITY CURVE - PAXG
COLORED EQUITY CURVE - CASH
SYSTEM
Current System Text Color
Allows further customization of label text for visibility across different asset themes.
Summary
The Uptrick: Relative Strength Rotation System is a rotation engine that leverages a proprietary scoring matrix to simulate tactical asset allocation. It analyzes inter-asset behavior through pairwise ratio metrics and statistically normalized scoring methods, enabling it to identify leadership dynamics within a defined universe. The inclusion of PAXG as a defensive fallback, regime-aware cash filtering, and customizable rebalancing cadence gives the system adaptability beyond traditional relative strength models. Users are provided with transparent visual feedback through an equity curve, contextual labels, buy-and-hold overlays, and real-time equity statistics. The system is not designed to disclose its internal mechanics, but it enables full visualization of its output and decisions for comparative analysis.
Disclaimer
This script is intended solely for educational and informational purposes. It does not constitute financial advice, trading signals, or an offer to buy or sell any financial instrument. Trading and investing carry risk, and past performance does not guarantee future outcomes. Users should perform their own research and consult a licensed financial advisor before making trading decisions.


AlphaRadar - Market📊 ALPHARADAR - MARKET MONITOR
⚠️ IMPORTANT
🔴 This indicator MUST be used ONLY on DAILY (1D) timeframe. It will not work correctly on other timeframes.
Overview:
Real-time market and sector performance dashboard displaying major US indices and all 11 sector ETFs in a single, organized panel. Track market rotation and sector strength at a glance.
Features:
- Market Indices (4): SPY (S&P 500), QQQ (Nasdaq), IWM (Russell 2000), DIA (Dow Jones)
- Sector ETFs (11): Complete coverage of all US market sectors
- Performance Tracking: Day, 5D, 1M, 6M, and YTD returns
- Color-Coded: 🟢 Green (positive) / 🔴 Red (negative) for instant visual analysis
What You Can Track:
✅ Market breadth (all indices moving together vs divergence)
✅ Sector rotation (which sectors are leading/lagging)
✅ Risk-on vs Risk-off sentiment
✅ Short-term momentum (Day, 5D)
✅ Medium-term trends (1M, 6M)
✅ Year-to-date performance leaders
Market Sectors Included:
- XLC (Communication)
- XLY (Consumer Discretionary)
- XLP (Consumer Staples)
- XLE (Energy)
- XLF (Financials)
- XLV (Healthcare)
- XLI (Industrials)
- XLB (Materials)
- XLRE (Real Estate)
- XLK (Technology)
- XLU (Utilities)
How to Use:
🔍 Spot Market Rotation: Identify which sectors are outperforming
📈 Confirm Trends: All green = strong market, all red = market weakness
⚡ Find Opportunities: Rotate into leading sectors, avoid lagging ones
🎯 Risk Management: Divergence between indices = potential warning signal
Best For:
- Sector rotation strategies
- Market breadth analysis
- Swing trading
- Portfolio allocation decisions
- Daily market monitoring
Notes:
- Data updates in real-time during market hours
- All calculations based on daily closing prices
- Works with any chart symbol
- Free to use
🔔 Remember: Use DAILY (1D) charts only!

CISD Risk Calculator for futures tradingCISD Risk Calculator Indicator Explanation
The CISD Risk Calculator is a specialized trading indicator that helps traders identify key market structure changes and automatically calculate optimal position sizing based on risk parameters. Here's a detailed explanation of what it does:
Core Functionality: CISD Detection
CISD stands for "Change In Structure Direction," which identifies important shifts in market structure:
Market Structure Analysis: The indicator constantly analyzes price action to detect when the market structure changes from bullish to bearish or vice versa.
Bullish CISD: Occurs when price makes a higher high, then retraces, but fails to make a lower low. This suggests a potential bullish continuation.
Bearish CISD: Occurs when price makes a lower low, then bounces, but fails to make a higher high. This suggests a potential bearish continuation.
Risk Calculation Features
The primary purpose of this modified indicator is to calculate trading risk:
Points Risk Calculation: The indicator measures the distance in points (price units) between the current price and the relevant structure level (high or low).
Automatic Contract Value Detection: It automatically detects what instrument you're trading (ES, NQ, MES, MNQ) and applies the correct point value:
NQ: $20 per point
MNQ: $2 per point
ES: $50 per point
MES: $5 per point
Position Sizing Calculation: Using your inputted dollar risk amount (e.g., $250), it calculates exactly how many contracts you should trade to maintain that risk level.
Visual Interface
The indicator has a minimalist design:
Central Display Panel: Shows key information at the top center of your chart:
CISD Type (Bullish or Bearish)
Points Risk (distance to your stop level)
Trade Risk (recommended number of contracts)
Invisible CISD Levels: The actual CISD lines and markers are completely invisible, keeping your chart clean while still performing calculations.
Simple Settings: Only shows essential settings:
Dollar Risk Amount: How much money you want to risk
Label Color and Text Color: For visual customization
Text Size: Adjusts the display size

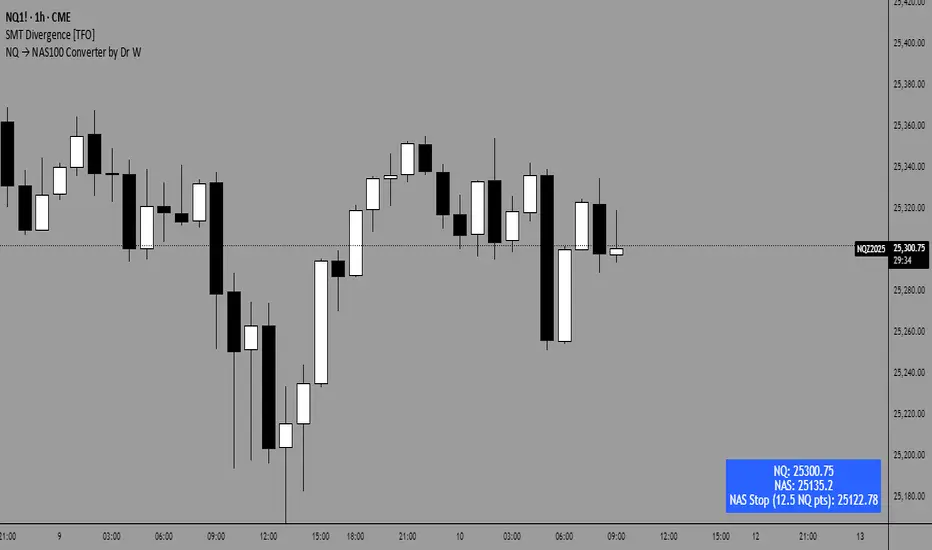
NQ → NAS100 Converter by Dr WThis indicator allows traders to quickly and accurately convert stop levels from NQ (E-mini Nasdaq futures) to NAS100 (CFD) values, helping users who trade across different instruments to manage risk consistently.
Key Features:
Real-time Price Conversion:
Displays the current NQ futures price and the corresponding NAS100 price on your chart, updated every bar.
Stop Distance Conversion:
Converts a user-defined stop distance in NQ points into the equivalent NAS100 stop level using proportional scaling based on current market prices.
Customizable Labels:
Choose between Candle-attached labels (appearing near the bar) or Chart-fixed labels (HUD style).
Adjust label position, background color, text color, and label style (left, right, center).
Flexible Display Options:
Show/hide NQ price, NAS100 price, and converted stop independently.
Perfect for traders who want a quick visual reference without cluttering the chart.
Trading Direction Support:
Select Long or Short trades, and the stop conversion automatically adapts to the trade direction.
How It Works:
The indicator requests the latest NQ and NAS100 prices at your chart’s timeframe.
It calculates the NAS100 stop using the formula:
NAS_Stop = NAS_Price ± (Stop_NQ_Points / NQ_Price * NAS_Price)
+ is used for short trades, - for long trades.
The converted stop, along with the underlying prices, is displayed according to your label settings.
Use Cases:
Risk management for cross-instrument traders.
Quickly visualizing equivalent stops when trading NQ futures vs NAS100 CFDs.
An educational tool to understand proportional stop sizing between instruments.
TradingView Policy Compliance Notes:
The indicator does not provide trading advice or signals; it only performs calculations and visualizations.
It does not execute trades or connect to brokerage accounts.
All values displayed are informational only; users should independently verify stop levels before placing trades.

Aladin Pair Trading System v1Aladin Pair Trading System v1
What is This Indicator?
The Aladin Pair Trading System is a sophisticated tool designed to help traders identify profitable opportunities by comparing two related stocks that historically move together. Think of it as finding when one twin is running ahead or lagging behind the other - these moments often present trading opportunities as they tend to return to moving together.
Who Should Use This?
Beginners: Learn about statistical arbitrage and pair trading
Intermediate Traders: Execute mean-reversion strategies with confidence
Advanced Traders: Fine-tune parameters for optimal pair relationships
Portfolio Managers: Implement market-neutral strategies
💡 What is Pair Trading?
Imagine two ice cream shops next to each other. They usually have similar customer traffic because they're in the same area. If one day Shop A is packed while Shop B is empty, you might expect this imbalance to correct itself soon.
Pair trading works the same way:
You find two stocks that normally move together (like TCS and Infosys)
When one stock moves too far from the other, you trade expecting them to realign
You buy the lagging stock and sell the leading stock
When they come back together, you profit from both sides
Key Features
1. Z-Score Analysis
What it is: A statistical measure showing how far the price relationship has deviated from normal
What it means:
Z-Score near 0 = Normal relationship
Z-Score at +2 = Stock A is expensive relative to Stock B (Sell A, Buy B)
Z-Score at -2 = Stock A is cheap relative to Stock B (Buy A, Sell B)
2. Multiple Timeframe Analysis
Long-term Z-Score (300 bars): Shows the big picture trend
Short-term Z-Score (100 bars): Shows recent movements
Signal Z-Score (20 bars): Generates quick trading signals
3. Statistical Validation
The indicator checks if the pair is suitable for trading:
Correlation (must be > 0.7): Confirms the stocks move together
1.0 = Perfect positive correlation
0.7 = Strong correlation
Below 0.7 = Warning: pair may not be reliable
ADF P-Value (should be < 0.05): Tests if the relationship is stable
Low value = Good for pair trading
High value = Relationship may be random
Cointegration: Confirms long-term equilibrium relationship
YES = Pair tends to revert to mean
NO = Pair may drift apart permanently
Visual Elements Explained
Chart Zones (Color-Coded Areas)
Yellow Zone (-1.5 to +1.5)
Normal Zone: Relationship is stable
Action: Wait for better opportunities
Blue Zone (±1.5 to ±2.0)
Entry Zone: Deviation is significant
Action: Prepare for potential trades
Green/Red Zone (±2.0 to ±3.0)
Opportunity Zone: Strong deviation
Action: High-probability trade setups
Beyond ±3.0
Risk Limit: Extreme deviation
Action: Either maximum opportunity or structural break
Signal Arrows
Green Arrow Up (Buy A + Sell B):
Stock A is undervalued relative to B
Buy Stock A, Short Stock B
Red Arrow Down (Sell A + Buy B):
Stock A is overvalued relative to B
Sell Stock A, Buy Stock B
Settings Guide
Symbol Inputs
Pair Symbol (Symbol B): Choose the second stock to compare
Default: NSE:INFY (Infosys)
Example pairs: TCS/INFY, HDFCBANK/ICICIBANK, RELIANCE/ONGC
Z-Score Parameters
Long Z-Score Period (300): Historical context
Short Z-Score Period (100): Recent trend
Signal Period (20): Trading signals
Z-Score Threshold (2.0): Entry trigger level
Higher = Fewer but stronger signals
Lower = More frequent signals
Statistical Parameters
Correlation Period (240): How many bars to check correlation
Hurst Exponent Period (50): Measures mean-reversion tendency
Probability Lookback (100): Historical probability calculations
Trading Parameters
Entry Threshold (0.0): Minimum Z-score for entry
Risk Threshold (1.5): Warning level
Risk Limit (3.0): Maximum deviation to trade
How to Use (Step-by-Step)
Step 1: Choose Your Pair
Add the indicator to your chart (this becomes Stock A)
In settings, select Stock B (the comparison stock)
Choose stocks from the same sector for best results
Step 2: Verify Pair Quality
Check the Statistics Table (top-right corner):
✅ Correlation > 0.70 (Green = Good)
✅ ADF P-value < 0.05 (Green = Good)
✅ Cointegrated = YES (Green = Good)
If all three are green, the pair is suitable for trading!
Step 3: Wait for Signals
BUY SIGNAL (Green Arrow Up)
Z-Score crosses above -2.0
Action: Buy Stock A, Sell Stock B
Exit: When Z-Score returns to 0
SELL SIGNAL (Red Arrow Down)
Z-Score crosses below +2.0
Action: Sell Stock A, Buy Stock B
Exit: When Z-Score returns to 0
Step 4: Risk Management
Yellow Zone: Monitor only
Blue Zone: Prepare for entry
Green/Red Zone: Active trading zone
Beyond ±3.0: Maximum risk - use caution
⚠️ Important Warnings
Not All Pairs Work: Always check the statistics table first
Market Conditions Matter: Correlation can break during market stress
Use Stop Losses: Set stops at Z-Score ±3.5 or beyond
Position Sizing: Trade both legs with appropriate hedge ratios
Transaction Costs: Factor in brokerage and slippage for both stocks
Example Trade
Scenario: TCS vs INFOSYS
Correlation: 0.85 ✅
Z-Score: -2.3 (TCS is cheap vs INFY)
Action to be taken:
Buy 1lot of TCS Future
Sell 1lot of INFOSYS Future
Expected Outcome:
As Z-Score moves toward 0, TCS outperforms INFOSYS
Close both positions when Z-Score crosses 0
Profit from the convergence
Best Practices
Test Before Trading: Use paper trading first
Sector Focus: Choose pairs from the same industry
Monitor Statistics: Check correlation daily
Avoid News Events: Don't trade pairs during earnings/major news
Size Appropriately: Start small, scale with experience
Be Patient: Wait for high-quality setups (±2.0 or beyond)
What Makes This Indicator Unique?
Multi-timeframe Z-Score analysis: Three different perspectives
Statistical validation: Built-in correlation and cointegration tests
Visual risk zones: Easy-to-understand color-coded areas
Real-time statistics: Live pair quality monitoring
Beginner-friendly: Clear signals with educational zones
Technical Background
The indicator uses:
Engle-Granger Cointegration Test: Validates pair relationship
ADF (Augmented Dickey-Fuller) Test: Tests stationarity
Pearson Correlation: Measures linear relationship
Z-Score Normalization: Standardizes deviations
Log Returns: Handles price differences properly
Support & Community
For questions, suggestions, or to share your pair trading experiences:
Comment below the indicator
Share your successful pair combinations
Report any issues for quick fixes
Disclaimer
This indicator is for educational and informational purposes only. It does not constitute financial advice. Pair trading involves risk, including the risk of loss.
Always:
Do your own research
Understand the risks
Trade with money you can afford to lose
Consider consulting a financial advisor
📌 Quick Reference Card
Z-ScoreInterpretationAction-3.0 to -2.0A very cheap vs BStrong Buy A, Sell B-2.0 to -1.5A cheap vs BBuy A, Sell B-1.5 to +1.5Normal rangeHold/Wait+1.5 to +2.0A expensive vs BSell A, Buy B+2.0 to +3.0A very expensive vs BStrong Sell A, Buy B
Good Pair Statistics:
Correlation: > 0.70
ADF P-value: < 0.05
Cointegration: YES
Version: 1.0
Last Updated: 10th October 2025
Compatible: TradingView Pine Script v6
Happy Trading!

FOREXSOM Session Boxes (Local Time) — Asian, London & New YorkFOREXSOM Session Boxes (Local Time) highlights the three major Forex sessions — Asian, London, and New York — using your chart’s local timezone automatically.
This indicator helps traders visualize market structure, liquidity zones, and timing across global trading hours with accuracy and clarity.
Key Features
Automatically adjusts to your chart’s local timezone
Highlights Asian, London, and New York sessions with clean color zones
Works on all timeframes and asset classes
Ideal for Smart Money Concepts (SMC), ICT, and price action strategies
Helps identify range breakouts, session highs/lows, and liquidity grabs
How It Works
Each session box updates in real time to show the current range as the market develops.
The boxes reset at the end of each session, making it easy to compare volatility and liquidity shifts between regions.
Sessions (default times):
Asian: 17:00 – 03:00
London: 02:00 – 11:00
New York: 07:00 – 16:00
How to Use
Add the indicator to your chart.
Ensure your chart timezone matches your local time in chart settings.
Watch session ranges form and look for liquidity sweeps or breakouts between overlaps (London/New York).
Created by FOREXSOM
Empowering traders worldwide with precision-built tools for Smart Money and institutional trading education.

KKF RangeIts a very unique range indicator that uses stochastics and volume bookmap and radp to view current trend to identify potential entries.
Date Marker📅 Date Marker
Date Marker is a simple, lightweight indicator that draws a single vertical line on a chosen date — ideal for quickly comparing how different charts looked at the same point in time.
Switch between symbols or timeframes, and the line automatically stays fixed at your selected date.
Perfect for studying market reactions to key events, earnings, announcements, or macro shifts.
Multi Brownian Forecast📊 Multi Brownian Forecast (Time-Adaptive, Probabilistic)
This indicator uses a sophisticated Geometric Brownian Motion (GBM) Monte Carlo simulation to project future price paths. It adapts to any chart timeframe and provides quantitative, multi-period probability signals.
---
🧠 Core Mathematical Methodology
The model relies on GBM, which is a continuous-time stochastic process that models asset prices.
1. Historical Analysis (Drift & Volatility):
* The script first calculates Logarithmic Returns over a user-defined Historical Lookback (Hours) .
* Drift ($\mu$): Computed as the average of the log returns.
* Volatility ($\sigma$): Computed as the standard deviation of the log returns.
* These values are then time-adapted to an hourly step, compensating for the chart's current timeframe (e.g., 5-minute, 1-hour).
2. Monte Carlo Simulation:
* It runs a specified Number of Simulations (e.g., 1000).
* For each simulation, the price is stepped forward hourly using the GBM formula, which incorporates the calculated drift and a random shock drawn from a normal distribution (generated via the Box-Muller transform ).
---
✨ Key Features
Probabilistic Quartile Forecast: Plots a dynamic "cone" of probability on the chart. It shows key price percentiles (Q1, Q2/Median, Q3, and Q4/Outer Bound) at the forecast's expiration, visualizing the expected range of price outcomes based on the simulations.
Multi-Period Probability Signals: This is the core signal feature. Users can define multiple, independent forecast periods (e.g., 4h, 16h, 48h) in a comma-separated list.
* For each period, a Probability Up and Probability Down is calculated based on hitting a custom Target Price Change (%) (e.g., 2%) at a certain confidence level given a simulation over the historical backlook.
* The probabilities are displayed in a chart table. The cell text turns white if the calculated probability exceeds the user-defined Signal Confidence (%) .
Conditional Fibonacci Retracement: Optionally displays a Fibonacci Retracement on the chart. This feature is only activated when one of the multi-period signals reaches its minimum confidence threshold, providing a contextual technical level when a probabilistic edge is found.

Force of Strategy (FoS, Multi TF/TA, Backtest, Alerts)Introducing the FoS Trading System
A comprehensive and innovative solution designed for both novice and experienced traders to enhance their intraday trading.
The basic idea of creating this script is to stay profitable in any market
Key Features:
There are over 25 no-repaint strategies for generating buy and sell signals to choose from
10 symbols for simultaneous trading
Webhook alerts in TTA format (tradingview to anywhere) pre-configured to send messages for trading cross-margin futures on major Crypto Exchanges: Binance, Bitget, BingX, Bybit, GateIO and OKX
A unique automated "Strategy switcher" feature for backtesting and live trading—not just a specific strategy, but the logic behind choosing a trading one or another strategy based on backtesting data obtained in real time
Advanced risk management options and backtest result metrics
Higher Timeframe filters (Technical Rating, ADX, Volatility) and ability for check backtest results with 9 main higher timeframes
Buy and sell signals are generated using TradingView Technical Ratings, indicators with adaptive length algorithms and various classic indicators with standard settings to avoid overfitting
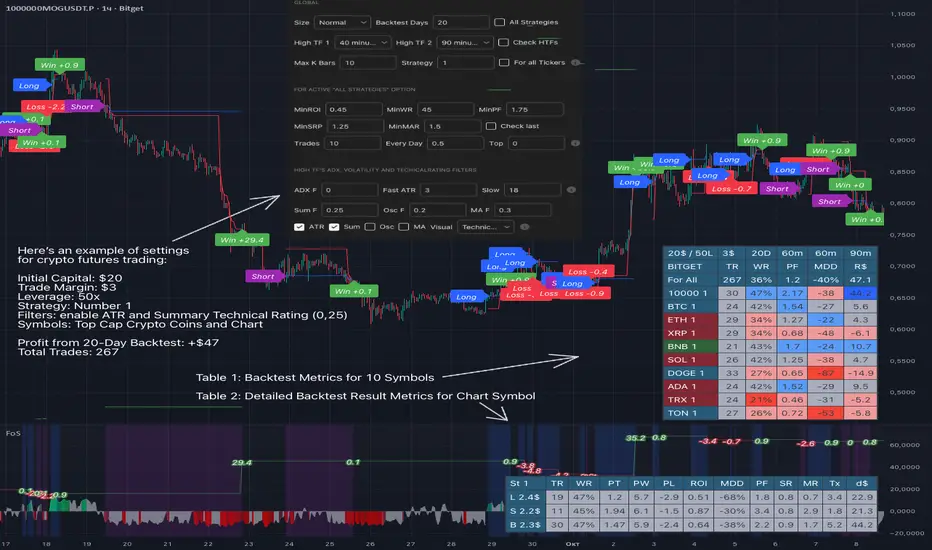
Next, I will describe in detail what this script does and what settings it operates with:
"All Strategies" off
- In the global settings block, as shown in the main chart screenshot, you select how long the script will perform backtests in days, with a limitation on the number of bars for calculations. This limitation is necessary to maintain an acceptable calculation speed. You also choose which two higher timeframes we will use for signal and filters when confirming the opening of trades
- With "All Strategies" off - as in the example on the main chart screenshot, trading is carried out by strategy #1 on 10 selected tickers simultaneously. By default, I selected the 9 top-capitalized cryptocurrencies on the Bitget exchange and the chart symbol. You can change that choice of 9 non chart opened instruments and # strategy for each them
- The first row in the table 1 shows some of the main choosen script settings, in attached example: initial capital 20$, leverage 50L, 20 backtest days, 3$ is invest in one deal, 60m - is chart timeframe, next 60m is higher timeframe 1 and last 90m is higher timeframe 2. In first column you see shortened to 5 characters ticker names
- The exchange name in the second row determines the alert messages format
I've attached another example of trading with setting "All strategies" off in the image below. In this example, trading 10 standard symbols on an hourly timeframe, 2 coins from 10: 1000SATS and DOGE have generated a profit of over $65 over the past 20 days using strategy #4
Can you browse a wide range of trading instruments and select the 10 best strategies and settings for future trading? Of course, trading is what this script is do!
The parameters in the table 1 mean the following:
TR - count of closed trading deals
WR - Winning Rate, PF - Profit Factor
MDD - Max Draw Down for all calculated time from initial capital
R$ - trading profit result in usd
The parameters in the table 2 is just more metrics for chart symbol:
PT - result in usd Per one Trade
PW - result Per Win, PL - result Per Lose
ROI - Rate of Investments
SR - Sharpe Ratio, MR - CalMAR ration
Tx - Commision Fee in Usd
R$ - trading profit result in usd again
Table 2 separate trade results of backtesting for longs and shorts. In first column you see how many USD were invested in one trade, taking into account possible position splitting (will be discussed in more detail in the risk management section)
Settings:
"All Strategies" on, "Check Last" off
When "All Strategies" is active, trading changed from 10 symbols and one strategy to all strategies and one chart symbol. If option "Check Last" is inactive you will see backtest results for each of strategy in backtest setting days. This is useful, for example, if you want to see backtest results under different settings over a long period of time for calibrating risk management or entry rules
"All Strategies" on, "Check Last" on
- If "All Strategies" and "Check Last" is active trading will occur on the chart symbol only for those strategies that meet the criteria of the settings block for the enabled "All Strategies" option. For example your criteria is: for last 5 trades for all strategies, open next trade only on strategy which reached ROI 25% and WinRate 50%. When strategy with this setting criteria receive Buy or Sell Signal this trade will be opened, and when trade will be close "check last" will repeat. This feature i called "Strategy switcher"
-In Table 1 if strategy meet criteria you will see "Ok" label, if strategy meet criteria and have maximum from other reached ROI they labeled "Best". Chart strategy labeled "Chart", Chart and Ok labels in one time is "Chart+", "Chart" and "Best" is labeled "Best+"
- The color in the first column of table 1 indicates that the strategy is currently in an open position: green means an open long position, red means an open short position.
In picture bellow you will see good example for trading with check results for last 10 trades, and make desicion for trading when criteries 0.25 ROI and WinRate 50% reached for Top 2 by ROI strategies from all list of them. This example of trading logic in last 20 days (include periods when strategy don't arise 10 trades) give a profit $30+. At the bottom of the screen, you can see Labels with the numbers of the strategies that opened the trades. In this example, trades were primarily opened using strategy number 2, and the second most effective strategy after the 20-day backtest was strategy number 9
Who can promise you'll make a profit of $30 in the next 20 days with a drawdown of no more than $8 from the initial $20 with invest in one trade just 2.7$? No one. But this script guarantees that in the future it will repeat the same logic of switching trading strategies that brought profit over the last 20 days
Risk management options
- When a buy or sell trade is opened, you'll see three lines on the chart: a red stop-loss line (SL), a green take-profit line (TP), and a blue line representing the entry price. The trade will be closed if the high price or low price reaches the line TP or SL (no wait for bar close) and alert will be triggered once per bar when script recalculates
- Several options are available to control the behavior of SL/TP lines, such as stop-loss by percentage, ATR, or Highest High (HH) and Lowest Low (LL). Take Profit can be in percent, ATR or in Risk Reward ratio. There some Trailing Stop with start trail trigger options, like ATR, percent or HH / LL
- Additionally, in risk managment settings a function has been implemented for adding a position when the breakeven level expressed in the current ROI is reached for opened trade (splitting position). The position is added within the bar.
- Webhook alerts in TTA format with message contained next info : Buy / Sell or adding Quantity, Leverage, SL price, TP price and close trade
Keep in mind if the stop-loss changed when adding a position, the stop-loss will not be able to be higher than the current bar's low price, regardless of your settings, as backtest trades do not use intra-bar data, in this situation SL will be correct at next bar (but alert message don't be sended twice). And please note that this script does not have an option to simultaneously open trades in different directions. Only 1 trade can be opened for 1 trading instrument at a time
Backtest Engine
Backtest is a very important part of this script. Here describe how its calculate:
- Profit or Loss is USD: close trade price * open trade quantity - open trade price * open trade quantity - open trade quantity * (open trade price + close trade price)/2 * commision fee
Possible slippage or alert sending delay needed to be include in commission % which you will set in risk managment settings block, default settings is 0.15% (0,06% for open, 0,06% for close and 0,03% for possible slippage or additional fees)
- Maximum Draw Down: Drawdown = (peak - current equity) / peak * 100 ;
Drawdown > maxDrawdown ? maxDrawdown = Drawdown
- ROI: profit result in USD / sum of all positions margin
- CalMAR Ratio: ROI / (-MaxDrawDown)
- Sharpe Ratio: ROI / standard deviation for (Sum of all Profits and Loses) / (Sum of all Position Margins)
This description was added because in metrics i don't use parameters like "The risk-free rate of return". Keep in mind how exactly this script calculate profit and perfomance when adjusting key criteria in the strategy switching parameters block of script settings
Strategies itself
For trading, you can enable or disable various Higher Timeframes Filters (ADX, volatility, technical rating).
With filters enabled, trades will only open when the setting parameters are reached
- Strategy number 1, 2 and 3: is Higher Timeframe TradingView Technical Ratings itself, 1 is summary total rating, 2 is oscillators and 3 is moving averages. When TR filter cross filter levels trade will be open at chart bar close. By Default on chart you see Summary Technical Rating oscillator, but here the options for change it to Oscillator TR or Moving Average TR
- Strategy number 4, 5 and 6: is Chart TimeFrame TR. Trades will open when its values (Summary, Oscillators and Moving Averages) reached setting buy sell level
- Strategy number 7, 8 and 9: is Alternative buy sell logic for Chart TimeFrame TR, trades will open when counting rising or falling values will be reached
- Strategies with number from 10 to 18: is chosen by user adaptive moving averages and oscillators indicators. There in settings you will see many different adaptive length algorithms for trading and different types of moving averages and oscillators. In tooltips in settings you will find very more information, and in settings you will see list of all indicators and algorithms (more than 30 variations). All adaptive strategies have their options in settings for calibrating and plotting
- Strategies with number from 19: its can't be chosen or calibarted, this is needed for avoid overfitting, i try to found mostly time worked strategies and use its with standard settings. In future it's possible to changing current or adding additional strategies. At the time of publication this script uses: Dynamic Swing HH LL (19), Composite indicator (20), %R Exhausting with different signals (21,22,23), Pivot Point SuperTrend (24), Ichimoku Cloud (25), TSI (26), Fib Level RSI (27). I don't plot classic strategies in this script
Let me explain, the value of this script is not in the strategies it includes, but in how exactly it collects the results of their work, how it filters the opening of trades, what risk management it applies and what strategy switching logic it performs. The system itself that you are now reading about represents the main value of this script
Finally if you get access for this script
- You will see many other not described options and possibilities like Kelly position or list of settings for adaptive strategies, also i added many usefull tooltips in script settings
Happy trading, and stay tuned for updates!
DISCLAIMER: No sharing, copying, reselling, modifying, or any other forms of use are authorized for this script, and the information published with them. This script is strictly for individual use. No one know future and Investments are always made at your own risk. I am not responsible for any losses you may incur. Please before investment make sure that chosen logic is enaugh profitable on virtual demo account.
Smart Money Volume Activity [AlgoAlpha]🟠 OVERVIEW
This tool visualizes how Smart Money and Retail participants behave through lower-timeframe volume analysis. It detects volume spikes far beyond normal activity, classifies them as institutional or retail, and projects those zones as reactive levels. The script updates dynamically with each bar, showing when large players enter while tracking whether those events remain profitable. Each event is drawn as a horizontal line with bubble markers and summarized in a live P/L table comparing Smart Money versus Retail.
🟠 CONCEPTS
The core logic uses Z-score normalization on lower-timeframe volumes (like 5m inside a 1h chart). This lets the script detect statistically extreme bursts of buying or selling activity. It classifies each detected event as:
Smart Money — volume inside the candle body (suggesting hidden accumulation or distribution)
Retail — volume closing at bar extremes (suggesting chase entries or panic exits)
When new events appear, the script plots them as horizontal levels that persist until price interacts again. Each level acts as a potential reaction zone or liquidity footprint. The integrated P/L table then measures which class (Retail or Smart Money) is currently “winning” — comparing cumulative profitable versus losing volume.
🟠 FEATURES
Classifies flows into Smart Money or Retail based on candle-body context.
Displays live P/L comparison table for Smart vs Retail performance.
Alerts for each detected Smart or Retail buy/sell event.
🟠 USAGE
Setup : Add the script to any chart. Set Lower Timeframe Value (e.g., “5” for 5m) smaller than your main chart timeframe. The Period input controls how many bars are analyzed for the Z-score baseline. The Threshold (|Z|) decides how extreme a volume must be to plot a level.
Read the chart : Horizontal lines mark where heavy Smart or Retail volume occurred. Bright bubbles show the strongest events — their size reflects Z-score intensity. The on-chart table updates live: green cells show profitable flows, red cells show losing flows. A dominant green Smart Money row suggests institutions are currently controlling price.
See what others are doing :
Settings that matter : Raising Threshold (|Z|) filters noise, showing only large players. Increasing Period smooths results but reacts slower to new bursts. Use Show = “Both” for full comparison or isolate “Smart Money” / “Retail” to focus on one class.

Blocks🔍 On-Chain Analytics Overview
This indicator compares key on-chain metrics against their 55-day and 111-day moving averages to evaluate the network’s overall health.
It helps visualize trends in user activity, transaction dynamics, and market valuation to identify potential shifts in market sentiment.
📊 Core Metrics
Active Addresses: The number of unique addresses actively interacting with the network. An increase suggests higher user engagement and network utilization.
New Address Count: The number of newly created wallets. A decline may indicate slowing user adoption or lower retail participation.
Non-zero Balance Addresses: Addresses holding a non-zero balance — a metric of long-term adoption and retention.
Active Supply (1Y): The percentage of supply that has moved within the last year. Lower values imply stronger “HODL” behavior and long-term confidence.
Realized Market Value: Represents the total value of coins based on their last on-chain movement, reflecting the cost basis of holders.
Market Value: The current market capitalization derived from price × circulating supply.
Large Transaction Count / Volume: Measures institutional or whale-level activity. Spikes may indicate accumulation or distribution phases.
90-day NVT (Network Value to Transaction Volume): A valuation metric comparing network value to transaction activity.
High NVT → Overvalued or speculative phase
Low NVT → Undervalued or high on-chain utility
Daily Transaction Count: Indicates on-chain activity levels; rising values often precede bullish momentum.
Transaction Fees (USD): Network demand indicator — rising fees can reflect congestion or growing user activity.
Top Holder Addresses: Tracks concentration among top wallets (e.g., top 0.1%, 0.001%), offering insights into wealth distribution and whale dominance.
⚙️ Delta & Score System
Δ (Delta): Shows deviation from the long-term average (MA-55 / MA-111).
Positive Delta → Metric above historical norm (strength or overheating)
Negative Delta → Metric below historical norm (weakness or cooling)
Score Icons:
✅ = Healthy / Positive trend
⚠️ = Mixed or Neutral signal
🔻 = Caution / Negative trend
🧭 Interpretation
A cluster of green checkmarks (✅) signals robust network fundamentals — often supportive of long-term growth.
A dominance of warnings (⚠️) or red signals (🔻) indicates network slowdowns or profit-taking phases.

Market Structure Report Library [TradingFinder]🔵 Introduction
Market Structure is one of the most fundamental concepts in Price Action and Smart Money theory. In simple terms, it represents how price moves between highs and lows and reveals which phase of the market cycle we are currently in uptrend, downtrend, or transition.
Each structure in the market is formed by a combination of Breaks of Structure (BoS) and Changes of Character (CHoCH) :
BoS occurs when the market breaks a previous high or low, confirming the continuation of the current trend.
CHoCH occurs when price breaks in the opposite direction for the first time, signaling a potential trend reversal.
Since price movement is inherently fractal, market structure can be analyzed on two distinct levels :
Major / External Structure: represents the dominant macro trend.
Minor / Internal Structure: represents corrective or smaller-scale movements within the larger trend.
🔵 Library Purpose
The “Market Structure Report Library” is designed to automatically detect the current market structure type in real time.
Without drawing or displaying any visuals, it analyzes raw price data and returns a series of logical and textual outputs (Return Values) that describe the current structural state of the market.
It provides the following information :
Trend Type :
External Trend (Major): Up Trend, Down Trend, No Trend
Internal Trend (Minor): Up Trend, Down Trend, No Trend
Structure Type :
BoS : Confirms trend continuation
CHoCH : Indicates a potential trend reversal
Consecutive BoS Counter : Measures trend strength on both Major and Minor levels.
Candle Type : Returns the current candle’s condition(Bullish, Bearish, Doji)
This library is specifically designed for use in Smart Money–based screeners, indicators, and algorithmic strategies.
It can analyze multiple symbols and timeframes simultaneously and return the exact structure type (BoS or CHoCH) and trend direction for each.
🔵 Function Outputs
The function MS() processes the price data and returns seven key outputs,
each representing a distinct structural state of the market. These values can be used in indicators, strategies, or multi-symbol screeners.
🟣 ExternalTrend
Type : string
Description : Represents the direction of the Major (External) market structure.
Possible values :
Up Trend
Down Trend
No Trend
This is determined based on the behavior of Major Pivots (swing highs/lows).
🟣 InternalTrend
Type : string
Description : Represents the direction of the Minor (Internal) market structure.
Possible values :
Up Trend
Down Trend
No Trend
🟣 M_State
Type : string
Description : Specifies the type of the latest Major Structure event.
Possible values :
BoS
CHoCH
🟣 m_State
Type : string
Description : Specifies the type of the latest Minor Structure event.
Possible values :
BoS
CHoCH
🟣 MBoS_Counter
Type : integer
Description : Counts the number of consecutive structural breaks (BoS) in the Major structure.
Useful for evaluating trend strength :
Increasing count: indicates trend continuation.
Reset to zero: typically occurs after a CHoCH.
🟣 mBoS_Counter
Type : integer
Description : Counts the number of consecutive structural breaks in the Minor structure.
Helps analyze the micro structure of the market on lower timeframes.
Higher value : strong internal trend.
Reset : indicates a minor pullback or reversal.
🟣 Candle_Type
Type : string
Description : Represents the type of the current candle.
Possible values :
Bullish
Bearish
Doji
import TFlab/Market_Structure_Report_Library_TradingFinder/1 as MSS
PP = input.int (5 , 'Market Structure Pivot Period' , group = 'Symbol 1' )
= MSS.MS(PP)
