Volume CandleThis Volume Candle Strategy indicator highlights the areas where the volume is acting against the prevailing trend.
It is a reliable indicator for identifying locations where big market players are likely to be liquidated or forced to change their positioning due to an ongoing trend.
Volum

ProEdge Strategy's — Structure ReclaimWhat it does
ProEdge Indicator — Fib Reclaim Pro (Signals Only) finds “reclaim” setups of the active Time-Based Fib (TBF) leg and confirms them with weekly gates, optional POC alignment, and light OB proximity. When conditions line up, it prints a one-shot BUY/SELL triangle and can fire alerts—no auto-trading, no repainting tricks.
Best use / timeframes
HTF bias & swing trades: run your chart on 1D or 12H (default TBF = 12H). Great for swing positioning and “let it trend” moves.
Intraday: 4H / 1H for cleaner entries while keeping the 12H/1D bias.
Scalping: 15m / 5m with the higher-timeframe bias. Consider increasing Pivot Strength and Min Confluence Score, enable Require POC, and reduce Max bars to fill.
Alerts & Other Settings
Add alert → ProEdge BUY or ProEdge SELL → Once per bar close. Works with webhooks/Discord/Telegram.
Key settings (tune to your market)
TBF Timeframe (anchor leg, e.g., 12H/1D) & Pivot Strength.
Weekly gates: W 0.25 reclaim (longs) / W 0.75 loss (shorts), plus optional 0.50 bias.
Min Confluence Score, Require POC, OB band (ATR), Retest style (wick vs close), Cooldown, Max bars to fill.
All options live in settings - flip chart timeframes freely and adjust inputs to suit each symbol’s personality (crypto, FX, indices, stocks).
Trading notes
Use HTF for direction, LTF for execution. Let alerts bring you to the chart; still apply risk, invalidations, and position sizing. Educational tool - not financial advice.

Smart Money Concepts [Riz]Smart Money Concepts is a comprehensive technical analysis tool for identifying institutional trading patterns and market structure. This indicator combines Smart Money Concepts (SMC), ICT methodology, and Wyckoff principles into one professional tool.
✨ KEY FEATURES
📊 VOLUMETRIC ORDER BLOCKS
• Visual representation of supply/demand zones with volume distribution
• Horizontal volume bars showing buy/sell composition inside each Order Block
• Automatic mitigation tracking
• Breaker Block detection (invalidated OBs acting as reversal zones)
• Strength rating system: ★ Weak, ★★ Medium, ★★★ Strong
• ATR-based size filtering to show only significant zones
📈 MARKET STRUCTURE DETECTION
• Break of Structure (BOS) and Change of Character (CHoCH) identification
• Higher Highs (HH), Higher Lows (HL), Lower Highs (LH), Lower Lows (LL) labels
• Internal structure pivots (iH/iL) for intraday analysis
• Auto-adjusting swing length based on timeframe
• Configurable confirmation methods (Close vs Wick-based)
💎 FAIR VALUE GAPS (FVG)
• Automatic detection of bullish and bearish imbalances
• Configurable mitigation percentage (default 50%)
• Visual tracking until gaps are filled
• Separate color schemes for clarity
💧 LIQUIDITY ANALYSIS
• Buy Side Liquidity (BSL) identification at swing highs
• Sell Side Liquidity (SSL) identification at swing lows
• Automatic sweep detection with visual confirmation
• Real-time alerts when liquidity is taken
⚖️ PREMIUM & DISCOUNT ZONES
• Dynamic range calculation based on configurable lookback period
• Equilibrium (EQ) level identification
• Previous Day High (PDH) and Previous Day Low (PDL) levels
• Helps identify favorable entry zones
📊 REAL-TIME DASHBOARD
• Live statistics on all detected patterns
• Active Order Blocks and FVGs count
• BOS/CHoCH occurrence tracking
• Liquidity sweep counters
• Recent market activity indicators
• Current trend bias display
• Fully customizable position and size
⚙️ CUSTOMIZATION OPTIONS
All aspects are fully customizable:
• Swing Length (1-50 bars) with auto-adjust for timeframe
• Max Active Order Blocks (10-100)
• Volume bar position (Left/Right) with mirror option
• Volume bar width percentage (10-50%)
• ATR size filter for Order Blocks
• Strength rating method (Touches/Age/Distance/Volume/Combined)
• All colors and transparency levels
• Dashboard position (9 locations available)
• Comprehensive alert system for all events
🎓 HOW IT WORKS
ORDER BLOCKS: Identified at the last candle before a Break of Structure. These represent institutional supply and demand zones. Volume is estimated based on candle characteristics and displayed as horizontal bars.
MARKET STRUCTURE: Tracks pivot highs and lows to determine if price is making Higher Highs/Higher Lows (bullish structure) or Lower Highs/Lower Lows (bearish structure). BOS indicates trend continuation, while CHoCH signals potential trend reversal.
LIQUIDITY: Swing highs represent Buy Side Liquidity where short positions have their stop losses. Swing lows represent Sell Side Liquidity where long positions have stop losses. The indicator tracks when these levels are "swept" by price.
FAIR VALUE GAPS: Three-candle patterns where the current candle's range doesn't overlap with the candle two bars ago, creating price imbalances that often get filled later.
📚 BEST PRACTICES
• Use on all timeframes - Auto-adjust feature optimizes settings automatically
• Look for confluence - Best setups occur when multiple concepts align (e.g., Order Block + liquidity sweep + discount zone)
• Consider risk/reward - Use Premium/Discount zones to identify favorable entry areas
• Respect market context - Order Blocks in the direction of overall trend tend to be more reliable
• Volume matters - Higher volume percentages in the expected direction may indicate stronger zones
⚠️ IMPORTANT NOTES
EDUCATIONAL TOOL: This indicator is designed for analysis and education, not as trading signals or investment advice.
VOLUME ESTIMATION: Buy/sell volume distribution is estimated based on candle characteristics since true buy/sell volume data is not available in Pine Script.
NO GUARANTEES: Past performance is not indicative of future results. All trading involves substantial risk.
RISK MANAGEMENT: Always use proper risk management and seek additional confirmation before making trading decisions.
OBJECT LIMITS: On very fast timeframes (1m, 5m) in highly volatile markets, the indicator may approach Pine Script's 500-object limit. Reduce max OBs/FVGs in settings if needed.
🔧 TECHNICAL SPECIFICATIONS
• Pine Script Version: v6
• Indicator Type: Overlay (displays on price chart)
• Maximum Objects: Optimized to stay within Pine Script limits
• Performance: Efficient rendering with configurable history management
• Updates: Real-time on every bar close
📖 METHODOLOGY
This indicator combines concepts from:
• Inner Circle Trader (ICT) methodology
• Smart Money Concepts (SMC) framework
• Wyckoff market analysis principles
• Order flow and volume spread analysis
⚖️ DISCLAIMER
This indicator is for educational and informational purposes only. It is not financial advice. Trading financial instruments carries substantial risk and may not be suitable for all investors. Past performance is not indicative of future results. Always conduct your own research and consult with a licensed financial advisor before making any investment decisions. The author assumes no responsibility for any losses incurred from using this indicator.

Day Trading Astra by Pooja📌 Day Trading Astra by Pooja
Day Trading Astra by Pooja is specily designed for F&O Traders, a clean and fast momentum-shift indicator designed to support day traders with clear entry signals and structured filtering.
It uses a refined RSI–MA crossover engine, allowing traders to visualize momentum transitions directly on the price chart with minimal clutter.
✨ Key Features
🔶 1. RSI–MA Crossover Engine
Identifies potential momentum shifts using a fast RSI and smoothed RSI-MA baseline.
🔶 2. Clean BUY/SELL Chart Signals
Markers appear directly on the candle chart—easy to read, no extra panes.
🔶 3. Smart Filtering System (Optional)
To help reduce low-quality signals in uncertain conditions:
ADX trend-strength filter
ATR volatility check
Slope validation
Minimum bars between two signals
🔶 4. Alert + Webhook Ready
Supports TradingView alerts and webhook integration for automation tools.
Each alert includes symbol, direction, price, timestamp, unique ID, and an optional secret key for secure execution.
🔶 5. Multi-Timeframe Flexible
Works across all timeframes; users can apply it according to their day-trading style.
📝 How to Use
Add indicator to chart.
Select your preferred filters or use default settings.
Enable alerts if automated notifications are needed.
Combine with your own risk management and trading framework.
This tool is meant to support analysis, not replace personal judgment.
⚠️ Disclaimer
This script is a technical analysis tool and not financial advice.
Results vary depending on market conditions and user settings.
No indicator can guarantee profits or eliminate risk.
Always test settings before applying them in live markets.
The user is fully responsible for all trading decisions.
⭐ Summary
A clean, fast, and structured momentum-entry tool designed to help day traders identify potential intraday shifts with clarity and alert support.

Huli (Reversal) PatternsThis indicator identifies and highlights specific candlestick patterns that commonly appear at potential reversal points in price action. The indicator scans for five distinct pattern types and visually marks them on your chart with customizable colors and optional signal shapes.
Pattern Detection:
Doji - Identifies candles with minimal body size relative to their range
Outside Bars - Detects engulfing patterns where the current bar completely contains the previous bar's range
Pin Bars - Recognizes candles with long wicks and small bodies at potential swing points
212 Pattern - Marks three-bar reversal formations with specific high/low relationships
222 Pattern - Identifies more complex three-bar reversal structures
Key Features:
Individual Pattern Controls - Enable/disable each pattern type independently
Volume Filtering - Optional volume increase requirement for each pattern (can be toggled on/off per pattern type)
Lookback Period - Adjustable lookback bars for each pattern to confirm swing highs/lows (default: 30 bars)
Visual Customization - Choose how patterns are highlighted:
Body only coloring
Body + wick coloring
Body + border coloring
Full candle coloring (body, wick, and border)
Signal Shapes - Optional arrows, triangles, diamonds, or dots to mark pattern occurrences
Custom Candle Colors - Apply custom colors to non-pattern candles for better visual organization
Pattern Priority System - When multiple patterns occur simultaneously, the indicator displays only the highest priority pattern (222 > 212 > Pin > Outside > Doji)
Configuration:
Each pattern type includes its own settings group where you can adjust colors, enable/disable volume requirements, and set lookback periods. The indicator allows for precise tuning to match your analysis preferences without cluttering the chart.
All patterns are evaluated using price structure and optionally volume, providing visual cues where multiple technical factors align. The indicator serves as a pattern recognition tool to assist in identifying areas of interest for further analysis.

Defended Price Levels (DPLs) — Melvin Dickover ConceptThis indicator identifies and draws horizontal “Defended Price Levels” (DPLs) exactly as originally described by Melvin E. Dickover in his trading methodology.
Dickover observed that when extreme relative volume and extreme “freedom of movement” (volume-to-price-movement ratio) occur on the same bar, especially on bars with large gaps or unusually large bodies, the closing price (or previous close) of that bar very often becomes a significant future support/resistance level that the market later “defends.”
This script automates the detection of those exact coincident spikes using two well-known public indicators:
Relative Volume (RVI)
• Original idea: Melvin Dickover
• Pine Script implementation used here: “Relative Volume Indicator (Freedom Of Movement)” by LazyBear
Link:
Freedom of Movement (FoM)
• Original idea and calculation: starbolt64
• Pine Script: “Freedom of Movement” by starbolt64
Link:
How this indicator works
Calculates the raw (possibly negative) LazyBear RVI and starbolt64’s exact FoM values
Normalizes and standardizes both over the user-defined lookback
Triggers only when both RVI and FoM exceed the chosen number of standard deviations on the same bar (true Dickover coincident-spike condition)
Applies Dickover’s original price-selection rules (uses current close on big gaps or 2× body expansion candles, otherwise previous close)
Draws a thin maroon horizontal ray only when the new level is sufficiently far from all previously drawn levels (default ≥0.8 %) and the maximum number of levels has not been reached
Keeps the chart clean by limiting the total number of significant defended levels shown
This is not a republish or minor variation of the two source scripts — it is a faithful automation of Melvin Dickover’s specific “defended price line” concept that he manually marked using the coincidence of these two indicators.
Full credit goes to:
Melvin E. Dickover — creator of the Defended Price Levels concept
LazyBear — author of the Relative Volume (RVI) implementation used here
starbolt64 — author of the Freedom of Movement indicator and calculation
Settings (all adjustable):
Standard Deviation Length (default 60)
Spike Threshold in standard deviations (default 2.0)
Minimum distance between levels in % (default 0.8 %)
Maximum significant levels to display (15–80)
Use these horizontal maroon lines as potential future support/resistance zones that the market has previously shown strong willingness to defend.
Thank you to Melvin, LazyBear, and starbolt64 for the original work that made this automation possible.

Open Interest Anomaly DetectorOpen Interest Anomaly Indicator
This indicator is designed to detect anomalies in Open Interest (OI) and highlight moments when capital is aggressively entering or exiting the market.
The indicator plots raw Open Interest values as a column histogram. A moving average is applied to establish the baseline behavior of OI, while standard deviation bands define thresholds for abnormal deviations. These deviation levels can be customized in the settings.
When Open Interest rises above the upper deviation band, the indicator marks these events in green, signaling positive anomalies, often associated with sudden inflows of capital.
When Open Interest falls below the lower deviation band, it highlights these points in red, indicating negative anomalies, which may reflect capital leaving the market due to stop-loss triggers, take-profit executions, or liquidations.
It is important to note that Open Interest alone does not generate entry signals. Instead, it serves as a contextual layer, helping traders understand market dynamics and confirm other tools. For cleaner signals with reduced noise, we recommend using the indicator on the 15-minute timeframe.
Using Open Interest Together With Delta
The indicator becomes even more powerful when combined with Delta, providing clear insight into who is entering or exiting the market:
Delta > 0 and Open Interest rising → Long positions are entering the market.
Delta < 0 and Open Interest rising → Short positions are entering the market.
Open Interest falling (regardless of Delta) → Money is leaving the market; long or short positions are being closed, either by profit-taking or by forced exits.
This synergy between Open Interest and Delta offers a deeper understanding of market flow and can produce highly informative signals when used together.

Daily & Average Dollar VolumeCalculates the daily and average (20D) $ volume.
Fully customizable appearence and can be placed in any corner.

Smart Money Concepts [Dau_tu_hieu_goc]Credits to LuxAlgo for the SMC Parts.
Edited by Dau_Tu_Hieu_Goc

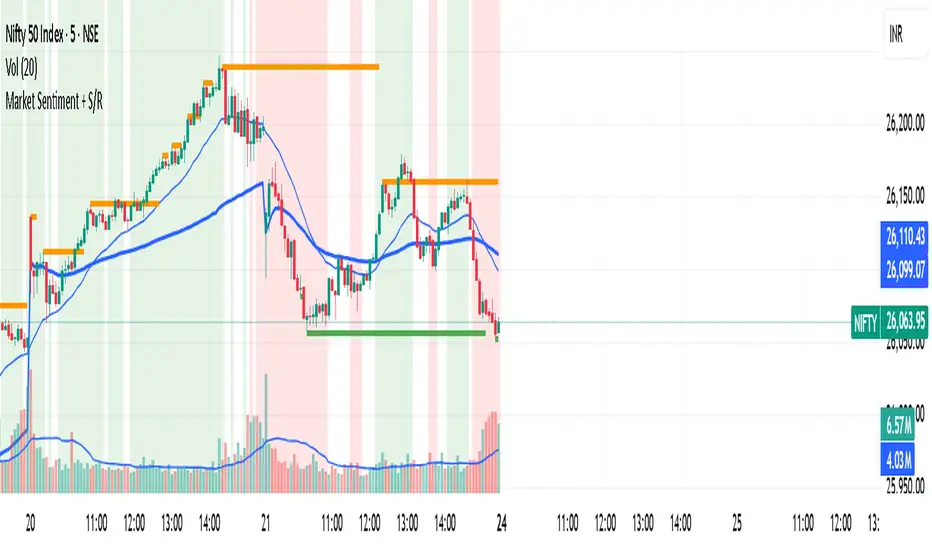
Market Sentiment + S/R KPRThis script is having VWAP and moving average cross overs. and also support and resistence.
20/50/200 EMA with RVOL Filter Hariss 369Understanding to trade with this indicator is very simple. 20 EMA acts as dynamic support and resistance. 50 EMA is best for intraday/short term trend filter and 200 EMA is best for long term trend filter. One should always trade with the trend. Combination of all threes entails safe trading with trend. Undoubtedly, volume plays vital role to move the price up or down. The volume indicator used here is Relative Volume (RVOL) rather simple volume. 1.5 RVOL is considered as strong trend to trade considering other factors intact. You can tick/untick RVOL and you can also change the level of RVOL from input section.
You can also change the color of EMAs and pattern of buy and sell signal. Place this indicator over the chart. You can choose any type of asset and any time frame.
Though buy and sell signals are there. The concept of trading is buy when price closes above 20 ema and 20 ema >50ema>200 ema. Place stop loss below the low of last candle or just below 20 ema. Target 1.5/2 times of stop loss. You can also trail it with 20 ema or 50 ema depending upon your trading style and risk appetite. You can also take positional trade, in that case 200 ema to be considered as stop loss. Sell when price closes below 20 ema, 20 ema<50ema<200 ema. For intraday trading, 20 ema is best to enter and exit. Taking RVOL into consideration is best way in order to trade with high liquidity-safer way to entry and exit.

Multi Timeframe Bollinger Bands Spectrum [Ata]Multi-Timeframe Bollinger Bands Spectrum
Technical Overview
This script integrates multi-timeframe volatility analysis with volume-derived order flow estimation. By combining Bollinger Bands (statistical deviation) with internal candle volume logic, the indicator qualifies price movements to differentiate between sustained trends, reversals, and exhaustion events.
The system is designed to provide a structural context for price action, visualizing market regimes through a dual-zone spectrum and filtering signals based on the interaction between price location and specific volume thresholds.
Core Logic & Calculation
1. Volume Decomposition Algorithm
Instead of using total volume, the script estimates Buying Pressure vs. Selling Pressure based on the close position relative to the candle's High/Low range:
- Buying Volume (vb): Increases as the close approaches the High.
- Selling Volume (vs): Increases as the close approaches the Low.
This logic allows the detection of directional flow even within standard volume bars.
2. Statistical Spectrum
The indicator renders deviations from the Basis (SMA) as two distinct zones:
- Bullish Zone (Blue): Price positioning between the Basis and Upper Band.
- Bearish Zone (Red): Price positioning between the Basis and Lower Band.
This structure is applied across multiple timeframes (overlay) to visualize the macro trend context without noise.
3. Non-Repainting Execution
To ensure historical accuracy and reliability for backtesting, all higher-timeframe data is requested using "lookahead_off". Signals are confirmed only upon the closure of the respective timeframe's candle.
Signal Definitions
Signals are generated only when specific Volatility and Volume conditions intersect:
Reversal Setups (Reaction to Liquidity)
- WALL: Triggered when price rejects the Upper Band accompanied by Extreme Selling Volume (vs > Limit). This suggests active limit sell orders absorbing the rally.
- FLOOR: Triggered when price rejects the Lower Band accompanied by Extreme Buying Volume (vb > Limit). This suggests active limit buy orders absorbing the drop.
- ABSORP: Identifies absorption near the lower bands where selling pressure is met with passive buying (indicated by lower wicks and relative buy volume).
Momentum Setups (Trend Continuation)
- POWER: Validates a breakout above the Upper Band only if supported by Dominant Buying Volume and a strong candle body.
- PANIC: Validates a breakdown below the Lower Band only if supported by Dominant Selling Volume.
- TRAP: Marks failed breakouts where price exits the bands but volume analysis contradicts the move (e.g., low directional volume).
Exhaustion Setups (Statistical Extremes)
- CLIMAX/CRASH: Identifies anomalies where price deviates significantly from the mean (Extreme Deviation) or when volume reaches unsustainable levels relative to the average, often preceding a mean reversion.
Input Parameters
- Bollinger Logic: Configuration for Length and Standard Deviation Multiplier.
- Volume Thresholds: Adjustable factors for Minimum Volume (Trend) and Extreme Volume (Reversal/Climax).
- Timeframe Layers: Toggle visibility for up to 5 higher timeframes.
- Theme: Adjusts label contrast for Dark/Light backgrounds.
Disclaimer
This indicator is strictly for analytical purposes. It provides a visualization of past market data based on statistical and volumetric formulas. Users should apply their own risk management protocols.

Flux-Tensor Singularity [FTS]Flux-Tensor Singularity - Multi-Factor Market Pressure Indicator
The Flux-Tensor Singularity (FTS) is an advanced multi-factor oscillator that combines volume analysis, momentum tracking, and volatility-weighted normalization to identify critical market inflection points. Unlike traditional single-factor indicators, FTS synthesizes price velocity, volume mass, and volatility context into a unified framework that adapts to changing market regimes.
This indicator identifies extreme market conditions (termed "singularities") where multiple confirming factors converge, then uses a sophisticated scoring system to determine directional bias. It is designed for traders seeking high-probability setups with built-in confluence requirements.
THEORETICAL FOUNDATION
The indicator is built on the premise that market time is not constant - different market conditions contain varying levels of information density. A 1-minute bar during a major news event contains far more actionable information than a 1-minute bar during overnight low-volume trading. Traditional indicators treat all bars equally; FTS does not.
The theoretical framework draws conceptual parallels to physics (purely as a mental model, not literal physics):
Volume as Mass: Large volume represents significant market participation and "weight" behind price moves. Just as massive objects have stronger gravitational effects, high-volume moves carry more significance.
Price Change as Velocity: The rate of price movement through price space represents momentum and directional force.
Volatility as Time Dilation: When volatility is high relative to its historical norm, the "information density" of each bar increases. The indicator weights these periods more heavily, similar to how time dilates near massive objects in physics.
This is a pedagogical metaphor to create a coherent mental model - the underlying mathematics are standard financial calculations combined in a novel way.
MATHEMATICAL FRAMEWORK
The indicator calculates a composite singularity value through four distinct steps:
Step 1: Raw Singularity Calculation
S_raw = (ΔP × V) × γ²
Where:
ΔP = Price Velocity = close - close
V = Volume Mass = log(volume + 1)
γ² = Time Dilation Factor = (ATR_local / ATR_global)²
Volume Transformation: Volume is log-transformed because raw volume can have extreme outliers (10x-100x normal). The logarithm compresses these spikes while preserving their significance. This is standard practice in volume analysis.
Volatility Weighting: The ratio of short-term ATR (5 periods) to long-term ATR (user-defined lookback) is squared to create a volatility amplification factor. When local volatility exceeds global volatility, this ratio increases, amplifying the raw singularity value. This makes the indicator regime-aware.
Step 2: Normalization
The raw singularity values are normalized to a 0-100 scale using a stochastic-style calculation:
S_normalized = ((S_raw - S_min) / (S_max - S_min)) × 100
Where S_min and S_max are the lowest and highest raw singularity values over the lookback period.
Step 3: Epsilon Compression
S_compressed = 50 + ((S_normalized - 50) / ε)
This is the critical innovation that makes the sensitivity control functional. By applying compression AFTER normalization, the epsilon parameter actually affects the final output:
ε < 1.0: Expands range (more signals)
ε = 1.0: No change (default)
ε > 1.0: Compresses toward 50 (fewer, higher-quality signals)
For example, with ε = 2.0, a normalized value of 90 becomes 70, making threshold breaches rarer and more significant.
Step 4: Smoothing
S_final = EMA(S_compressed, smoothing_period)
An exponential moving average removes high-frequency noise while preserving trend.
SIGNAL GENERATION LOGIC
When the tensor crosses above the upper threshold (default 90) or below the lower threshold (default 10), an extreme event is detected. However, the indicator does NOT immediately generate a buy or sell signal. Instead, it analyzes market context through a multi-factor scoring system:
Scoring Components:
Price Structure (+1 point): Current bar bullish/bearish
Momentum (+1 point): Price higher/lower than N bars ago
Trend Context (+2 points): Fast EMA above/below slow EMA (weighted heavier)
Acceleration (+1 point): Rate of change increasing/decreasing
Volume Multiplier (×1.5): If volume > average, multiply score
The highest score (bullish vs bearish) determines signal direction. This prevents the common indicator failure mode of "overbought can stay overbought" by requiring directional confirmation.
Signal Conditions:
A BUY signal requires:
Extreme event detection (tensor crosses threshold)
Bullish score > Bearish score
Price confirmation: Bullish candle (optional, user-controlled)
Volume confirmation: Volume > average (optional, user-controlled)
Momentum confirmation: Positive momentum (optional, user-controlled)
A SELL signal requires the inverse conditions.
INPUTS EXPLAINED - Core Parameters:
Global Horizon (Context): Default 20. Lookback period for normalization and volatility comparison. Higher values = smoother but less responsive. Lower values = more signals but potentially more noise.
Tensor Smoothing: Default 3. EMA period applied to final output. Removes "quantum foam" (high-frequency noise). Range 1-20.
Singularity Threshold: Default 90. Values above this (or below 100-threshold) trigger extreme event detection. Higher = rarer, stronger signals.
Signal Sensitivity (Epsilon): Default 1.0. Post-normalization compression factor. This is the key innovation - it actually works because it's applied AFTER normalization. Range 0.1-5.0.
Signal Interpreter Toggles:
Require Price Confirmation: Default ON. Only generates buy signals on bullish candles, sell signals on bearish candles. Reduces false signals but may delay entry.
Require Volume Confirmation: Default ON. Only signals when volume > average. Critical for stocks/crypto, less important for forex (unreliable volume data).
Use Momentum Filter: Default ON. Requires momentum agreement with signal direction. Prevents counter-trend signals.
Momentum Lookback: Default 5. Number of bars for momentum calculation. Shorter = more responsive, longer = trend-following bias.
Visual Controls:
Colors: Customizable colors for bullish flux, bearish flux, background, and event horizon.
Visual Transparency: Default 85. Master control for all visual elements (accretion disk, field lines, particles, etc.). Range 50-99. Signals and dashboard have separate controls.
Visibility Toggles: Individual on/off switches for:
Gravitational field lines (trend EMAs)
Field reversals (trend crossovers)
Accretion disk (background gradient)
Singularity diamonds (neutral extreme events)
Energy particles (volume bursts)
Event horizon flash (extreme event background)
Signal background flash
Signal Size: Tiny/Small/Normal triangle size
Signal Offsets: Separate controls for buy and sell signal vertical positioning (percentage of price)
Dashboard Settings:
Show Dashboard: Toggle on/off
Position: 9 placement options (all corners, centers, middles)
Text Size: Tiny/Small/Normal/Large
Background Transparency: 0-50, separate from visual transparency
VISUAL ELEMENTS EXPLAINED
1. Accretion Disk (Background Gradient):
A three-layer gradient background that intensifies as the tensor approaches extremes. The outer disk appears at any non-neutral reading, the inner disk activates above 70 or below 30, and the core layer appears above 85 or below 15. Color indicates direction (cyan = bullish, red = bearish). This provides instant visual feedback on market pressure intensity.
2. Gravitational Field Lines (EMAs):
Two trend-following EMAs (10 and 30 period) visualized as colored lines. These represent the "curvature" of market trend - when they diverge, trend is strong; when they converge, trend is weakening. Crossovers mark potential trend reversals.
3. Field Reversals (Circles):
Small circles appear when the fast EMA crosses the slow EMA, indicating a potential trend change. These are distinct from extreme events and appear at normal market structure shifts.
4. Singularity Diamonds:
Small diamond shapes appear when the tensor reaches extreme levels (>90 or <10) but doesn't meet the full signal criteria. These are "watch" events - extreme pressure exists but directional confirmation is lacking.
5. Energy Particles (Dots):
Tiny dots appear when volume exceeds 2× average, indicating significant participation. Color matches bar direction. These highlight genuine high-conviction moves versus low-volume drifts.
6. Event Horizon Flash:
A golden background flash appears the instant any extreme threshold is breached, before directional analysis. This alerts you to pay attention.
7. Signal Background Flash:
When a full buy/sell signal is confirmed, the background flashes cyan (buy) or red (sell). This is your primary alert that all conditions are met.
8. Signal Triangles:
The actual buy (▲) and sell (▼) markers. These only appear when ALL selected confirmation criteria are satisfied. Position is offset from bars to avoid overlap with other indicators.
DASHBOARD METRICS EXPLAINED
The dashboard displays real-time calculated values:
Event Density: Current tensor value (0-100). Above 90 or below 10 = critical. Icon changes: 🔥 (extreme high), ❄️ (extreme low), ○ (neutral).
Time Dilation (γ): Current volatility ratio squared. Values >2.0 indicate extreme volatility environments. >1.5 = elevated, >1.0 = above average. Icon: ⚡ (extreme), ⚠ (elevated), ○ (normal).
Mass (Vol): Log-transformed volume value. Compared to volume ratio (current/average). Icon: ● (>2× avg), ◐ (>1× avg), ○ (below avg).
Velocity (ΔP): Raw price change. Direction arrow indicates momentum direction. Shows the actual price delta value.
Bullish Flux: Current bullish context score. Displayed as both a bar chart (visual) and numeric value. Brighter when bullish score dominates.
Bearish Flux: Current bearish context score. Same visualization as bullish flux. These scores compete - the winner determines signal direction.
Field: Trend direction based on EMA relationship. "Repulsive" (uptrend), "Attractive" (downtrend), "Neutral" (ranging). Icon: ⬆⬇↔
State: Current market condition:
🚀 EJECTION: Buy signal active
💥 COLLAPSE: Sell signal active
⚠ CRITICAL: Extreme event, no directional confirmation
● STABLE: Normal market conditions
HOW TO USE THE INDICATOR
1. Wait for Extreme Events:
The indicator is designed to be selective. Don't trade every fluctuation - wait for tensor to reach >90 or <10. This alone is not a signal.
2. Check Context Scores:
Look at the Bullish Flux vs Bearish Flux in the dashboard. If scores are close (within 1-2 points), the market is indecisive - skip the trade.
3. Confirm with Signals:
Only act when a full triangle signal appears (▲ or ▼). This means ALL your selected confirmation criteria have been met.
4. Use with Price Structure:
Combine with support/resistance levels. A buy signal AT support is higher probability than a buy signal in the middle of nowhere.
5. Respect the Dashboard State:
When State shows "CRITICAL" (⚠), it means extreme pressure exists but direction is unclear. These are the most dangerous moments - wait for resolution.
6. Volume Matters:
Energy particles (dots) and the Mass metric tell you if institutions are participating. Signals without volume confirmation are lower probability.
MARKET AND TIMEFRAME RECOMMENDATIONS
Scalping (1m-5m):
Lookback: 10-14
Smoothing: 5-7
Threshold: 85
Epsilon: 0.5-0.7
Note: Expect more noise. Confirm with Level 2 data. Best on highly liquid instruments.
Intraday (15m-1h):
Lookback: 20-30 (default settings work well)
Smoothing: 3-5
Threshold: 90
Epsilon: 1.0
Note: Sweet spot for the indicator. High win rate on liquid stocks, forex majors, and crypto.
Swing Trading (4h-1D):
Lookback: 30-50
Smoothing: 3
Threshold: 90-95
Epsilon: 1.5-2.0
Note: Signals are rare but high conviction. Combine with higher timeframe trend analysis.
Position Trading (1D-1W):
Lookback: 50-100
Smoothing: 5-7
Threshold: 95
Epsilon: 2.0-3.0
Note: Extremely rare signals. Only trade the most extreme events. Expect massive moves.
Market-Specific Settings:
Forex (EUR/USD, GBP/USD, etc.):
Volume data is unreliable (spot forex has no centralized volume)
Disable "Require Volume Confirmation"
Focus on momentum and trend filters
News events create extreme singularities
Best on 15m-1h timeframes
Stocks (High-Volume Equities):
Volume confirmation is CRITICAL - keep it ON
Works excellently on AAPL, TSLA, SPY, etc.
Morning session (9:30-11:00 ET) shows highest event density
Earnings announcements create guaranteed extreme events
Best on 5m-1h for day trading, 1D for swing trading
Crypto (BTC, ETH, major alts):
Reduce threshold to 85 (crypto has constant high volatility)
Volume spikes are THE primary signal - keep volume confirmation ON
Works exceptionally well due to 24/7 trading and high volatility
Epsilon can be reduced to 0.7-0.8 for more signals
Best on 15m-4h timeframes
Commodities (Gold, Oil, etc.):
Gold responds to macro events (Fed announcements, geopolitical events)
Oil responds to supply shocks
Use daily timeframe minimum
Increase lookback to 50+
These are slow-moving markets - be patient
Indices (SPX, NDX, etc.):
Institutional volume matters - keep volume confirmation ON
Opening hour (9:30-10:30 ET) = highest singularity probability
Strong correlation with VIX - high VIX = more extreme events
Best on 15m-1h for day trading
WHAT MAKES THIS INDICATOR UNIQUE
1. Post-Normalization Sensitivity Control:
Unlike most oscillators where sensitivity controls don't actually work (they're applied before normalization, which then rescales everything), FTS applies epsilon compression AFTER normalization. This means the sensitivity parameter genuinely affects signal frequency. This is a novel implementation not found in standard oscillators.
2. Multi-Factor Confluence Requirement:
The indicator doesn't just detect "overbought" or "oversold" - it detects extreme conditions AND THEN analyzes context through five separate factors (price structure, momentum, trend, acceleration, volume). Most indicators are single-factor; FTS requires confluence.
3. Volatility-Weighted Normalization:
By squaring the ATR ratio (local/global), the indicator adapts to changing market regimes. A 1% move in a low-volatility environment is treated differently than a 1% move in a high-volatility environment. Traditional indicators treat all moves equally regardless of context.
4. Volume Integration at the Core:
Volume isn't an afterthought or optional filter - it's baked into the fundamental equation as "mass." The log transformation handles outliers elegantly while preserving significance. Most price-based indicators completely ignore volume.
5. Adaptive Scoring System:
Rather than fixed buy/sell rules ("RSI >70 = sell"), FTS uses competitive scoring where bullish and bearish evidence compete. The winner determines direction. This solves the classic problem of "overbought markets can stay overbought during strong uptrends."
6. Comprehensive Visual Feedback:
The multi-layer visualization system (accretion disk, field lines, particles, flashes) provides instant intuitive feedback on market state without requiring dashboard reading. You can see pressure building before extreme thresholds are hit.
7. Separate Extreme Detection and Signal Generation:
"Singularity diamonds" show extreme events that don't meet full criteria, while "signal triangles" only appear when ALL conditions are met. This distinction helps traders understand when pressure exists versus when it's actionable.
COMPARISON TO EXISTING INDICATORS
vs. RSI/Stochastic:
These normalize price relative to recent range. FTS normalizes (price change × log volume × volatility ratio) - a composite metric, not just price position.
vs. Chaikin Money Flow:
CMF combines price and volume but lacks volatility context and doesn't use adaptive normalization or post-normalization compression.
vs. Bollinger Bands + Volume:
Bollinger Bands show volatility but don't integrate volume or create a unified oscillator. They're separate components, not synthesized.
vs. MACD:
MACD is pure momentum. FTS combines momentum with volume weighting and volatility context, plus provides a normalized 0-100 scale.
The specific combination of log-volume weighting, squared volatility amplification, post-normalization epsilon compression, and multi-factor directional scoring is unique to this indicator.
LIMITATIONS AND PROPER DISCLOSURE
Not a Holy Grail:
No indicator is perfect. This tool identifies high-probability setups but cannot predict the future. Losses will occur. Use proper risk management.
Requires Confirmation:
Best used in conjunction with price action analysis, support/resistance levels, and higher timeframe trend. Don't trade signals blindly.
Volume Data Dependency:
On forex (spot) and some low-volume instruments, volume data is unreliable or tick-volume only. Disable volume confirmation in these cases.
Lagging Components:
The EMA smoothing and trend filters are inherently lagging. In extremely fast moves, signals may appear after the initial thrust.
Extreme Event Rarity:
With conservative settings (high threshold, high epsilon), signals can be rare. This is by design - quality over quantity. If you need more frequent signals, reduce threshold to 85 and epsilon to 0.7.
Not Financial Advice:
This indicator is an analytical tool. All trading decisions and their consequences are solely your responsibility. Past performance does not guarantee future results.
BEST PRACTICES
Don't trade every singularity - wait for context confirmation
Higher timeframes = higher reliability
Combine with support/resistance for entry refinement
Volume confirmation is CRITICAL for stocks/crypto (toggle off only for forex)
During major news events, singularities are inevitable but direction may be uncertain - use wider stops
When bullish and bearish flux scores are close, skip the trade
Test settings on your specific instrument/timeframe before live trading
Use the dashboard actively - it contains critical diagnostic information
Taking you to school. — Dskyz, Trade with insight. Trade with anticipation.

Turnover (Volume * HLC/3)Let's get the elephant out of the room. Everyone knows volume is the key to validate price movement, but you can't compare two volume candles of the same stock when the price is 3 times different you need to account for that. So here it is, Turnover chart, to replace volume entirely, because why would you look at volume when you can look at turnover instead?

Hull VWMA Crossover StrategyA simple variation on the Hull Moving Average which reacts faster to high volume events, making it more responsive in those cases than even the standard Hull average -- CREDIT GOES TO Saolof - -- Edited into a strategy with some more options that im going to continue to refine. LMK if theres any features or confluence you want me to add -- cheers!

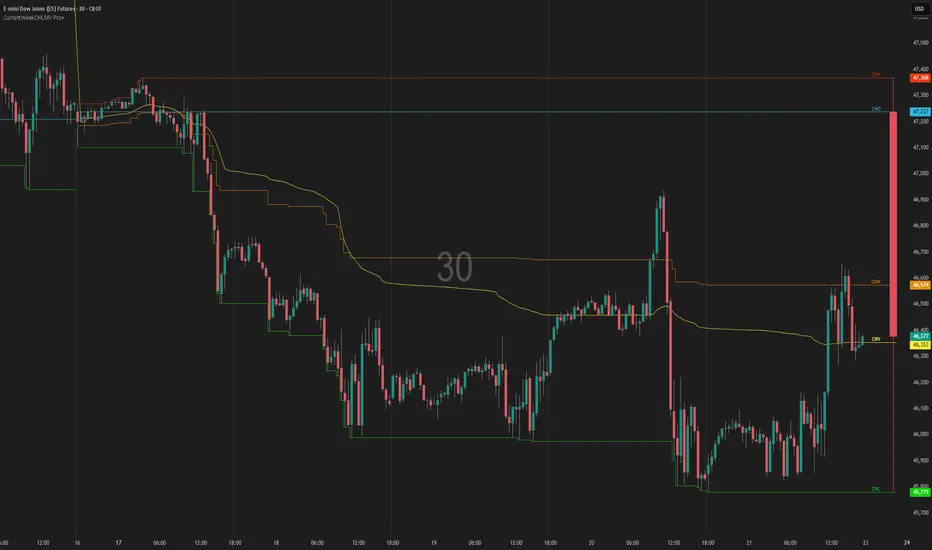
Current Year OHLMV Pro+Current Year OHLV + Anchored VWAP – Professional Edition
OVERVIEW
Real-time display of the current calendar year’s developing Open, High, Low, Close (live), and anchored VWAP with a full-size current-year candle in the right margin.
IMPLEMENTATION & VALUE ADDED
• Live anchored VWAP as a major yearly fair-value line
• Full current-year candle rendered in the right margin
• All levels as exportable plots
• Comprehensive alerts on every level and VWAP interaction
HOW TO USE
Apply to weekly or daily charts. The live VWAP and right-margin candle provide macro-level bias and yearly anchor points.
CREDIT & TRANSPARENCY
Core methodology: public domain (Current Year OHLC + Anchored VWAP).
Independent implementation with original live candle display and features.
DISCLAIMER
For educational and informational purposes only. Not financial advice. Test thoroughly.

Current Month OHLMV Pro+Current Month OHLV + Anchored VWAP – Professional Edition
OVERVIEW
Real-time display of the current calendar month’s developing Open, High, Low, Close (live), and anchored VWAP with a full-size current-month candle in the right margin.
IMPLEMENTATION & VALUE ADDED
• Live anchored VWAP as a powerful monthly fair-value reference
• Full current-month candle in the right margin
• All levels as exportable plots
• Comprehensive alerts on every level and VWAP touch/break
HOW TO USE
Apply to daily or lower timeframes. Use the live VWAP and right-margin candle for monthly trend bias and high-probability reversal zones.
CREDIT & TRANSPARENCY
Core methodology: public domain (Current Month OHLC + Anchored VWAP).
Independent implementation with original presentation and features.
DISCLAIMER
For educational and informational purposes only. Not financial advice. Test thoroughly.

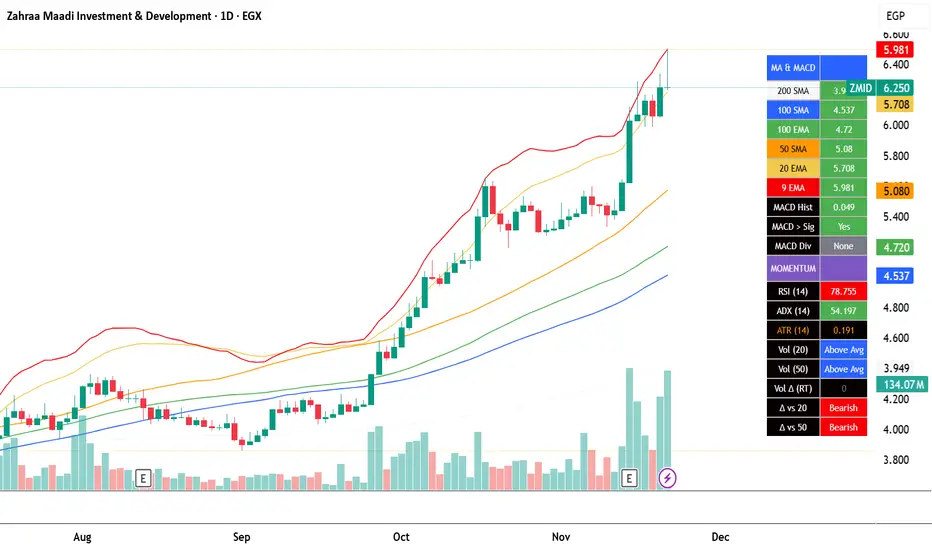
EGX Monitor Dashboard By Biscuits_Trading_Solutionsلوحة مراقبة البورصة المصرية من Biscuits_Trading_Solutions
نظرة عامة:
لوحة مراقبة البورصة المصرية هي أداة تحليل فني شاملة مصممة لتوفير نظرة فورية وواضحة على صحة السوق. تجمع الأداة مؤشرات رئيسية مختارة بعناية لتناسب السوق المصري لتوفر عليك عبء إضافة عدد كبير من المؤشرات في وقت واحد على الشاشة - بما في ذلك متوسطات متحركة، MACD، RSI، ADX، ATR، وتحليل متقدم لحجم التداول (دلتا) - في جدول واحد وسهل القراءة على الرسم البياني. مثالية للمتداولين الذين يحتاجون لتقييم الاتجاه، الزخم، وديناميكيات الحجم في لمحة دون تشويش الشاشة.
English Version is below ⬇️⬇️
المميزات الرئيسية:
* لوحة متابعة للمتوسطات المتحركة: تتابع وتلون وضع السعر بالنسبة لـ 6 متوسطات متحركة رئيسية (200 بسيط، 100 بسيط/آسي، 50 بسيط، 20 آسي، 9 آسي).
* تحليل متقدم لـ MACD: تعرض قيمة هِستوجرام MACD، حالة التقاطع بين MACD وخط الإشارة، وتكشف عن انحرافات صعودية محتملة (Bullish Divergence).
* مقاييس الزخم: تتضمن قراءات RSI و ADX، مع تلوينها للإشارة إلى مناطق الشراء المفرط والبيع المفرط وقوة الاتجاه.
تحليل متطور للحجم:
*دلتا الحجم/السيولة (الفارق بين حجم الشراء وحجم البيع).
* الحجم مقارنة بمتوسطه المتحرك لـ 20 و 50 فترة (لمقارنته بفترة متوسطة 20 شمعة وطويلة 50 شمعة)
* دلتا الحجم مقارنة بمتوسطها المتحرك لـ 20 و 50 فترة لقياس ضغط البيع والشراء.
عرض مرئي نظيف : جميع البيانات معروضة في جدول شبه شفاف يمكن وضعه في أي مكان على الرسم البياني. يتم أيضًا رسم المتوسطات المتحركة بخفة للاستدلال البصري.
مدخلات قابلة للتخصيص : جميع أطوال المؤشرات، المضاعفات، وموضع الجدول قابلة للتعديل كليًا من الإعدادات.
إزاحة الشمعة : تسمح لك بمشاهدة قراءات المؤشر من عدد محدد من الشمعات السابقة، مما يفيد في تحليل الظروف السابقة.
طريقة الاستخدام:
* تقييم الاتجاه: انظر إلى جدول المتوسطات المتحركة. وجود عدة خلايا خضراء (السعر فوق المتوسط) يشير إلى اتجاه صاعد قوي، بينما يشير اللون الأحمر إلى اتجاه هابط.
* تأكيد الزخم: تحقق من مؤشر RSI (شراء مفرط >70، بيع مفرط <30) و ADX (اتجاه قوي >25) لفهم سياق الزخم.
*تأكيد الحجم: استخدم أعمدة الحجم لتأكيد الحركات. حركة السعر المصحوبة بحجم "أعلى من المتوسط" ودلتا "صعودي" تكون أكثر أهمية.
إشارات الدخول/الخروج:
* انحراف MACD الصعودي يمكن أن يشير إلى انعكاس محتمل.
* وجود "نعم" لـ "MACD > Sig" يؤكد الزخم الصعودي.
* قيم ATR المرتفعة تشير إلى زيادة التقلب، وغالبًا ما ترافق الاتجاهات القوية أو اختراقات المستويات.
الإعدادات:
ما عليك سوى إضافة المؤشر إلى الرسم البياني الخاص بك. ستظهر اللوحة تلقائيًا. يمكنك ضبط جميع المعاملات (أطوال المتوسطات المتحركة، إعدادات الحجم، مكان الجدول) في تبويب "الإدخالات" في نافذة المؤشر لتناسب أسلوب تداولك.
إخلاء مسؤولية: جميع الإشارات التي تظهر ليست دعوة للبيع والشراء، هذا المحتوى تعليمي يساعدك على قراءة الشاشة بشكل أفضل، وقرارك الاستثماري يعود لك وحدك.
---
EGX Monitor Dashboard By Biscuits_Trading_Solutions
Overview :
The EGX Monitor Dashboard is a comprehensive technical analysis tool designed to provide a clear and immediate overview of the market's health. It consolidates key indicators, carefully selected for the Egyptian market, saving you the burden of adding a large number of indicators to your screen at once —including moving averages, MACD, RSI, ADX, ATR, and advanced volume delta analysis—into a single, easy-to-read table on your chart. Perfect for traders who need to assess trend, momentum, and volume dynamics at a glance without cluttering their screen.
Key Features :
* Moving Average Dashboard: Tracks and color-codes the price position relative to 6 key moving averages (200 SMA, 100 SMA/EMA, 50 SMA, 20 EMA, 9 EMA).
* Advanced MACD Analysis: Displays the MACD histogram value, the MACD vs. Signal line crossover state, and detects potential bullish divergences.
* Momentum Gauges: Includes RSI and ADX readings, color-coded for overbought/oversold and trend strength conditions.
Advanced Volume/Liquidity Analysis:
* Volume Delta (the difference between buying and selling volume).
* Volume compared to its 20 and 50-period moving averages (for medium-term 20-bar and long-term 50-bar comparisons).
* Volume Delta compared to its 20 and 50-period moving averages to measure buying/selling pressure.
Clean Visualization: All data is presented in a semi-transparent table that can be positioned anywhere on the chart. The moving averages are also plotted lightly for visual reference.
Customizable Inputs: All indicator lengths, multipliers, and the table position are fully adjustable in the settings.
Bar Offset: Allows you to view the indicator readings from a specific number of bars back, useful for analyzing past conditions.
How to Use:
* Trend Assessment: Look at the MA table. A cluster of green "Bullish" cells (price above MA) indicates a strong uptrend, while red indicates a downtrend.
* Momentum Confirmation: Check the RSI (overbought >70, oversold <30) and ADX (strong trend >25) for momentum context.
* Volume Confirmation: Use the volume columns to confirm moves. A price move with "Above Avg" volume and "Bullish" Delta is more significant.
Entry/Exit Clues:
* A "Bullish" MACD divergence can signal a potential reversal.
* A "Yes" for "MACD > Sig" confirms bullish momentum.
* High ATR values indicate increased volatility, often accompanying strong trends or breakouts.
Configuration:
Simply add the indicator to your chart. The dashboard will appear automatically. You can adjust all parameters (MA lengths, volume settings, table position) in the indicator's "Inputs" tab to suit your trading style.
Disclaimer: All signals that appear are not an invitation to buy or sell. This content is educational and is intended to help you read the screen better. Your investment decision is yours alone.
Current Week OHLM + VWAPCurrent Week OHLV + Anchored VWAP – Professional Edition
OVERVIEW
Real-time display of the current trading week’s developing Open, High, Low, Close (live), and anchored VWAP with a full-size current-week candle in the right margin.
IMPLEMENTATION & VALUE ADDED
• Live anchored VWAP updated throughout the week as a dynamic anchor
• Full current-week candle rendered in the right margin
• All levels as exportable plots
• Comprehensive alerts on every level and VWAP interaction
HOW TO USE
Apply to daily or intraday charts. The live VWAP serves as the week’s volume-weighted fair value; the right-margin candle gives instant bias and range context.
CREDIT & TRANSPARENCY
Core methodology: public domain (Current Week OHLC + Anchored VWAP).
Independent implementation with original live candle display, exportable plots, and alerting.
DISCLAIMER
For educational and informational purposes only. Not financial advice. Test thoroughly.
Simple OscillatorSimple Oscillator
A modern momentum indicator designed to visualize trend strength, momentum shifts, and potential reversal zones in a clean and intuitive way.
The Simple Oscillator enhances traditional momentum analysis with adaptive overbought/oversold zones, optional divergence detection, and clear color-coded momentum bars.
Key Features:
• Color-coded momentum bars (increasing vs. decreasing strength)
• Zero-line momentum shift detection
• Optional signal line
• Adaptive overbought/oversold zones
• Optional buy/sell markers
• Optional bullish & bearish divergence labels
• Compact dashboard for trend, risk, volume, and volatility
How to Use:
• Above zero → bullish momentum bias
• Below zero → bearish momentum bias
• Zero-line crosses may signal momentum shifts
• OB/OS zones highlight momentum extremes
• Divergences can signal potential reversals (confirmation recommended)
This indicator supports your analysis and should not be used as a standalone trading system. Always use proper risk management.

Current Day OHLMV Pro+Current Day OHLM + Anchored VWAP – Professional Edition
OVERVIEW
Real-time display of the current trading day’s developing Open, High, Low, Close (live), and anchored VWAP with a full-size current-day candle rendered in the right margin for instant intraday context.
CONCEPT BACKGROUND
Tracking the live day’s OHLM and anchored VWAP is a public-domain institutional practice used for intraday fair-value assessment and volume-weighted bias.
IMPLEMENTATION & VALUE ADDED
• Live anchored VWAP plotted and updated bar-by-bar as a dynamic key level
• Full current-day candle displayed in the right margin (perfectly aligned with price axis)
• All levels (Open, High, Low, Close, VWAP, Midpoint) as exportable plots for CSV download and custom analysis
• Comprehensive alerts on every level and VWAP touch/break
• Clean, lightweight, no-repaint performance on any intraday timeframe
HOW TO USE
Apply to 1–60 min charts. Use the live VWAP as the primary volume-weighted fair-value line and the right-margin candle for immediate visual context of today’s developing range and bias.
CREDIT & TRANSPARENCY
Core methodology: public domain (Current Day OHLM + Anchored VWAP).
This is an independent implementation. The right-margin live candle display, exportable plots, alerting system, and overall presentation are original.
DISCLAIMER
For educational and informational purposes only. Not financial advice. Test thoroughly.

Friendly IT Algo SystemFriendly IT Algo System
Hello, this is the YouTube channel 'Friendly IT'.
This indicator is an All-in-One tool designed to help beginners easily identify trends and entry points by automating complex chart analysis.
It goes beyond simple moving average crosses by analyzing Volume (Whale Activity), Divergence, and Support/Resistance to display highly reliable signals.
The most significant feature of this indicator is that it clearly displays the specific Long and Short entry prices directly on the chart. This allows traders to know exactly at what price to enter the market without confusion.
Users can freely adjust all setting values, such as EMA lengths and volume multipliers, to optimize the strategy for the specific stock or cryptocurrency they are trading.
1. Whale Volume Hunter
- Displays fluorescent candles and entry prices only when volume exceeds 1.5x the average.
- Filters out fake signals and captures genuine trends driven by institutional activity.
2. Smart Order Block
- Green Box: High probability support zone (Buy area).
- Red Box: High probability resistance zone (Sell area).
- Automatically draws boxes to help set price targets and stop-loss levels.
3. Divergence Lines
- Bullish Divergence (Green Line): Price makes a lower low, but the indicator makes a higher low (Reversal signal).
- Bearish Divergence (Red Line): Price makes a higher high, but the indicator makes a lower high (Drop signal).
- Visually connects highs and lows with lines for intuitive reading.
4. Auto Fibonacci
- Automatically plots the key reversal levels: 0.618 (Bold White Line) and 0.5.
5. Noise Filter (Sideways Market)
- Uses the ADX indicator to highlight choppy, sideways markets with a Gray Background.
- It is recommended to avoid trading during these periods to prevent losses.
1. Entry
- LONG: Consider buying when a Green Neon Candle appears with a price number at the bottom.
- SHORT: Consider selling when a Pink Neon Candle appears with a price number at the top.
2. Exit
- Take partial profits at Order Blocks (Colored Boxes).
- Take profit when price touches the White Bold Line (Fib 0.618).
- React immediately if an opposing Divergence Line appears.
3. Note
- Reliability is low during Gray Backgrounds (Sideways market); avoid entering trades.
Friendly IT Algo System
안녕하세요, 유튜브 채널 '친절한 아이티'입니다.
이 지표는 복잡한 차트 분석을 자동화하여 초보자도 쉽게 추세와 타점을 잡을 수 있도록 설계된 올인원(All-in-One) 보조지표입니다.
단순한 이동평균선 크로스가 아니라, 거래량(세력 개입), 다이버전스, 매물대를 복합적으로 분석하여 신뢰도 높은 신호만 표시합니다.
이 지표의 가장 큰 장점은 차트에 롱(Long)과 숏(Short)의 진입 가격을 숫자로 명확하게 표시해 준다는 것입니다. 덕분에 사용자는 헷갈리지 않고 정확한 가격에 진입 타점을 잡을 수 있습니다.
이동평균선(EMA) 길이를 비롯한 모든 설정값은 본인이 거래하는 주식이나 코인의 특성에 맞게 자유롭게 변경하여 최적화할 수 있습니다.
1. 세력 거래량 감지 (Whale Volume Hunter)
- 평균 거래량의 1.5배 이상이 터질 때만 형광색 캔들과 진입 가격을 표시합니다.
- 속임수 신호를 걸러내고 세력이 개입한 진짜 추세만 포착합니다.
2. 스마트 오더블락 (Smart Order Block)
- 초록색 박스: 가격이 지지받을 확률이 높은 매수 구간
- 빨간색 박스: 가격이 저항받을 확률이 높은 매도 구간
- 차트에 자동으로 박스를 그려주어 목표가 및 손절 라인 설정에 도움을 줍니다.
3. 다이버전스 라인 (Divergence Lines)
- 상승 다이버전스 (초록선): 가격은 하락했으나 지표가 상승할 때 (반등 신호)
- 하락 다이버전스 (빨간선): 가격은 상승했으나 지표가 하락할 때 (하락 신호)
- 꼬리와 꼬리를 잇는 선으로 직관적으로 표시됩니다.
4. 자동 피보나치 (Auto Fibonacci)
- 반등의 핵심 구간인 0.618(흰색 굵은 선)과 0.5 구간을 자동으로 작도합니다.
5. 횡보장 필터 (Noise Filter)
- ADX 지표를 활용해 추세가 없는 지루한 횡보장은 회색 배경으로 표시합니다.
- 이때는 매매를 쉬면서 손실을 방지할 수 있습니다.
1. 진입 (Entry)
- LONG: 초록색 형광 캔들과 함께 하단에 가격(숫자)이 뜨면 매수 고려
- SHORT: 핑크색 형광 캔들과 함께 상단에 가격(숫자)이 뜨면 매도 고려
2. 청산 (Exit)
- 오더블락(색깔 박스)에 도달했을 때 분할 익절
- 하얀색 굵은 선(피보나치 0.618)에 닿았을 때 익절
- 반대 방향의 다이버전스 선이 생기면 즉시 대응
3. 주의사항
- 회색 배경(횡보장)에서는 신뢰도가 낮으니 진입을 자제하세요.
