Volume Pressure and PercentVPP Volume Pressure and Percentage Indicator with a Volume Trendline that indicates which side is driving the flow.
Features:
1. Buy/Sell Pressure Bars (Core Volume Split)
The indicator separates each candle’s volume into buy volume (green) above the zero line and sell volume (red) below it. This gives you a real-time visualization of which side is more aggressive within the current bar. Instead of waiting for prices to move or candles to close, you can instantly see whether buyers or sellers are stepping in.
2. Dynamic Total Volume (Invisible Histogram + Status Line Color)
The total volume of each bar is tracked behind the scenes and displayed in the pinned status line using a dynamic color—green when buyers dominate, red when sellers dominate. The histogram for total volume is invisible to keep the chart clean, but the total volume figure stays visible and changes color based on who is in control. This gives you instant confirmation of whether institutional-sized volume supports the direction shown by the buy/sell pressure, which is especially valuable when evaluating the risk or conviction behind a potential entry.
3. Percentage Mode (% of Bar Volume)
When toggled on, the indicator converts each bar into percent buy vs percent sell, normalizing all flow to a 0–100% scale. This mode is incredibly useful when comparing pressure across different times of day, gaps, or varying volume conditions—such as early morning spikes versus lunchtime chop. By removing absolute volume from the equation, you gain a clean look at the actual imbalance between buyers and sellers.
4. 70% Pressure Band (Imbalance Threshold Zone)
In percentage mode, the indicator displays a subtle 70% band (a light gray zone) above and below the zero line, showing where buy or sell pressure reaches extreme dominance (≥70%). When a bar’s buy or sell percentage enters this zone, it highlights moments of exhaustion, acceleration, or potential reversal. The band acts like a real-time overbought/oversold gauge specifically for volume imbalance, not price.
5. Trend Line (Net Pressure Trend / Reversal Detector)
The trend line smooths out the net volume pressure (buy volume minus sell volume or its percentage equivalent) and shows the overall direction of order flow. When the line slopes upward, buyers are gaining control; when it slopes downward, sellers are taking over. This trend line acts as a real-time momentum indicator based directly on flow rather than price. Because it reacts quickly to intrabar shifts in buy/sell pressure, it often turns before price does—giving you a measurable timing edge.
6. Auto-Selecting Trend Source (Volume Net, Percent Net, or CVD)
The indicator lets you choose how the trend line is calculated: Volume Net (buy minus sell volume), Percent Net (normalized imbalance), or CVD (Cumulative Volume Delta) for long-term flow bias. The default “Auto” mode automatically switches between Volume Net and Percent Net depending on which view you’re using. This flexibility allows the trend line to remain meaningful whether you’re analyzing raw volume or normalized percentage data.
7. Pinned (Status Line) Totals in K/M/B Format
Regardless of whether you’re in volume or percentage mode, the indicator always displays Total Volume, Buy Volume, and Sell Volume in the status line using abbreviated K, M, B formatting. These values update in real time and are color-coded: green for bullish dominance, red for bearish. This gives you a concise snapshot of order flow strength on every bar.
---------------------
How To Use:
Support Level Zones
• Watch for Buy bars increasing + Trend line flipping up right at or slightly below support.
• This often signals absorption — market makers filling large buy orders before reversal.
• Confirmation: Price reclaims VWAP ... enter calls / longs.
Resistance Level Zones
• Watch for Sell bars increasing + Trend line flattening/turning down near resistance.
• This signals distribution or stop runs.
• Confirmation: Price rejects VWAP ... enter puts / shorts.
Breakout Traps
• Sometimes you’ll see price break a level, but the flow doesn’t confirm (buy volume doesn’t expand).
• That’s a false breakout — fade it with options opposite the move.
Volum

Volume GrabdTraderVol GrandTrader — Advanced Volume Indicator
Vol GrandTrader is an enhanced version of the standard volume indicator that shows not only regular chart volume but also higher-timeframe (HTF) volume and highlights significant volume spikes.
Key Features
🔹 HTF Volume
Display volume from a higher timeframe to better understand larger market flows and institutional activity.
🔹 Volume Spike Detection
The indicator highlights bars where volume exceeds the average of the last N candles by a chosen multiplier — helping you spot strong moves, breakouts, and aggressive entries.
Settings
Volume Timeframe (HTF) — select a higher timeframe for additional volume.
Average Volume Length — period for calculating average volume.
Spike Multiplier — threshold for detecting volume spikes.
Why Traders Use It
Better visibility of major market participants
Clear detection of abnormal volume events
Useful for day traders, scalpers, and swing traders
A simple yet powerful tool for deeper volume analysis.

Buy Sell Entry Filter SYS (SMC IDM LIT)BUY SELL Entry FILTER
An advanced market analysis tool. It provides visual Buy/Sell signals in the form of triangles (▲▼), as well as analytical elements such as Entry/Stop Loss lines, a delta table, overbought and oversold zones, structural market elements with breakouts, displays information from higher time frames, and most importantly, liquidity blocks that trigger reactions. The indicator has a number of built-in filters that help remove unnecessary Buy/Sell signals from the chart. This allows you to create several profitable strategies. You don't need to sit in front of the charts; the alert system (ALERTS) will tell you when to pay attention to the chart and quickly enter a trade.
There are many signals, and the ▲▼ lines themselves are not an entry point. You need to filter them using other tools, such as liquidity blocks (LB and HTF LB), trend, OS/OB, Delta, and Pullback breakout.
If the ▲▼ appears in the right place, for example, in the liquidity block with the correct trend and the correct delta, then you can enter a trade!
Ideally, take short trades of 1/3 – 1/5 RR on a 1-minute timeframe and be sure to set a stop loss.
Remember! You are solely responsible for your deposit!
Buy/Sell, Entry/SL, OS/OB, Filter, EMA, Delta
This main group of settings is responsible for generating buy and sell signals, setting filters, and displaying moving averages.
1. Buy/Sell Main: Enables/disables the display of the main Buy/Sell signal as a ▲▼. This is a specific pattern that identifies potential trend reversals or continuations.
Buy/Sell Simple: Toggles the display of a simplified Buy/Sell signal in the ▲▼ pattern.
This pattern is less powerful than the main one, but works well in certain contexts.
2. Trend Delta Table: Displays a table on the chart showing the cumulative volume delta for the current trend, as well as the percentage. Useful for assessing the strength of a trend.
3. Entry/SL: When enabled, draws horizontal lines on the chart for Entry and Stop Loss.
4. Filters (Delta, Trend, OS/OB, HTF OS/OB):
These filters help filter out false signals. A Buy/Sell signal is displayed only if it passes all enabled filters:
Delta Filter: A signal is generated if the volume percentage delta (set by the user) matches the signal direction (positive for Buy, negative for Sell).
Trend Filter (EMA): A signal is generated if it matches the trend direction.
OS/OB Filter (RSI): A signal is generated if the price where the signal formed is in the desired zone (below Oversold for Buy, above Overbought for Sell).
HTF OS/OB Filter (RSI): Same as OS/OB, but uses the RSI on a higher timeframe (HTF).
EMA 1 & EMA 2: Displays two exponential moving averages on the chart (default 50 and 100). The line color changes (e.g., green if EMA1 is above EMA2).
Overbought/oversold zone
This group configures overbought/oversold levels and zones, both on the current and higher timeframes.
1. OS/OB zone: Enables/disables the display of dynamic overbought (Oversold) and oversold (Overbought) levels. These levels "float," adapting to the current price. 2. Period: Period for calculating zones (default 50)
OS: Level below which the Oversold zone is defined (default 40).
OB: Level above which the Overbought zone is defined (default 60).
Labels: Toggles the display of text labels (--- OB, --- OS) next to the corresponding levels.
Mid: Toggles the display of the center level and its color.
HTF Zones & Labels: Same as for OS/OB, but for levels on a higher timeframe (HTF).
Smooth: Enables smoothing for calculated price levels of zones, making the lines less sharp.
Structure / Breakout line
This setting adds structural analysis elements and breakout lines to the chart. 1. BO Lines (Breakout Lines): Displays horizontal lines on the chart when the price breaks through the external pullback against the trend, thus showing ChoCh.
2. HH/LL: Displays markers (HH - LL - HL - LH) on the chart to indicate key market structural points.________________________________________
Pullbacks EXT/INT
This setting is responsible for the visualization of pullback lines (Pullback) at external (EXT) and internal (INT) levels.
1. Ext (External): Displays lines connecting external extremes (Pullback), showing potential pullback levels.
2. Int (Internal): Displays lines connecting internal extremes (Pullback).
3. Pending Ext/Int: Displays potential pullback lines that may form if the price reaches the next extreme.
Liquidity blocks
Adds visual rectangles (blocks) to the chart, representing potential liquidity zones (where large orders were placed).
1. LB tune: Parameter determining how many candles are used to determine the pattern for a block.
2. High zone: Color of the line inside the block, indicating the strongest part of the block.
3. Show deleted: Shows deleted (broken) blocks in a different color.
4. Volume LB: Enables/disables the display of the volume value in the block.
Quick liquidity blocks
Similar to main blocks, but creates quick blocks. If a quick block is confirmed, it becomes the main LB; if not, it disappears.
1. Quick LB: Enables/disables quick blocks.
2. QLB tune: Pattern length parameter for quick blocks.
HTF liquidity blocks
Displays LB from a higher timeframe (HTF), using the same principles as main blocks. 1. HTF: Enable/disable HTF blocks.
2. Select a timeframe for calculation.
Alerts
A system for alerting you to important indicator actions. Alerts are triggered by certain events.
1. Bull PB Breakout / Bear PB Breakout: Alert when the external pullback is broken and a ChoCh is formed.
2. Trend Change: Alert when a trend changes.
3. New Block: Alert when a new main liquidity block is formed.
4. New HTF Block: Alert when a new HTF liquidity block is formed.
5. Touch Block: Alert when the price of the main liquidity block is touched.
6. Touch HTF Block: Alert when the price of the HTF liquidity block is touched.
7. Touch mode / Touch mode HTF: Select the alert frequency (before or after the bar closes).
This indicator provides a powerful and flexible tool for market analysis, combining several approaches in a single interface.

Fractal Break Strategy with Time FilterThis strategy isn't complete yet but just curious how fast they will take it down. It is based off breaks of fractals and then taking the High/Low of the break candle

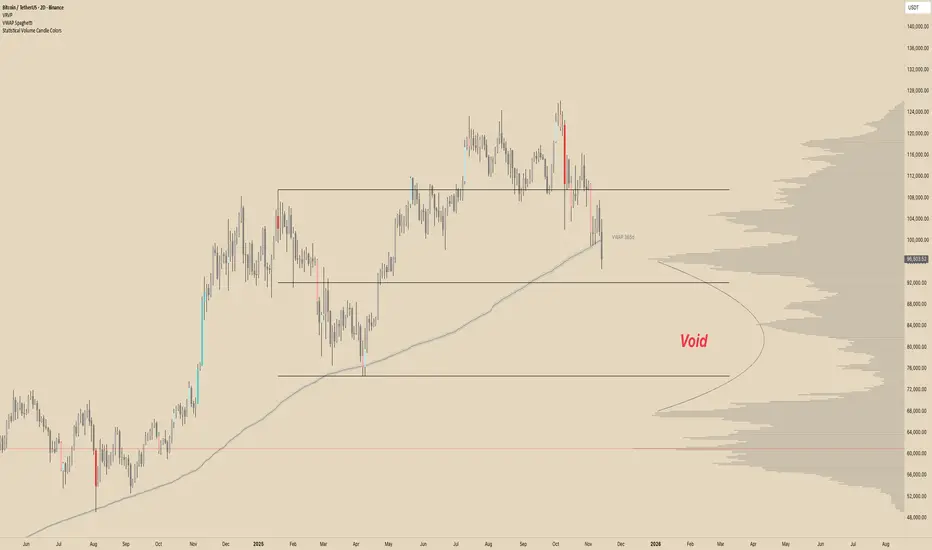
Statistical Volume With Candle ColorsStatistical Volume Candle Colors
Statistical Volume Candle Colors is a simple, powerful tool that visually highlights candles based on how unusual their volume is compared to recent history. Instead of using fixed thresholds, it uses standard deviation statistics to identify when volume is normal, elevated, or extremely high — and colors candles accordingly.
This makes it easy to spot high-interest moments in the market where buyers or sellers stepped in aggressively.
⸻
How It Works
The script looks back over a user-defined period (default 20 candles) and calculates:
• Average volume (SMA)
• Standard deviation of volume
• Two dynamic thresholds:
• 1st standard deviation level
• 2nd standard deviation level
These levels scale automatically with market conditions, so the indicator adapts whether volume is high or low overall.
⸻
Color Logic
Each candle gets a color based on two factors:
1. Price direction
• Bullish → close ≥ open
• Bearish → close < open
2. How extreme the candle’s volume is
The script evaluates volume vs statistical thresholds:
Normal Volume
• Bullish normal → gray
• Bearish normal → dark gray
Above 1st Standard Deviation
• Bullish → light teal
• Bearish → light red
Above 2nd Standard Deviation (very high volume)
• Bullish → bright teal
• Bearish → bright red
These colors clearly separate routine candles from statistically significant ones.
⸻
Why This Is Useful
• Identify high-participation moments — where institutions or large players may be active
• Spot exhaustion or absorption — extreme volume at highs/lows
• Confirm breakouts — price moves backed by strong volume deviations
• Filter noise — see only candles that matter statistically
⸻
Customization
You can adjust:
• Lookback period (how far back to measure volume stats)
• Std dev multipliers (how strict the thresholds are)
• All colors (normal, high-volume, extreme-volume, bullish/bearish)
• Transparency level
This makes the indicator flexible for any trading style or timeframe.
⸻
In short:
Statistical Volume Candle Colors transforms standard candles into a volume-based heatmap, highlighting exactly when the market shows real interest — and when it doesn’t. It’s a simple drop-in replacement for standard candles that adds powerful context with zero extra chart clutter.

VWAP SpaghettiVWAP Spaghetti is a multi-timeframe VWAP overlay designed to show where price is trading relative to its volume-weighted “fair value” across several horizons at once.
The script plots up to five separate VWAPs (default: 30, 60, 90, 180, and 365) directly on your chart, each with its own color, bands, and labels. You can use it to see short, medium, and long-term VWAP structure in one view and quickly spot areas of support/resistance, mean-reversion zones, and where price is trading at a premium or discount.
⸻
Core Idea
• VWAP (Volume-Weighted Average Price) shows the average price paid, weighted by volume.
• This script stacks multiple rolling VWAPs together (your “spaghetti”) so you can see how price interacts with different time horizons instead of just one.
⸻
Two Modes: Candles vs. Days
• Candles mode
• Each VWAP is calculated over the last N candles on your current timeframe.
• Example: On a 1h chart with period = 30, you’re seeing a 30-candle VWAP (30hours).
• Days mode
• Treats the input as N days and automatically chooses higher timeframes (60/120/240/360 min or Daily) to keep the lines smooth and extend history.
• Great for things like “30-day VWAP” or “365-day VWAP” regardless of your chart timeframe.
• In this mode, labels add a “d” suffix (e.g., VWAP 30d).
You can switch between these with the “Timeframe Type” setting: Candles or Days.
⸻
What Each VWAP Line Includes
For each of the 5 VWAPs you can independently control:
• Period
• Default examples: 30 / 60 / 90 / 180 / 365 (candles or days, depending on mode).
• Style & Visibility
• Line color and width.
• Toggle on/off for each VWAP.
• Labels
• Optional label on the far right of the chart showing the period (e.g., VWAP 60 or VWAP 60d).
• Adjustable label size and horizontal offset.
• Percent Deviation Cloud
• Upper and lower bands at +/- X% from the VWAP (default 0.4%).
• Fills a soft “cloud” around the VWAP to visualize premium/discount zones.
• Standard Deviation Bands (optional)
• Toggle standard deviation bands on/off for each VWAP.
• Uses a volume-weighted standard deviation and a configurable multiplier (e.g., 1.0, 1.5, 2.0).
• Plots an additional cloud around the VWAP based on volatility instead of a fixed percentage.
⸻
How Traders Might Use It
• Mean reversion:
Look for price stretching far outside a VWAP cloud and snapping back toward it.
• Trend structure:
Multiple VWAPs stacked and sloping in the same direction can help visualize trend strength across different horizons.
• Dynamic support/resistance:
VWAP lines and their bands often act as reaction levels where price consolidates or reverses.
• Multi-horizon context:
See short-term and long-term “fair value” at the same time (e.g., intraday vs. 30-day vs. 365-day VWAP).
This script is meant to be visual, flexible, and simple to use: turn on the VWAPs you care about, choose Candles or Days mode, and let the “spaghetti” show you where price sits relative to volume-weighted value across time.
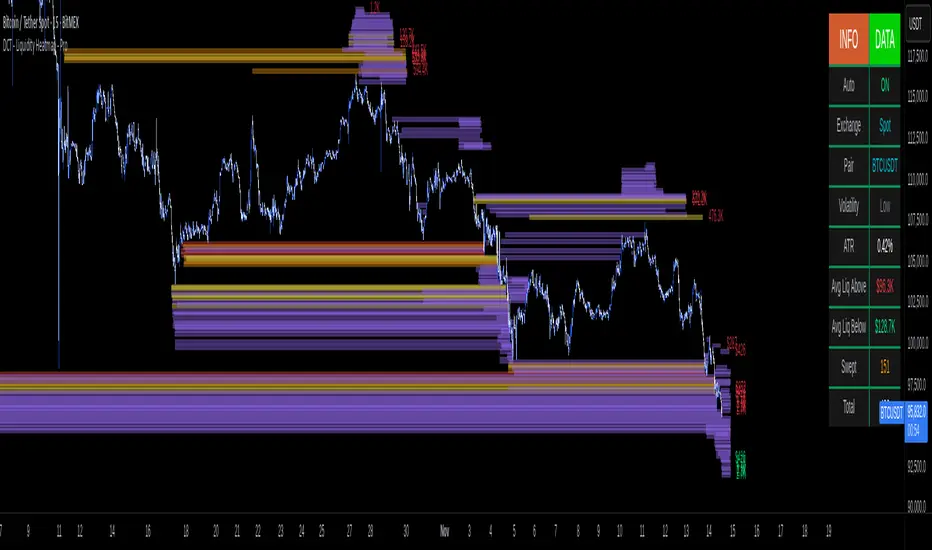
DCT - Liquidity Heatmap - ProOVERVIEW
This indicator visualizes liquidity levels by analyzing volume intensity, order flow structure, and price interaction. It highlights areas where buy-side and sell-side liquidity builds up, showing potential zones of interest.
WHAT IT DOES
- Detects buy-side and sell-side liquidity levels
- Tracks swept zones
- Displays volume intensity using a color-graded system
- Optional CVD mode showing directional volume bias
- Adapts automatically to different market types and volatility states
- Extends active levels forward
- Cleans up old data automatically
- Includes optional alert conditions
KEY FEATURES
- Automatic market and volatility identification
- Smart spacing and level management
- Optional CVD tracking
- Forward level projection
- Swept level preservation
- Imbalance markers
- Real-time info table with liquidity stats, volatility state, and level counts
- Memory-optimized handling for long charts
IMPORTANT NOTES
- Not a predictive tool
- Not a standalone trading system
- Effectiveness varies by timeframe and data quality
- Optimized for crypto markets
- Historical visualization shows past detected levels
HOW TO USE
- Add indicator to your chart
- Adjust spacing to widen or tighten clusters
- Enable CVD if directional pressure is needed
- Configure alerts if desired
- Use Compact mode on smaller screens
TECHNICAL DETAILS
- Pine v6
- Overlay: true
- Max boxes: 500
- Memory optimized
- Works on Perpetual and Spot crypto markets
DISCLAIMER
For analysis and educational use only. No financial advice. Markets can behave unpredictably. Use your own judgment and risk management.
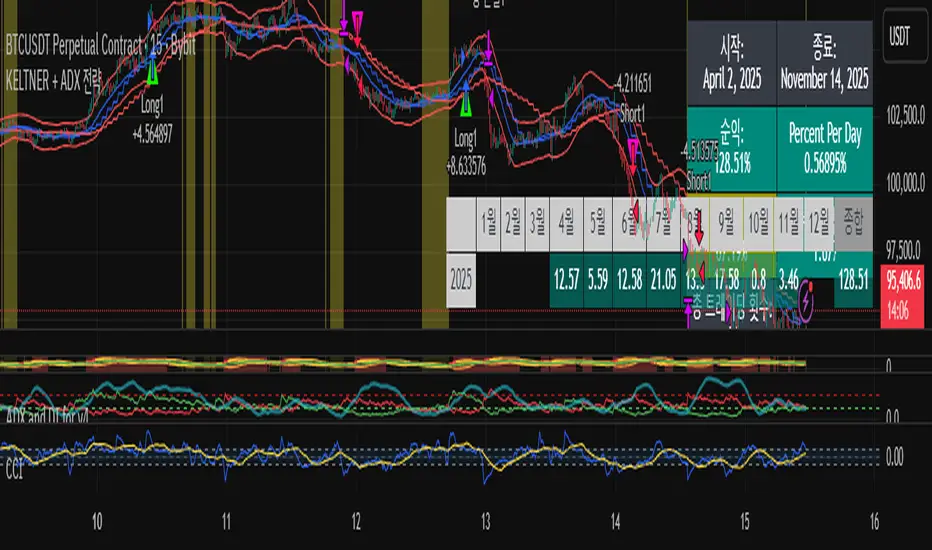
KELTNER + ADX 전략It's a trend strategy based on the Keltner channel and ADX. It's optimized for the Bitcoin Futures 15 Distribution Chart.
POC Lines (Daily / Weekly / Monthly)This indicator plots the Point of Control (POC) on your chart for three key timeframes — daily, weekly, and monthly. The POC is the price level at which the highest trading volume occurred during a given period, highlighting where market participants were most active.
How to Trade Using the Daily / Weekly / Monthly POC Indicator
Identify Market Bias
Use the monthly POC as a major structural reference. If price is above the monthly POC, bias may be bullish; below it may signal caution or potential bearish bias.
Use the weekly POC for intermediate trend context. Price respecting the weekly POC can enhance confidence in direction.
Use the daily POC for fine-tuning entries, exits or intraday structure.
Use POC as Support/Resistance Zones
When price approaches a POC from above, the level can act as support — look for bullish reversal signals.
When price approaches a POC from below, it can act as resistance — look for bearish rejection setups.
If price breaks through a POC convincingly (with strong volume or momentum), then the level may flip: the broken POC becomes a new reference zone for opposite side trades.
Timeframe Confluence = Higher Probability
A trade setup is stronger when the daily, weekly, and monthly POCs align or cluster near the same price zone. This confluence raises the chance that price will react.
Conversely, avoid setups where the POCs are widely scattered across timeframes — these have less structural weight.
Entry, Stop & Target Strategy
Entry: Enter once price touches a significant POC level and shows confirmation (e.g., candlestick reversal, volume spike, or confluence with other level).
Stop-Loss: Place stop just beyond the POC level (for support trades, slightly below; for resistance trades, slightly above).
Target: Use the next major POC or price structure level (previous high/low, value area edges) as your initial target. If price moves through the POC, target a breakout to the next structural zone.
Be patient — price may test a POC level multiple times or ignore it entirely before reacting.
Use the POC indicator as a guiding framework, not a guarantee. Combine with other tools (trend direction, price action, volume, market context) to refine your execution.

Multi Rolling VWAPMulti Rolling VWAP Indicator
Displays 4 volume-weighted average price (VWAP) levels on your chart:
7D VWAP - Weekly rolling average
30D VWAP - Monthly rolling average
90D VWAP - Quarterly rolling average
365D VWAP - Yearly rolling average
Each VWAP shows where the average price is, weighted by volume. Institutional traders often use these levels as support/resistance.
Optional Features:
Bands show volatility zones (Value Area High/Low)
Anchor modes: Reset weekly, monthly, quarterly, or yearly instead of rolling
Crypto volume aggregation from 15+ exchanges for accurate calculations
Clean, minimal design for white background charts.

VWAP D/W/M + MA100 & EMA100 albanThis TradingView indicator displays three independent VWAPs (Volume Weighted Average Prices) along with MA100 (Simple Moving Average) and EMA100 (Exponential Moving Average) on the chart.
Key Features:
VWAP #1, VWAP #2, VWAP #3: Each VWAP can be configured independently with:
Source (hlc3, close, etc.)
Anchor period (Session, Week, Month, Quarter, Year, Decade, Century, Earnings, Dividends, Splits)
Offset
Option to hide on daily or higher timeframes
MA100: 100-period Simple Moving Average
EMA100: 100-period Exponential Moving Average
Purpose:
This script is ideal for traders who want to track multiple VWAP levels simultaneously while also monitoring the 100-period moving averages for trend analysis. It provides a clean setup without bands or fills, focusing solely on price averages.
Use Cases:
Identify intraday or multi-timeframe VWAP levels
Combine VWAP levels with MA100/EMA100 for support/resistance analysis
Analyze trend direction and momentum using moving averages

SureTradeFX VWAP VWAP (Volume Weighted Average Price) is a volume-weighted average price over a specific period. Traders and institutions use it to see the “true” price based on both price and traded volume, not just price alone.

Multi-Session VWAP (NY, London, Asia) + HOD/LOD BandsMulti-Session VWAP (NY, London, Asia) + HOD/LOD Bands

Range Oascilator + LessDivergences + MACD+StochRSIRange Oscillator + EMA Filter
Calculates a custom oscillator based on the highest high and lowest low over a chosen period.
Generates BUY signals when the oscillator crosses up from the oversold zone and price is above the EMA.
Generates SELL signals when the oscillator crosses down from the overbought zone and price is below the EMA.
MACD (3‑10‑16 EMA Settings)
Uses fast EMA = 3, slow EMA = 10, signal EMA = 16.
Detects bullish and bearish crossovers.
These crossovers only trigger a single unified buy/sell signal if they coincide with Stochastic RSI being in oversold (for buy) or overbought (for sell) zones.
Stochastic RSI
Standard calculation with %K and %D smoothing.
Defines oversold (<20) and overbought (>80) zones.
Used both for divergence detection and as a filter for MACD signals.
Divergence Detection
RSI Divergence: Price makes a lower low but RSI makes a higher low (bullish), or price makes a higher high but RSI makes a lower high (bearish).
MACD Histogram Divergence: Price makes a lower low but MACD histogram makes a higher low (bullish), or price makes a higher high but MACD histogram makes a lower high (bearish).
Stochastic RSI Divergence: Similar logic applied to %K line.
Divergences are flagged only once per pivot to avoid repetitive signals.
Visuals
EMA plotted on chart.
BUY/SELL signals shown as triangles above/below bars.
Divergences shown as labels (e.g., “RSI BullDiv”, “MACD BearDiv”).
Unified MACD+Stoch RSI signals shown in distinct colors (lime for buy, orange for sell).

Sani Momentum Target System [wjdtks255]Sani Momentum Target System Explanation & Trading Method
The Sani Momentum Target System is a momentum-based trading indicator that helps traders identify trend changes and determine precise entry points, stop-loss levels, and multiple profit targets.
Key Features:
Smoothed Price Calculation: Utilizes a glide-like smoothing function to reduce noise in price data.
Moving Averages: Calculates fast and slow EMAs on the smoothed price; the difference creates an oscillator.
Signal Line: A simple moving average smooths the oscillator to generate a signal line.
Trend Signals:
Buy signal when oscillator crosses above the signal line.
Sell signal when oscillator crosses below the signal line.
Entry, Stop Loss, Target Levels:
Entry price is set at current close on signal.
Stop loss is set by multiplying ATR by 2 against trend direction.
Three take profit targets (T1, T2, T3) are set by user-defined multiples of ATR.
Visual Display: Includes colored horizontal lines and labels for entry, stop loss, and targets.
Bars are colored by trend direction, and triangular markers show buy/sell signals.
How To Use This Indicator:
Entry: Place trades in the direction of the signal (long on buy, short on sell).
Stop Loss: Use the ATR-based stop loss line to minimize downside risk.
Profit Taking: Scale out profits or exit trades at target levels T1, T2, and T3.
Trend Confirmation: Confirm with oscillator trend direction before entry to avoid false signals.
Parameter Adjustment: Modify smoothing lengths, ATR period, and target multipliers to fit your trading style and timeframe.
Final Notes:
This indicator streamlines momentum trading by providing clear price targets and risk levels visually.
Always backtest strategies and apply proper risk management.
Suitable across asset classes: stocks, forex, cryptocurrencies.
If you want detailed guidance or customization, feel free to ask!

Accurate Sideways Market Detectorthis indicator is used to determine when the market is moving sideways

Intraday Technical Strength Dashboard — 5m (Universal) — FIXED2An Intraday Technical Strength Dashboard for RSI, OBV, MACD, ADX, and EMA Cloud

POC Volume Bar (Highest Volume in Range)What the highlighted POC bar means
🔶 1. Institutional interest
A POC often identifies where big money stepped in.
🔶 2. Support or resistance pivot
Large volume often signals:
• A reversal
• A breakout
• Or the beginning of a trend
🔶 3. Liquidity magnet
Price tends to revisit high-volume bars.
They act like magnets.
🔶 4. Trend confirmation or exhaustion
High volume on:
• Green candle → bullish participation
• Red candle → distribution / aggressive selling

Market Structure Volume Time Velocity ProfileThis is the Market Structure Volume Time Velocity Profile (MSVTVP). It combines event-based profiling with advanced metrics like Time and Velocity (Flow Rate). Instead of fixed time periods, profiles are anchored to critical market events (Swings, Structure Breaks, Delta Breaks), giving you a precise view of value development during specific market phases.
## The 3 Dimensions of the Market
Unlike standard tools that only show Volume, MSVTVP allows you
to switch between three critical metrics:
1. **VOLUME Profile (The "Where"):**
* Shows standard acceptance. High volume nodes (HVN)
are magnets for price.
2. **TIME Profile (The "How Long"):**
* Similar to TPO, it measures how long price spent at each
level.
* **High Time:** True acceptance and fair value.
* **Low Time:** Rejection or rapid movement.
3. **VELOCITY Profile (The "How Fast"):**
* Measures the **speed of trading** (Contracts per Second).
This reveals the hidden intent of market participants.
* **High Velocity (Fast Flow):** Aggression. Initiative
buyers/sellers are hitting market orders rapidly. Often
seen at breakouts or in liquidity vacu.
* **Low Velocity (Slow Flow):** Absorption. Massive passive
limit orders are slowing price down despite high volume.
Often seen at major reversals ("hitting a brick wall").
Key Features:
1. **Event-Based Profile Anchoring:** The indicator starts a new
profile based on one of three user-selected events
('Profile Anchor'):
- **Swing:** A new profile begins when the 'impulse baseline'
(derived from intra-bar delta) changes. This baseline
adjusts when a new **price pivot** is confirmed: When a
price **high** forms, the baseline moves to the **lower**
of its previous level or the peak delta (max of
delta O/C) at the pivot. When a price **low** forms, it
moves to the **higher** of its previous level or the
trough delta (min of delta O/C) at the pivot.
- **Structure:** A new profile begins immediately on the bar
that *confirms* a market structure break (e.g., a new HH
or LL, based on a sequence of price pivots).
- **Delta:** A new profile begins immediately on the bar
that *confirms* a break in the *cumulative delta's*
market structure (e.g., a new HH or LL in the delta).
Both 'Swing' and 'Delta' anchors are derived from the same
**continuous (non-resetting) Cumulative Volume Profile Delta (CVPD)**,
which is built from the intra-bar statistical analysis.
2. **Statistical Profile Engine:** For each bar in the anchored
period, the indicator builds a volume profile on a lower
'Intra-Bar Timeframe'. Instead of simple tick counting, it
uses advanced statistical models:
- **Allocation ('Allot model'):** 'PDF' (Probability Density
Function) distributes volume proportionally across the
bar's range based on an assumed statistical model
(e.g., T4-Skew). 'Classic' assigns all volume to
the close.
- **Buy/Sell Split ('Volume Estimator'):** 'Dynamic'
applies a model that analyzes candle wicks and
recent trend to estimate buy/sell pressure. 'Classic'
classifies all volume based on the candle color.
3. **Visualization & Lag:** The indicator plots the final
profile (as a polygon) and the developing statistical
lines (POC, VA, VWAP, StdDev).
- **Note on Lag:** All anchor events require `Pivot Right Bars`
for confirmation.
- In 'Structure' and 'Delta' mode, the developing lines
(POC, VA, etc.) are plotted using a **non-repainting**
method (showing the value from `pivRi` bars ago).
- In 'Swing' mode, the profile is plotted **retroactively**,
starting *from the bar where the pivot occurred*. The
developing lines are also plotted with this full
`pivRi` lag to align with the past data.
4. **Flexible Display Modes:** The finalized profile can be displayed
in three ways: 'Up/Down' (buy vs. sell), 'Total' (combined
volume), and 'Delta' (net difference).
5. **Dynamic Row Sizing:** Includes an option ('Rows per Percent')
to automatically adjust the number of profile rows (buckets)
based on the profile's price range.
6. **Integrated Alerts:** Includes 13 alerts that trigger for:
- A new profile reset ('Profile was resetted').
- Price crossing any of the 6 developing levels (POC,
VA High/Low, VWAP, StdDev High/Low).
- **Alert Lag Assumption:** In 'Swing' mode, alerts are
delayed to match the retroactively plotted lines.
In 'Structure' and 'Delta' modes, alerts fire in
**real-time** based on the *current price* crossing
the *current (repainting)* value of the metric, which
may **differ from the non-repainting plotted line.**
**Caution: Real-Time Data Behavior (Intra-Bar Repainting)**
This indicator uses high-resolution intra-bar data. As a result, the
values on the **current, unclosed bar** (the real-time bar) will
update dynamically as new intra-bar data arrives. This includes
the values used for real-time alerts in 'Structure' and
'Delta' modes.
---
**DISCLAIMER**
1. **For Informational/Educational Use Only:** This indicator is
provided for informational and educational purposes only. It does
not constitute financial, investment, or trading advice, nor is
it a recommendation to buy or sell any asset.
2. **Use at Your Own Risk:** All trading decisions you make based on
the information or signals generated by this indicator are made
solely at your own risk.
3. **No Guarantee of Performance:** Past performance is not an
indicator of future results. The author makes no guarantee
regarding the accuracy of the signals or future profitability.
4. **No Liability:** The author shall not be held liable for any
financial losses or damages incurred directly or indirectly from
the use of this indicator.
5. **Signals Are Not Recommendations:** The alerts and visual signals
(e.g., crossovers) generated by this tool are not direct
recommendations to buy or sell. They are technical observations
for your own analysis and consideration.

Periodic Volume Time Velocity ProfileThis is the Periodic Volume Time Velocity Profile (PVTVP). It is an advanced professional profiling tool that goes beyond standard volume analysis by introducing Time and Velocity (Flow Rate) as profile dimensions.
By analyzing high-resolution intra-bar data, it builds
precise profiles for any custom period (Session, Day, Week, etc.),
helping you understand not just *where* the market traded,
but *how* it traded there.
## The 3 Dimensions of the Market
Unlike standard tools that only show Volume, PVTVP allows you
to switch between three critical metrics:
1. **VOLUME Profile (The "Where"):**
* Shows standard acceptance. High volume nodes (HVN)
are magnets for price.
2. **TIME Profile (The "How Long"):**
* Similar to TPO, it measures how long price spent at each
level.
* **High Time:** True acceptance and fair value.
* **Low Time:** Rejection or rapid movement.
3. **VELOCITY Profile (The "How Fast"):**
* Measures the **speed of trading** (Contracts per Second).
This reveals the hidden intent of market participants.
* **High Velocity (Fast Flow):** Aggression. Initiative
buyers/sellers are hitting market orders rapidly. Often
seen at breakouts or in liquidity vacuums.
* **Low Velocity (Slow Flow):** Absorption. Massive passive
limit orders are slowing price down despite high volume.
Often seen at major reversals ("hitting a brick wall").
## Key Features
1. **Statistical Volume Profile Engine:** For each bar in the selected
period, the indicator builds a complete volume profile on a lower
'Intra-Bar Timeframe'. Instead of simple tick counting, it uses
**statistical models ('PDF' allocation)** to distribute volume
across price levels and **advanced classifiers ('Dynamic' split)**
to determine the buy/sell pressure within that profile.
2. **Flexible Profile Display:** The **finalized profile** (plotted at
the end of each period) can be visualized in three distinct
ways: 'Up/Down' (buy vs. sell), 'Total' (combined volume),
and 'Delta' (net difference).
3. **Developing Key Levels:** The indicator also plots the developing
Point of Control (POC), Value Area (VA), VWAP, and Standard
Deviation bands in real-time as the period unfolds, providing
live insights into the emerging market structure.
4. **Dynamic Row Sizing:** Includes an option ('Rows per Percent')
to automatically adjust the number of profile rows (buckets)
based on the profile's price range, maintaining a consistent
visual density.
5. **Integrated Alerts:** Includes 12 alerts that trigger when the
main price crosses over or under the key developing levels:
POC, VWAP, Value Area High/Low, and the +/- Standard
Deviation bands.
**Caution: Real-Time Data Behavior (Intra-Bar Repainting)**
This indicator uses high-resolution intra-bar data. As a result, the
values on the **current, unclosed bar** (the real-time bar) will
update dynamically as new intra-bar data arrives. This behavior is
normal and necessary for this type of analysis. Signals should only
be considered final **after the main chart bar has closed.**
---
**DISCLAIMER**
1. **For Informational/Educational Use Only:** This indicator is
provided for informational and educational purposes only. It does
not constitute financial, investment, or trading advice, nor is
it a recommendation to buy or sell any asset.
2. **Use at Your Own Risk:** All trading decisions you make based on
the information or signals generated by this indicator are made
solely at your own risk.
3. **No Guarantee of Performance:** Past performance is not an
indicator of future results. The author makes no guarantee
regarding the accuracy of the signals or future profitability.
4. **No Liability:** The author shall not be held liable for any
financial losses or damages incurred directly or indirectly from
the use of this indicator.
5. **Signals Are Not Recommendations:** The alerts and visual signals
(e.g., crossovers) generated by this tool are not direct
recommendations to buy or sell. They are technical observations
for your own analysis and consideration.

Braid Filter StrategyThis strategy is like a sophisticated set of traffic lights and speed limit signs for trading. It only allows a trade when multiple indicators line up to confirm a strong move, giving it its "Braid Filter" name—it weaves together several conditions.
The strategy is set up to use 100% of your account equity (your trading funds) on a trade and does not "pyramid" (it won't add to an existing trade).
1. The Main Trend Check (The Traffic Lights)
The strategy uses three main filters that must agree before it considers a trade.
A. The "Chad Filter" (Direction & Strength)
This is the heart of the strategy, a custom combination of three different Moving AveragesThese averages have fast, medium, and slow settings (3, 7, and 14 periods).
Go Green (Buy Signal): The fastest average is higher than the medium average, AND the three averages are sufficiently separated (not tangled up, which indicates a strong move).
Go Red (Sell Signal): The medium average is higher than the fastest average, AND the three averages are sufficiently separated.
Neutral (Wait): If the averages are tangled or the separation isn't strong enough.
Key Trigger: A primary condition for a signal is when the Chad Filter changes color (e.g., from Red/Grey to Green).
B. The EMA Trend Bars (Secondary Confirmation)
This is a simpler, longer-term filter using a 34-period Exponential Moving Average (EMA). It checks if the current candle's average price is above or below this EMA.
Green Bars: The price is above the 34 EMA (Bullish Trend).
Red Bars: The price is below the 34 EMA (Bearish Trend).
Trades only happen if the signal direction matches the bar color. For a Buy, the bar must be Green. For a Sell, the bar must be Red.
C. ADX/DI Filter (The Speed Limit Sign)
This uses the Average Directional Index (ADX) and Directional Movement Indicators (DI) to check if a trend is actually in motion and getting stronger.
Must-Have Conditions:
The ADX value must be above 20 (meaning there is a trend, not just random movement).
The ADX line must be rising (meaning the trend is accelerating/getting stronger).
The strategy will only trade when the trend is strong and building momentum.
2. The Trading Action (Entry and Exit)
When all three filters (Chad Filter color change, EMA Trend Bar color, and ADX strength/slope) align, the strategy issues a signal, but it doesn't enter immediately.
Entry Strategy (The "Wait-for-Confirmation" Approach):
When a Buy Signal appears, the strategy sets a "Buy Stop" order at the signal candle's closing price.
It then waits for up to 3 candles (Candles Valid for Entry). The price must move up and hit that Buy Stop price within those 3 candles to confirm the move and enter the trade.
A Sell Signal works the same way but uses a "Sell Stop" at the closing price, waiting for the price to drop and hit it.
Risk Management (Stop Loss and Take Profit):
Stop Loss: To manage risk, the strategy finds a recent significant low (for a Buy) or high (for a Sell) over the last 20 candles and places the Stop Loss there. This is a logical place where the current move would be considered "broken" if the price reaches it.
Take Profit: It uses a fixed Risk:Reward Ratio (set to 1.5 by default). This means the potential profit (Take Profit distance) is $1.50 for every $1.00 of risk (Stop Loss distance).
3. Additional Controls
Time Filter: You can choose to only allow trades during specific hours of the day.
Visuals: It shows a small triangle on the chart where the signal happens and colors the background to reflect the Chad Filter's trend (Green/Red/Grey) and the candle bars to show the EMA trend (Lime/Red).
🎯 Summary of the Strategy's Goal
This strategy is designed to capture strong, confirmed momentum moves. It uses a fast, custom indicator ("Chad Filter") to detect the start of a new move, confirms that move with a slower trend filter (34 EMA), and then validates the move's strength with the ADX. By waiting a few candles for the price to hit the entry level, it aims to avoid false signals.

Braid Filter StrategyAnother of TradeIQ's youtube strategies. It looks a little messy but it combines all the indicators into one so there are no extra panes. This strategy is like a sophisticated set of traffic lights and speed limit signs for trading. It only allows a trade when multiple indicators line up to confirm a strong move, giving it its "Braid Filter" name—it weaves together several conditions.
The strategy is set up to use 100% of your account equity (your trading funds) on a trade and does not "pyramid" (it won't add to an existing trade).
1. The Main Trend Check (The Traffic Lights)
The strategy uses three main filters that must agree before it considers a trade.
A. The "Braid Filter" (Direction & Strength)
This is the heart of the strategy, a custom combination of three different Moving Averages
These averages have fast, medium, and slow settings (3, 7, and 14 periods).
Go Green (Buy Signal): The fastest average is higher than the medium average, AND the three averages are sufficiently separated (not tangled up, which indicates a strong move).
Go Red (Sell Signal): The medium average is higher than the fastest average, AND the three averages are sufficiently separated.
Neutral (Wait): If the averages are tangled or the separation isn't strong enough.
Key Trigger: A primary condition for a signal is when the Chad Filter changes color (e.g., from Red/Grey to Green).
B. The EMA Trend Bars (Secondary Confirmation)
This is a simpler, longer-term filter using a 34-period Exponential Moving Average (EMA). It checks if the current candle's average price is above or below this EMA.
Green Bars: The price is above the 34 EMA (Bullish Trend).
Red Bars: The price is below the 34 EMA (Bearish Trend).
Trades only happen if the signal direction matches the bar color. For a Buy, the bar must be Green. For a Sell, the bar must be Red.
C. ADX/DI Filter (The Speed Limit Sign)
This uses the Average Directional Index (ADX) and Directional Movement Indicators (DI) to check if a trend is actually in motion and getting stronger.
Must-Have Conditions:
The ADX value must be above 20 (meaning there is a trend, not just random movement).
The ADX line must be rising (meaning the trend is accelerating/getting stronger).
The strategy will only trade when the trend is strong and building momentum.
2. The Trading Action (Entry and Exit)
When all three filters (Chad Filter color change, EMA Trend Bar color, and ADX strength/slope) align, the strategy issues a signal, but it doesn't enter immediately.
Entry Strategy (The "Wait-for-Confirmation" Approach):
When a Buy Signal appears, the strategy sets a "Buy Stop" order at the signal candle's closing price.
It then waits for up to 3 candles (Candles Valid for Entry). The price must move up and hit that Buy Stop price within those 3 candles to confirm the move and enter the trade.
A Sell Signal works the same way but uses a "Sell Stop" at the closing price, waiting for the price to drop and hit it.
Risk Management (Stop Loss and Take Profit):
Stop Loss: To manage risk, the strategy finds a recent significant low (for a Buy) or high (for a Sell) over the last 20 candles and places the Stop Loss there. This is a logical place where the current move would be considered "broken" if the price reaches it.
Take Profit: It uses a fixed Risk:Reward Ratio (set to 1.5 by default). This means the potential profit (Take Profit distance) is $1.50 for every $1.00 of risk (Stop Loss distance).
3. Additional Controls
Time Filter: You can choose to only allow trades during specific hours of the day.
Visuals: It shows a small triangle on the chart where the signal happens and colors the background to reflect the Chad Filter's trend (Green/Red/Grey) and the candle bars to show the EMA trend (Lime/Red).
🎯 Summary of the Strategy's Goal
This strategy is designed to capture strong, confirmed momentum moves. It uses a fast, custom indicator ("Chad Filter") to detect the start of a new move, confirms that move with a slower trend filter (34 EMA), and then validates the move's strength with the ADX. By waiting a few candles for the price to hit the entry level, it aims to avoid false signals.

1m EMA Scalper + Lot Size HUD [DIMS]1m EMA Scalper w/ Pre-Alert + Lot Size HUD
Purpose:
A short-term (1-minute) scalping strategy for assets like XAUUSD, GBPJPY, and GER30/GER40, showing precise buy/sell signals, stop-loss, take-profit, breakeven levels, and a dynamic lot size HUD for risk management.
Key Features:
Signals:
Buy/Sell signals generated using EMA crossover (fast vs slow) + RSI filter + optional candle/volume filter.
Signals only appear during selected trading sessions (London & NY).
Pre-alert signals appear 30 seconds before the candle closes, so you can prepare to enter.
Stop Loss / Take Profit / Breakeven:
SL calculated using ATR × multiplier and adjustable for spread.
TP follows a configurable risk:reward ratio.
Breakeven can be toggled on/off and uses a custom multiplier.
Lines have customizable length, width, and style.
Lot Size HUD:
Automatically calculates lot size based on account balance, risk % or fixed amount, and leverage.
Shows stop distance in pips/points.
HUD retains the value for 5 minutes after the signal candle.
Flashes 30 seconds before the candle closes to prepare for the trade.
Auto-adjusts for XAUUSD, GBPJPY, GER30/GER40.
Alerts:
Alerts for pre-alert signals and confirmed signals.
Can toggle alerts on/off for both types.
Customization & Display:
Toggle buy/sell signals, SL/TP/BE lines, and pre-alert arrows.
Works entirely on-chart, displaying only the essential arrows, lines, and HUD.
Summary:
It’s a ready-to-trade scalping tool that combines fast technical signal detection with risk management, pre-alert timing, and visual trade guidance — letting you focus on execution without manually calculating lot size or monitoring every candle.
