Ready to continue to moving up soon.
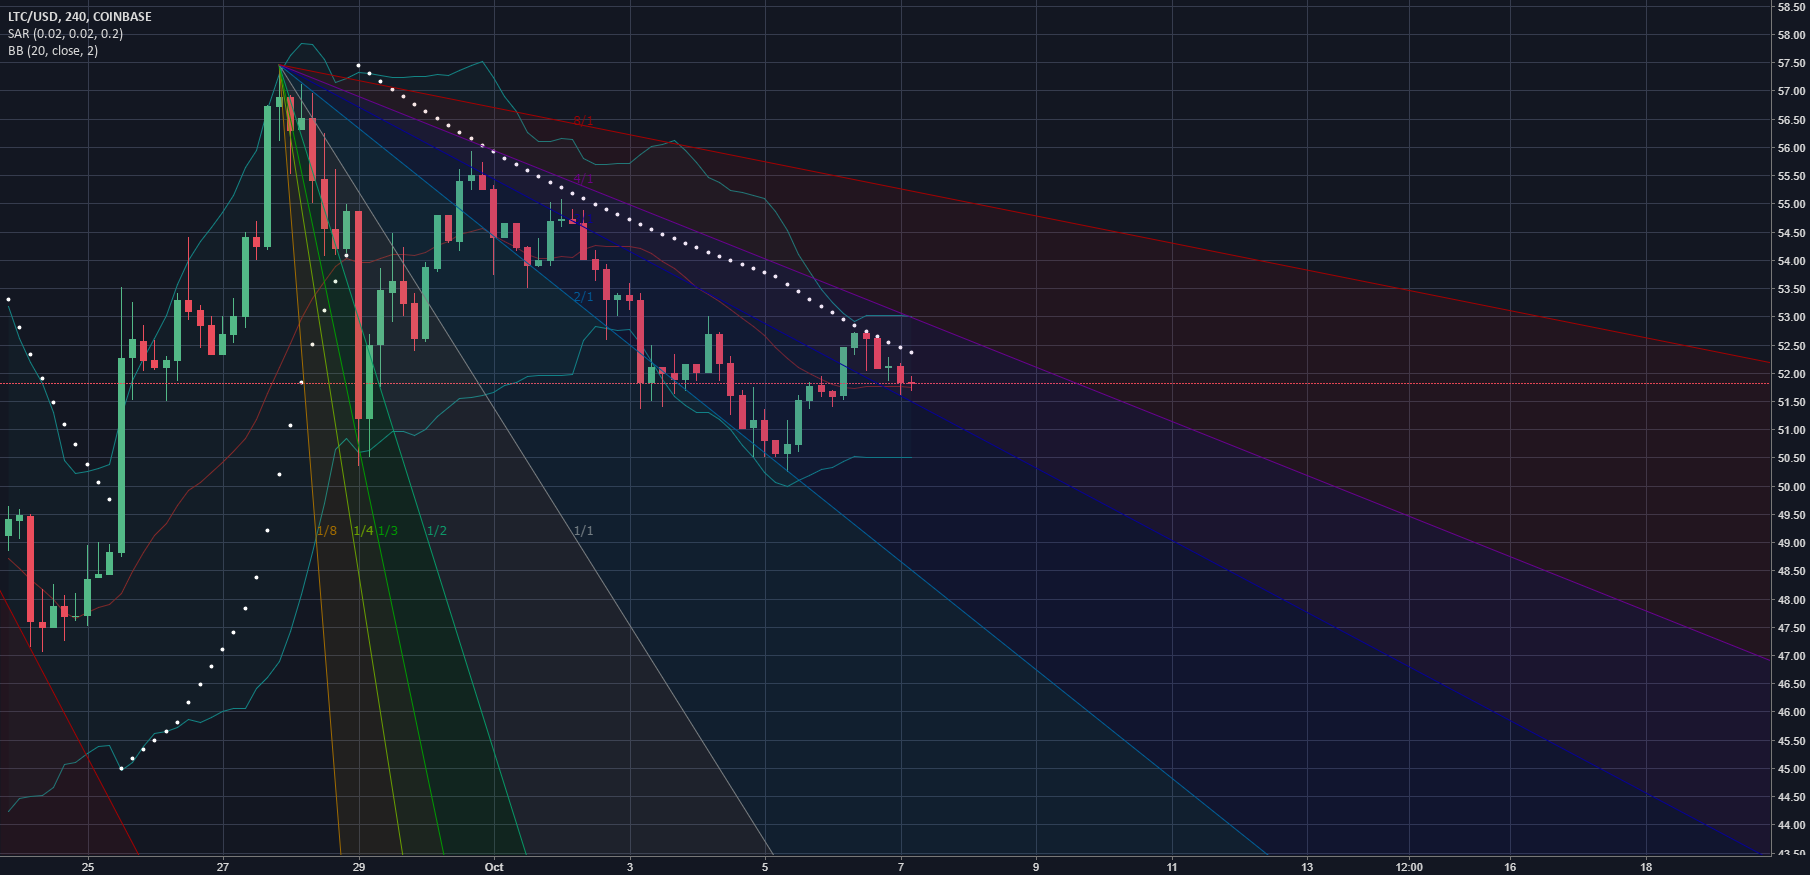
Once we break the red Gann Fan we'll go for another major move up. RSI oversold on 1hr chart, and is heading to oversold territory on the larger time intervals. The white dashed lines represent horizontal supports which will likely hold. So those are good entry spots if it gets there since there likely be moves up from those ranges.
Lot's of FUD around Bitcoin and it's forks right now. I think Bitcoin will be fine, and in fact likely go for a new all time high once the forking bullshyte is complete. Just like it did after the Bitcoin Cash fork, and Litecoin will likely follow Bitcoins waves up; this means in November/December we are very likely going to break the 100s. People get caught up in the price of the coins way too often. Litecoin is still way way way way way... way undervalued for what it is and it still has the strongest fundamentals in the entire market to back it up. This is a coin that took beatings from two fronts (Bitcoin going down, and China leaving the market) when we were at all time highs. And it survived the fiasco... If that does not prove that it is resilient... I don't know what else to tell people.
We are having major shakedowns where the price goes down on low volume to induce panic selling. This is a shitty practice but it is a practice that is necessary to get rid of weak hands before we break 100s.
Komen:
Seems like 56.55 was the bottom of this retracement. PSAR now bullish on the 1hr chart.
 Next we will turn the 4hr chart bullish; this will confirm major upside; it means we'll have to break 61.16-61.30 range.
Komen:
Interesting tinfoil hat theory that might actually happen....
Komen:
^If that tinfoilhat idea happens the plan is to sell at 140-144 range, and buy back when it falls 30ish% because it will bounce after falling that much. I recommend you guys do the same to accumulate more coins.
Komen:
This is how this one might play out.
Komen:
It may look like a step up pattern on the day chart or a fish hook after it dips to 62s from 73-74 range.
Komen:
Might of spoken too soon about 56.55 being our bottom of the retracement. Let's see if it holds. I am going to bed.
Komen:
I am awake now. Damn that was a slow bleed; like I said we are having major shakedowns. Now that we really found our bottom at 52.90. It may play out a little more differently.
First we will have to break 60.70+ to turn the 6hr PSAR bullish. 4hr PSAR already bullish... So turning the 6hr will confirm our major move up; doing so will most likely turn the MACD bullish on the 6hr chart.
First we will have to break 60.70+ to turn the 6hr PSAR bullish. 4hr PSAR already bullish... So turning the 6hr will confirm our major move up; doing so will most likely turn the MACD bullish on the 6hr chart.
Komen:
Also I think the red line might not be broken initially. We may touch it comeback down to the purple line and then break the red line.
Komen:
This may happen if we break the red gann fan. i.imgur.com/tuQUPu9.gifv
Komen:
We have to break that 60.70+ range to turn PSAR bullish. We are close.
Komen:
Looking at the 12hr chart Stoch RSI is ready move up with BTC and LTC. If LTC PSAR turns bullish on the 12hr chart we could very well go for a new all time high. But it is too soon to tell. Just wanted to point it out.
Komen:
6hr chart is really trying. I think it will succeed in turning PSAR bullish. May need a few hours. At the moment we have to break 61.40 and stay above it.
Komen:
SMMA 12 (golden) is setting up to pass the SMMA 24 (white) SMMA 50 (red) and SMMA 100 (blue). Looking good so far.
Komen:
We have passed blue
more sideways action will bring the moving averages closer; when they converge we see major moves.
Komen:
It may take any one of these time ranges to break the red fan.
Komen:
Posted the wrong link for the chart above with the times. This is the correct one.
Komen:
The SMMAs are beginning to bundle up.
Komen:
Komen:
That SAR right now. LOL
Komen:
A close above 72-73 on the 6hr chart would signal for a break out. I usually do not use point and figure charts. But that is what it says.
Komen:
The point and figure chart above is actually the 12hr chart no the 6hr.
SMMAs are bundling up.
SMMAs are bundling up.
Komen:
BBands nice and tight (signaling a move is coming); MACD and PSAR are setting up to turn bullish. Let's see how it goes.
Komen:
Keep in mind we may not break the red fan when we test it.
Komen:
Instead we may comeback down to the purple line one more time after hitting; and then break the red fan for real. But we could also break it the at the first try which further confirm a bullish market. If we don't break it the first time round it'll only allow the 4hr chart BBands to tighten up. We are tight on the 1hr chart, 4hr is a bit loose; however MACD and PSAR are already bullish on the 4hr chart. So that is a good sign.
Komen:
Keep in mind we may not break the red fan when we test it. Instead we may comeback down to the purple line one more time after hitting red fan; and then break the red fan for real after bouncing from the purple line. But we could also break it the at the first try which would confirm a bullish market. If we don't break it the first time round it'll allow the 4hr chart BBands to tighten up. We are tight on the 1hr chart, 4hr is a bit loose; however MACD and PSAR are already bullish on the 4hr chart. So that is a good sign. <-fixed wording.
Komen:
There is a bot on GDAX constantly selling 0.00837871 LTC to induce selling. It is night time generally buying pressure weakens during this time of the day. I think the bot(s) are trying to bring us down 1 more time. If that is the case we may retest those white lines (horizontal support ranges) or the purple fan; before finally going up and breaking the red fan.
Komen:
Fan hit! Now we see if we can continue moving up or come down 1 more time.
Komen:
PSAR bullish on 6hr chart!
Komen:
We have a possible bullish step up pattern developing.
Komen:
Seeing lot's of people complaining about the LTC/BTC ratio. All I can tell you is that it should rise when BTC starts stalling after reaching a new all time high. The ratio always catches up. It is just a matter of time.
Komen:
I don't think some of these people realize that an LTC/BTC ratio would not be possible unless there was a stable fiat value to compare. LTC/BTC is just (LTC/USD)/(BTC/USD)
Komen:
On Tradingview if you type COINBASE:LTCUSD/COINBASE:BTCUSD where the ticker symbol should you can actually derive the LTC/BTC ratio.
Komen:
Bots are back at it again! On GDAX there is one constantly selling 0.00837451 LTC to induce selling. It is night time generally buying pressure weakens during this time of the day.
Komen:
It is also Friday; there is generally a "weekend" dip that starts on Friday night, and finds bottom around 4AM-6AM Eastern Saturday morning. We may retest price ranges near those white lines; or price ranges near the purple fan.
Chart might just be checking for support levels (seeing where the buying pressure comes through); if that is the case it is a good sign.
God damn. That bot is annoying. Sort of like a repeat of yesterday night.
Also quit complaining about the ratio. It'll go back to 0.02 eventually probably within a month at the latest. Stoch RSI on the week chart for LTC/BTC is setting up to indicate upward price movement on the scale of weeks.
Komen:
Awake now. Bot is still going with those very small sell orders; same thing is happening on many other alt-coins as well. My theory is that a whale or a group of whales are suppressing the USD price down so the LTC/BTC ratio is nice and low for them to short BTC when it tops out, and pour all those profits to LTC, ETH and other coins. I think it's going to be epic when it happens. They must have a huge buy order to fill on market prices. So far we are riding down that Red Fan.
I did say we may not break it, and blow through it the first time. And we didn't so now we must wait until this shenanigans are done. We could very well test that 54 range once more.
I did say we may not break it, and blow through it the first time. And we didn't so now we must wait until this shenanigans are done. We could very well test that 54 range once more.
Komen:
Bot is still pushing small sell orders even when buying pressure is coming through. This is definitely a shake down.
Some LTC growth stats: i.imgur.com/hVEyxKN.png
If we hit even a fraction of the growth we had last year; expect 2018 to be very bullish. Even at the 33 mark LTC was up over 700% this year. At its peak it was at 2300%. And right now it is up over 1200%.
Some LTC growth stats: i.imgur.com/hVEyxKN.png
If we hit even a fraction of the growth we had last year; expect 2018 to be very bullish. Even at the 33 mark LTC was up over 700% this year. At its peak it was at 2300%. And right now it is up over 1200%.
Komen:
BTC 4hr MACD setting up to turn bearish; while LTC 4hr MACD is setting up to turn bullish. Something may happen soon.
Komen:
Komen:
Bot is still at it again. We have some potentially mega bullish news coming out soon from lightening labs. twitter.com/joaodeal...s/918846409285173248
Komen:
We are still riding down the red fan. We should break the red fan once we have found support. Which is very likely around the 52-54 range. Soon after breaking the red fan we may move up very quickly as we have many other times before; if we don't move up after breaking the red fan. It'll tell us that support is confirmed and that we'll trade sideways until we wait for the next major move. Which could take anywhere from a day to a week after breaking the red fan. Listed below are other Gan Fans I have posted; click play on the idea to see what I mean regarding the fans.


Komen:
Seriously though once we break the red fan it'll become bullish. Patience!
Komen:
Price has almost bottomed out.
Komen:
Here we go !
Komen:
We have very likely confirmed support at 52.
Komen:
Basically explains what has been happening.
Komen:
12hr chart is almost ready for upward movement.
Komen:
Hurr we go!
Komen:
Upside should not stop for a while if we have a 12hr candle that closes above 73-74 we can go for a new all time high.
12hr chart MACD setting up to turn bullish.
12hr chart MACD setting up to turn bullish.
Komen:
We broke the red fan, after riding it down. This tells us we have support at 52 and sub 52. Which means we'll trade sideways until major move up begins (that is if it does not begin in the next 12-24hrs).
Litecoin strong! As mentioned earlier in the day the chart is back to conditions it was at before the jump to 90s and before when China left the market. So strap on your big boy pants peeeps! It maybe a rocky start to shake last of the dead weak hands; but the upward trend is real!
Litecoin strong! As mentioned earlier in the day the chart is back to conditions it was at before the jump to 90s and before when China left the market. So strap on your big boy pants peeeps! It maybe a rocky start to shake last of the dead weak hands; but the upward trend is real!
Komen:
It has been almost 3 days since the red fan was broken. As I have mentioned before it could take anywhere from 1-7 days for a move to happen after breaking the fan. The current sideways action we are seeing is evident accumulation; indicating a move is due soon.
As mentioned before breaking the red fan confirmed that we have support at 52 and sub 52. Also FUDers are showing up as they generally do before a rally, to shake the weak hands. All we do now is wait until accumulation is complete.
Stoch RSI has cooled, and MACD is setting up to turn bullish on the day chart.
Notice how the support this time round is at higher levels than before.
This means we can definitely go much higher than 90s when the big rally starts.
As mentioned before breaking the red fan confirmed that we have support at 52 and sub 52. Also FUDers are showing up as they generally do before a rally, to shake the weak hands. All we do now is wait until accumulation is complete.
Stoch RSI has cooled, and MACD is setting up to turn bullish on the day chart.
Notice how the support this time round is at higher levels than before.
Komen:
Also got my appendix removed. That is why there hasn't been updates the past few days. And no the hospital does not accept payment in Bitcoin or Litecoin. twitter.com/ChartsCr...s/923319803460407296
Komen:
It is also worth mentioning that BBands are slowly tightening up on the day chart which is another signal that a move coming.
Komen:
We have some real cucks spreading misinformation and FUD on reddit. As usual do not believe everything you read on reddit, and check user post history to identify the truth from the noise.
Komen:
Yep. This is clear accumulation we should move up in due time.
Komen:
On Balance Volume confirms accumulation trend.
Komen:
Stoch RSI and MACD on the day chart are setting up to turn bullish. Which is another signal for upward movement. BBands are tightening up as well. PSAR may flip after MACD and Stoch RSI turn bullish.
Komen:
It has been 4 days 2 hrs since we broke the red fan which confirmed support at 52 and sub 52. It is very likely for us to see movement as Monday approaches.
Komen:
Also worth noting that the 4hr chart BBands are tight and MACD is bullish. If we flip PSAR bullish on the 4hr chart it could be the start of the rally. When the SMMA 12 (yellow) passes the SMMA 24 (white) things should start moving.
Komen:
Soon.
Komen:
We have an awesome set up developing on the day chart. MACD and PSAR setting up to turn bullish; BBands tightening up.
Stoch RSI and RSI are ready.
www.tradingview.com/chart/0cXibJQZ/
On Balance Volume indicating accumulation. Accumulation is evident when price trends down but OBV trends up.
Day chart is looking very healthy.
Stoch RSI and RSI are ready.
www.tradingview.com/chart/0cXibJQZ/
On Balance Volume indicating accumulation. Accumulation is evident when price trends down but OBV trends up.
Day chart is looking very healthy.
Komen:
Fixed. Stoch RSI and RSI url.
Komen:
Also Stoch RSI is almost ready on the LTCBTC week chart. Meaning ratio should move up.
Komen:
Chart is too good to be bear right now. The bears will become murdered soon.
Komen:
We have legs for 4-15 days upward movement before coming down. If not longer.
Komen:
Breaking 69-74 means we can try 79-84 breaking 84 means we can try 93 breaking 96 means we can go for a new all time high. If we don't get to an all time high in November we should in December.
Komen:
The time might not be 10 days but it may play out similarly. MACD is showing similarity. BTC and LTC reach an all time high simultaneously before dipping at the same time? Could happen. Too soon to tell. Just an idea.
Komen:
12 hr PSAR now bullish.
Komen:
Stoch RSI is trending up on the day chart. MACD and PSAR are still setting up to turn bullish.
Komen:
Nothing to do but wait. Pretty sure the LTC. Subreddits is bipolar with all the back and worth nonsense and dumb speculation being spread around. Chart is still good. 10/31st is almost here lets see how the China exchange closing plays out.
Komen:
2hr chart is setting up for more upward movement. (MACD + PSAR setting up to turn bullish) BBands tightening up.
Komen:
The day chart is still good.
MACD and PSAR setting up to turn bullish, and BBands are tightening up (meaning a move is coming)
Komen:
OBV still trending up. When OBV trends up but price trends downward or sideways it means accumulation is going.
The amount of noise and doubt being spread is absolutely retarded. LTC under 100 is cheap to me because once it breaks 100 it can easily reach 150 before coming down; as many other traders agree.
Komen:
3 Day chart is bullish. Stoch RSI and RSI are moving up again.
Komen:
Total LTC bought and sold every 5 dollars up. We have about 1-2 million LTC left to accumulate between 50 and 55 before accumulation is complete.
On Balance Still Trending up meaning accumulation is still occurring agreeing with the volume price profile above.
Nothing to but wait. Once accumulation is complete we will move up! Also Litecoin and Bitcoin are inverse of each other relative to the dollar. Meaning BTC has likely peaked, and that LTC has likely found bottom; ultimately meaning that the LTCUSD/BTCUSD ratio should improve soon.
Komen:
Note the number of LTC needed to be accumulated is probably less than a million. It seems like a million on the volume price profile because of its scale since it provides an aggregate between 5 dollar ranges. But it is probably less. For example if we reduce the ranges from 5 dollars to 2.5 dollars this is what it looks like.
Komen:
Patience will pay. The % returns on crypto is much greater than in any market. And market cycles are much faster (about 7x faster than traditional markets); adoption is only going to increase with time. By Q4 of 2018 I would not be surprised if 1 litecoin is worth between 300 to 600 USD.
Komen:
Accumulation is likely complete since the buy and sell volume are equal in the 50-55 range.
MACD looking great on the day chart.
MACD looking great on the day chart.
Komen:
Stoch RSI and RSI trending up.
OBV still trending up.
Komen:
Speculate away! XD.
Komen:
BTC Might be doing a double top.
Komen:
LTC and BTC are inverses of each other on the 1hr chart.
Komen:
Komen:
Komen:
One with 2019 prices.
Komen:
I made this to keep track of long term targets.

Komen:
LTC is setting up to turn PSAR bullish, while BTC is setting up to turn PSAR bearish.
Komen:
Day chart is looking good.
Komen:
PSAR now bearish for BTC. LTC is still setting up to flip PSAR bullish.

Komen:
PSAR now bearish for BTC. LTC is still setting up to flip PSAR bullish.*
BTC dip/correction starting. 4500 - 5000 is likely where it finishes correcting.
Click the chart below to go to BTC trends.
*fixed the chart url.
Click the chart below to go to BTC trends.

*fixed the chart url.
Komen:
MACD turning bullish for LTC; while it is turning bearish for BTC on the day chart.
Komen:
A total another million LTC accumulated between 50-55 since the last time I posted volume profile.
OBV still trending up. MACD setting up for bullish crossover, BBands tight, PSAR setting up to turn bullish. All these are bullish signs that the next few rallys are going to be yhuge.
Komen:
edit: meant to write: A total of another million LTC has been accumulated between 50-55 since the last time I posted volume profile.
Komen:
Patience.
Komen:
Fibs.
Komen:
The 3 day chart looks good!
Komen:
All fib based resistance levels.
Komen:
Hur we go!
Komen:
3 Day chart has legs to run for a good period of time.
Komen:
PSAR on the day chart very close to flipping bullish on GDAX.
Already bullish on other exchanges.
Komen:
This will be one hell of a rally. So much accumulation occurred.
Komen:
For pull backs use the fib levels as support.
Komen:
Breaking 62-64 range allows for 71-76 to be hit. Breaking 78-82 allows for 93-95 to be hit. Breaking 101-108 allows for 112-114 to be hit. Breaking 124-130 allows for 141-154 to be hit. Breaking 170 makes us go to 198. Based on fibs.
Click the chart below to go to fib chart.
Click the chart below to go to fib chart.

Komen:
PSAR now bullish on the day chart.
Komen:
First fib range (62-64) hit!
Komen:
Breaking and staying above 64 makes it possible to hit the next range at 68-72.
Komen:
This chart has the big trends overlaid with the fibs. The teal line lined up perfectly with the 62-64 range of resistance from fibs. Meaning getting above the teal line will allow for a new ATH. Since it would mean morebulls are entering the market.

Komen:
The week chart is looking very good. MACD and Stoch are setting up to turn bullish meaning green weeks ahead will be likely (meaning weeks will close at higher prices).
Komen:
This is just the beginning! fyi.
Komen:
Once we pass 64 next resistance zone will be between 69 and 72.
Komen:
The resistance zone after 69-72 will be 76-78
Komen:
Patience! We have strong legs to rally on.
Komen:
Komen:
For the record it only took 2 weeks after breaking red fan which confirmed support at the 50s for us to begin the moves up. That is 2 weeks of accumulation. I guess the 2 weeks meme is real. xd.
Komen:
15min chart setting up.
Komen:
Steady....
Komen:
Teal line hit! Now we just have to get on top of it and stay above it to confirm all time high moves.
Komen:
It's coming. Hodl!
Komen:
Charts are fun to watch.
Komen:
Getting closer and closer to flipping that 15min PSAR bullish.
Komen:
Sooooo close
Komen:
There is that flip!
Komen:
Next we will flip PASR on the 30 min chart bullish. It may take some hours.
Komen:
For the candles to fill up and ready.
Komen:
PSAR at 66.77 on the 30 min chart at the time of this post.
Komen:
The week and the 3 day charts look good.
Komen:
MACD and PSAR are almost there on the 30min chart.
Bullish MACD crossover is trying to occur on the 15min chart.
Bullish MACD crossover is trying to occur on the 15min chart.
Komen:
We should be in the clear when Stoch, MACD, and PSAR turn bullish on the 1hr chart.
Komen:
Komen:
Komen:
Dammit. I should not have gone to bed. smh. BTC took us down with her. The ratio seems stable though which is a good sign. I am going to hold through the dip, even though Stoch RSI is trending down on the day chart meaning we could have more downward movement. I am not too worried about movements like these; pretty confident that these are hybrid shakedowns. We made it this far.
Komen:
Still updating Bitcoin stuff here.
Komen:
1HR Chart
Komen:
4HR Chart
Komen:
The possible Cup and Handle on the 4hr chart /u/jreddit83 mentioned.
Komen:
The 3 day charts still looking good.
Komen:
Komen:
Patience folks.
Komen:
If the cup and handle plays out. PSAR should flip bullish on the 4hr chart.
Do check out:

Komen:
Komen:
Komen:
Komen:
LTC/BTC and LTC/USD Bullish. BTC/USD Bearish.
Komen:
PSAR now bullish on 4hr chart.
Komen:
We are going up at the expense of BTC. LOL.
Komen:
That cup is actually filling nicely.
Komen:
I mean handle.
Komen:
Komen:
I've been told by a few Koreans that the next coin they will pump is ETH and then LTC. Let us see how it plays out.
Komen:
Komen:
Komen:
Day chart
Week chart
Both looking very similar.
Komen:
OBV still trending up.
Komen:
Cup and Handle becoming more pronounced on the day chart?
This is why I don't trade based off that pattern. B/c it is vague; however I am still keeping an open mind about it.
Komen:
LTC literally has the healthiest day chart in crypto. From a Wall St day trader perspective this has all the signs of a bullish chart in the long run.
Komen:
Komen:
Komen:
Rally's happen near new moons. xd. Cloud break times with it as well. MACD doing jukey stuff.
Komen:
It's coming. Patience. Stoch RSI trending up again.
Komen:
It is not a matter of if, it is a matter of when. Breaking the teal line confirms move to ATHS. The wicks on the 3 day chart look mighty bullish.
My target for the big rally is between 110-150 range as mentioned previously.
Komen:
Based on growth LTC reaching four digits within 2ish years is very likely.
Komen:
Day chart.
Komen:
Komen:
Going AFK for a day or two. I should be back before the rally begins. Probably. The longer the rally is delayed the stronger it will be.
Komen:
lol. It would start as I was away. Use this chart for shorting on the way up. Fib at 72 was hit like a boss.

Komen:
Hodl!
Komen:
The ratio.
Komen:
The dollar.
Komen:
The euro.
Komen:
I have a feeling the whole market is going to up. At least that is what the week chart says. It will go up relative to the USD.
Komen:
So far so good.
Komen:
Would not be surprised if we do one of these.
Komen:
Komen:
Thinking it'll go to 82 come down to 74-77 range, and then push to 94 before coming down to 84-87 range, and then going for a new ATH at 110-150 range.
Komen:
Remember that we said that breaking teal line or staying above the teal line makes us bullish. So far we are just hanging out around the teal line. Currently consolidating near the teal line before going to test the white line at 82.60
Komen:
1hr chart.
Komen:
Komen:
Komen:
Komen:
Can we flip that PSAR bullish? hmm....
Komen:
Getting closer, and closer. MACD is on our side
Komen:
Komen:
Will it happen? hmm...
Komen:
And it has flipped.
'
As burg28 pointed out the EUR pair preceded the USD pair.
As burg28 pointed out the EUR pair preceded the USD pair.
Komen:
Komen:
Komen:
The leg to 82 starting.
Komen:
Komen:
Yo guys I made this site to look at the full picture. Very basic at the moment. I'll be updating randomly.
cryptocharts.github.io
cryptocharts.github.io
Komen:
That cup and handle though.
Komen:
Still on top of teal line. :D Bulls are in charge; watch out for fake sell walls. Also long term target Q4 of 2018 is not 400-600+ range.
Komen:
Also long term target Q4 of 2018 is now 400-600+ range.
Komen:
Relevant. At this rate we are going to need more space suits.
Komen:
The month chart has all the characteristics of bull mode.
Komen:
Komen:
Komen:
Can we flip the 3 Day SAR? Hmmm..........
Komen:
Komen:
Komen:
Still above teal line bulls are in control. Lots of exchanging of hands between bears and bulls during the consolidation period.
Komen:
Komen:
Komen:
OBV trend still bullish. :D
Komen:
Moved here:

Komen: