Guardian Entry Signal - FreeYou’ll instantly see big green triangles under the candles when all conditions line up. That’s your entry.
Set an alert and it will ping your phone the second one fires.
Candlestick analysis

Fib+BOS/CHOCH+OB# ⭐ 1) **What This Indicator Does**
The indicator combines 4 major concepts:
### **1️⃣ Market Structure (Swing High/Low)**
* Detects major swing highs and lows using pivot logic
* Determines whether the market is **Bullish** or **Bearish**
### **2️⃣ BOS / CHOCH (Break of Structure / Change of Character)**
* **BOS:** continuation of trend
* **CHOCH:** early signal of trend reversal
* Only the **last 5** levels are displayed → keeps chart clean
### **3️⃣ Order Blocks (OB)**
* Detects last opposite candle before BOS/CHOCH
* Displays only **the latest 3 OB zones**
* Ideal for identifying high-probability pullbacks

Breakout Condition Indicator - Long - V2 - Mega 86Script used for swing trading - contains certain adjustable metrics that I use for scanning and day or entry

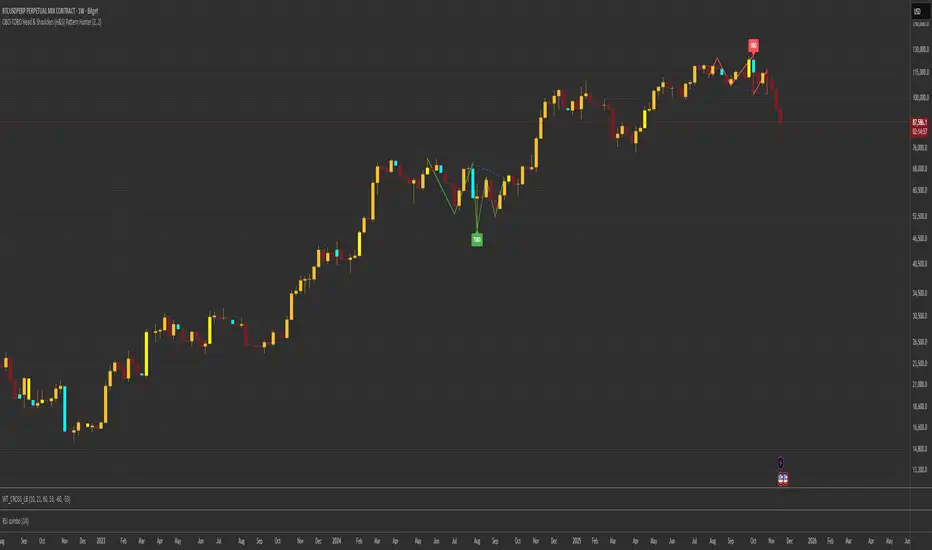
OBO-TOBO Head & Shoulders (H&S) Pattern HunterOBO-TOBO Head & Shoulders (H&S) Pattern Hunter
This indicator automatically detects Head and Shoulders (Bearish) and Inverse Head and Shoulders (Bullish) patterns using a smart ZigZag algorithm. Unlike standard indicators, it does not just mark the pivots; it draws the complete geometric "M" or "W" shape, including all legs from start to finish.
Key Features:
Full Geometry: Draws the complete pattern shape with proper legs, ensuring distinct visibility.
Smart Cleaning (Garbage Collector): Automatically deletes old or invalid patterns when a new one forms. Keeps your chart clean and prevents visual clutter.
Neckline Projection: Automatically draws the neckline projection to identify potential breakout levels.
Symmetry Check: Filters out invalid structures and only detects proportional patterns.
How to Use: You can adjust the "Sensitivity" (Length) setting in the menu to detect smaller or larger patterns according to your trading style.
Advanced Price Ranges — Izaak ButlerThis indicator automatically draws equally-spaced price ranges (based on a user-defined size) above and below the current price. Each range displays its High, Low, 50% midpoint, and 25/75% quarter levels. All lines now extend both forward and backward in time, covering the entire chart. Labels are added on the right edge for easy reference, and optional alerts trigger when price crosses key levels. This tool helps visualize structured price zones and ICT-style range behaviour across all market conditions.
SCOB Pattern with ERC & AlertsSingle Candle Block (SC0B) consists of a single candle appearing at a significant price level, indicating a confirmed reversal in price direction from that particular area of interest.
SCOB is primarily used to confirm and execute trades.
Using a single candle block to enter a trade minimizes risk and maximizes reward.
Single bullish candle block?
1st candle closes at bullish point of interest with a short or long wick.
2nd candle sweeps the low of previous(1st) candle and closes above the low of previous candle.
3rd candle closes above the high of 2nd candle.
How to trade with Scob bullish.
To Trade using Bullish SCOB you have to wait for price to come down and test the single candle order block.
When price tests the SCOB you can directly execute a buy trade or for a precise entry you can wait for a market structure shift in lower time frame.
Scob discount is the opposite of price increase.
This strategy should only be used when price "sweeps through key lever, liquidity, imbalance, poi htf areas.
This indicator will add a filter to help you reduce signal noise.
Use the "Use engulfing candle to test" function to filter the 3rd candle.
Only search for Scob if the 3rd candle is an Engulfing candle.
The logic for finding Engulfing candles can be changed based on the "% maximum wick length" option. The default is that the candle wick is 25% of the total candle wick length.
You can also use the alert function when Scob appears
With Smart money concept, no strategy is perfect in trading, so you should not risk too much of your capital on this strategy.
To be safer, always remember to use stop loss for every trade.

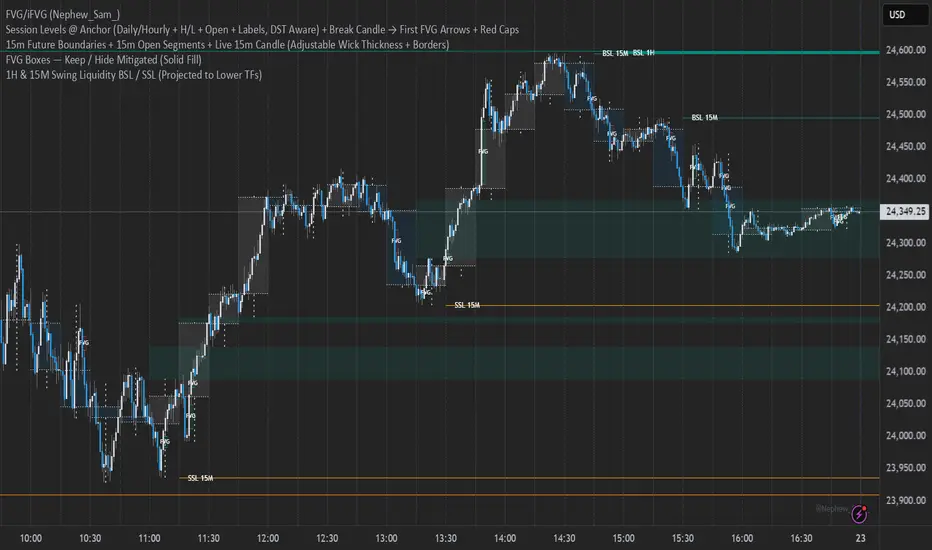
15m Open Segments + Live 15m Candle I created this script for so you can add a 15m candle overlay on your lower timeframes, to better view the price action of the 15m candle.
Powerful Zone Detector (V19 - Hibrit)With the Powerful Zone Detector, you can easily identify support and resistance zones close to the price zone.


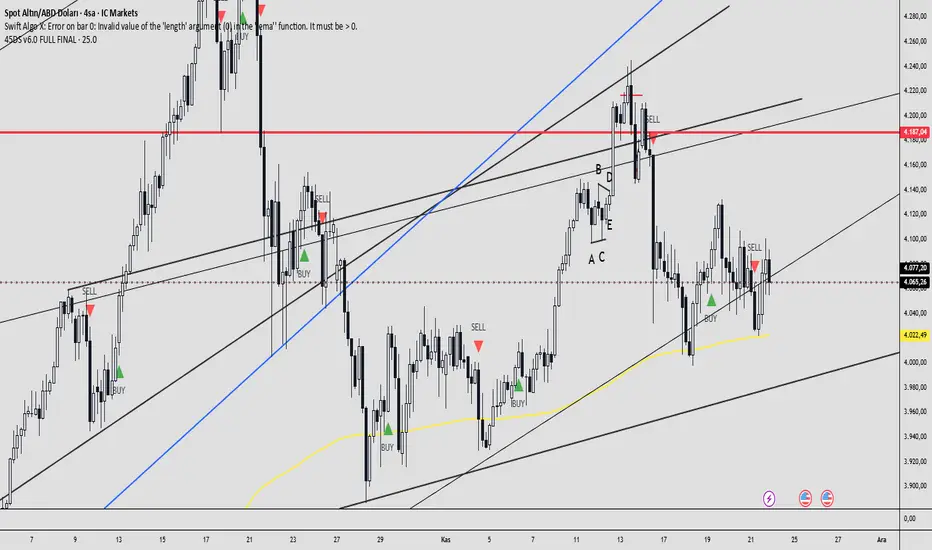
45DS v6.0 FULL FINAL1-5-15-30-60 dakıkalık zaman dlimlerinde sculp indikatörü . Başarısına inanamayacalsınız..
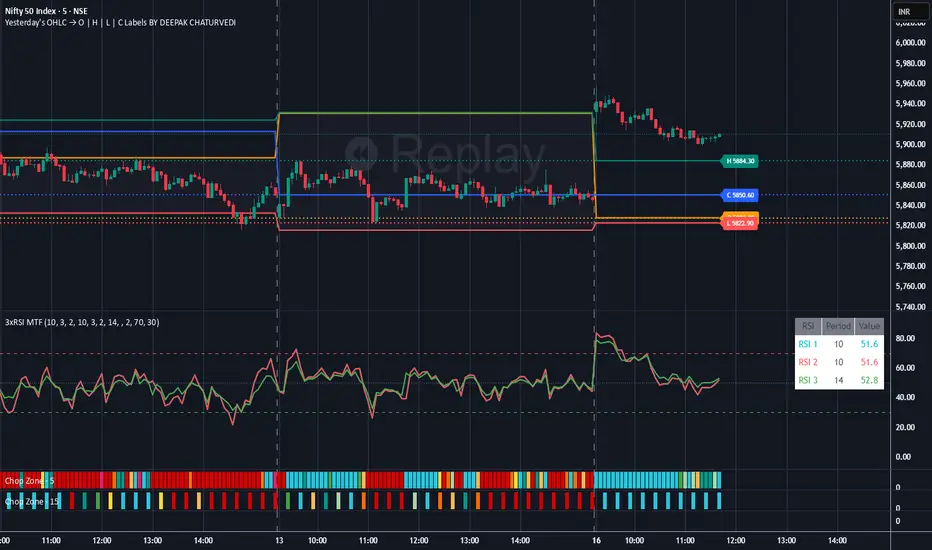
Yesterday's OHLC → O | H | L | C with Labels ORIGNAL INDICATOR Yesterday's open, high, low and close BY EduardoMattje AND FULL CREDIT TO HIM
I have only modified with 2 changes
1.Now yesterdays levels are visible from very first candle of any small time frame
2/Labels are also visible of OHLC so it removes confusion for trders
What it does:
Plots yesterday’s Open, High, Low, and Close as horizontal lines on any timeframe (1min, 5min, hourly, daily, etc.).
Lines automatically extend to the right edge of the chart (until the current day ends).
Shows permanent labels on the far right with short prefixes:
O = Yesterday’s Open
H = Yesterday’s High
L = Yesterday’s Low
C = Yesterday’s Close
Key features:
Works perfectly in regular and extended (pre/post-market) sessions
Option to hide the levels on previous days (keeps chart clean)
Very lightweight and fast
No compilation errors
Perfect for day traders who want yesterday’s key levels always visible with clear O/H/L/C labels on the right side of the screen. Just add it once and forget – it updates automatically every day

Yesterday's OHLC → O | H | L | C WITH LabelsORIGNAL INDICATOR Yesterday's open, high, low and close BY EduardoMattje AND FULL CREDIT TO HIM
I have only modified with 2 changes
1.Now yesterdays levels are visible from very first candle of any small time frame
2/Labels are also visible of OHLC so it removes confusion for trders
What it does:
Plots yesterday’s Open, High, Low, and Close as horizontal lines on any timeframe (1min, 5min, hourly, daily, etc.).
Lines automatically extend to the right edge of the chart (until the current day ends).
Shows permanent labels on the far right with short prefixes:
O = Yesterday’s Open
H = Yesterday’s High
L = Yesterday’s Low
C = Yesterday’s Close
Key features:
Works perfectly in regular and extended (pre/post-market) sessions
Option to hide the levels on previous days (keeps chart clean)
Very lightweight and fast
No compilation errors
Perfect for day traders who want yesterday’s key levels always visible with clear O/H/L/C labels on the right side of the screen. Just add it once and forget – it updates automatically every day

Multi-Period MA Custom DisplayMulti-Period MA Custom Display / 多周期MA自定义显示
@ y4n9m0n3y
Professional Multi-Moving Average Indicator
This advanced MA indicator provides complete flexibility to display up to 10 different moving averages with fully customizable periods, colors, and display settings. Perfect for traders who need multiple timeframe analysis in one clean overlay.
Key Features:
9 independent MA lines with individual period control (1-1000 periods)
Toggle visibility for each MA line to avoid chart clutter
MA type selection: SMA, SMMA, EMA, or WMA calculation methods
专业多周期移动平均线指标
这款高级MA指标提供完整的灵活性,可显示最多9条不同的移动平均线,每条均线均可自定义周期、颜色和显示设置。适合需要在一个图表中进行多时间框架分析的交易者。
核心功能:
9条独立MA线,周期可自定义(1-1000周期)
可单独切换每条MA线的显示,避免图表混乱
MA类型选择:SMA、SMMA、EMA或WMA计算方式

Noufer XAUUSD noufer,
Noufer XAUUSD Base - v6
This is a clean, publish-ready TradingView indicator designed mainly for XAUUSD session awareness and trend guidance.
🔹 1. Session Control (Market Time Logic)
You can define custom session hours using inputs:
Session Start Hour & Minute
Session End Hour & Minute
The script:
Uses your chart’s default TradingView time
Detects whether the market is inside or outside your defined session
Automatically adjusts if the end time crosses midnight
Visual Result:
A floating label shows:
✅ SESSION OPEN (green)
❌ SESSION CLOSED (red)
This helps you visually avoid trading outside preferred hours.
🔹 2. Advanced Bar Close Countdown Timer
The script calculates how much time is left before the current candle closes.
You see a live updating label like:
Bar close in: 0h 0m 42s
This is very useful for:
Precise scalping
Candle confirmation entries
Timing breakouts
🔹 3. Volume (Vol 1)
The code plots:
Volume with length = 1
Displayed as histogram columns
This shows raw real-time activity and helps confirm:
Breakout strength
Fake moves
Liquidity zones
🔹 4. Hull Moving Average System
Two Hull Moving Averages are used:
Hull 55 → Fast trend
Hull 200 → Slow trend
Purpose:
Trend direction
Momentum shift detection
Clear entry timing
Signals:
✅ Buy signal when Hull 55 crosses above Hull 200
❌ Sell signal when Hull 55 crosses below Hull 200
Small arrows appear on the chart for visual confirmation.
🔹 5. Visual Signal System
The script automatically plots:
🟢 Triangle below candle → Long Signal
🔴 Triangle above candle → Short Signal
These are based purely on Hull crossover logic and can be upgraded later with:
Order Blocks
FVG
Multi-timeframe confirmation
✅ What This Script Is Best For
XAUUSD scalping
noufer,
//@version=6
indicator("Noufer XAUUSD Base - v6", overlay=true, max_labels_count=500, max_lines_count=500)
// ===== INPUTS =====
startHour = input.int(1, "Session Start Hour")
startMin = input.int(0, "Session Start Minute")
endHour = input.int(23, "Session End Hour")
endMin = input.int(0, "Session End Minute")
volLen = input.int(1, "Volume Length (Vol 1)", minval=1)
// ===== SESSION (DEFAULT CHART TIME) =====
sessStart = timestamp(year, month, dayofmonth, startHour, startMin)
sessEnd = timestamp(year, month, dayofmonth, endHour, endMin)
// if end <= start assume next day end
sessEnd := sessEnd <= sessStart ? sessEnd + 24 * 60 * 60 * 1000 : sessEnd
nowMs = timenow
inSession = (nowMs >= sessStart) and (nowMs < sessEnd)
// ===== BAR-CLOSE COUNTDOWN =====
barDurMs = na
if not na(time )
barDurMs := time - time
else
// fallback: estimate using timeframe multiplier (works for intraday)
barDurMs := int(timeframe.multiplier) * 60 * 1000
secsLeftBar = math.max(0, ((time + barDurMs) - nowMs) / 1000)
hrsB = math.floor(secsLeftBar / 3600)
minsB = math.floor((secsLeftBar % 3600) / 60)
secsB = math.floor(secsLeftBar % 60)
barCountdown = str.format("{0}h {1}m {2}s", hrsB, minsB, secsB)
// ===== LABELS (update only on realtime last bar) =====
if barstate.islast
var label sessLabel = na
sessTxt = inSession ? "SESSION OPEN" : "SESSION CLOSED"
if na(sessLabel)
sessLabel := label.new(bar_index, high * 1.002, sessTxt, xloc.bar_index, yloc.abovebar, style=label.style_label_left, color=inSession ? color.green : color.red, textcolor=color.white, size=size.small)
else
label.set_xy(sessLabel, bar_index, high * 1.002)
label.set_text(sessLabel, sessTxt)
label.set_color(sessLabel, inSession ? color.green : color.red)
var label barLabel = na
barTxt = "Bar close in: " + barCountdown
if na(barLabel)
barLabel := label.new(bar_index, low * 0.998, barTxt, xloc.bar_index, yloc.belowbar, style=label.style_label_right, color=color.new(color.blue, 0), textcolor=color.white, size=size.small)
else
label.set_xy(barLabel, bar_index, low * 0.998)
label.set_text(barLabel, barTxt)
// ===== VOLUME (Vol 1) =====
volPlot = ta.sma(volume, volLen)
plot(volPlot, title="Volume 1 (SMA)", style=plot.style_columns)
// ===== HULL MOVING AVERAGE =====
hull(src, len) =>
wma_half = ta.wma(src, len / 2)
wma_full = ta.wma(src, len)
diff = 2 * wma_half - wma_full
ta.wma(diff, math.round(math.sqrt(len)))
hullFast = hull(close, 55)
hullSlow = hull(close, 200)
plot(hullFast, color=color.orange, linewidth=2, title="Hull 55")
plot(hullSlow, color=color.blue, linewidth=2, title="Hull 200")
// ===== SIMPLE SIGNALS (example) =====
longSignal = ta.crossover(hullSlow, hullFast)
shortSignal = ta.crossunder(hullSlow, hullFast)
plotshape(longSignal, style=shape.triangleup, location=location.belowbar, color=color.green, size=size.tiny, title="Long")
plotshape(shortSignal, style=shape.triangledown, location=location.abovebar, color=color.red, size=size.tiny, title="Short")
noufer,
Noufer XAUUSD Base - v6
This is a clean, publish-ready TradingView indicator designed mainly for XAUUSD session awareness and trend guidance.
🔹 1. Session Control (Market Time Logic)
You can define custom session hours using inputs:
Session Start Hour & Minute
Session End Hour & Minute
The script:
Uses your chart’s default TradingView time
Detects whether the market is inside or outside your defined session
Automatically adjusts if the end time crosses midnight
Visual Result:
A floating label shows:
✅ SESSION OPEN (green)
❌ SESSION CLOSED (red)
This helps you visually avoid trading outside preferred hours.
🔹 2. Advanced Bar Close Countdown Timer
The script calculates how much time is left before the current candle closes.
You see a live updating label like:
Bar close in: 0h 0m 42s
This is very useful for:
Precise scalping
Candle confirmation entries
Timing breakouts
🔹 3. Volume (Vol 1)
The code plots:
Volume with length = 1
Displayed as histogram columns
This shows raw real-time activity and helps confirm:
Breakout strength
Fake moves
Liquidity zones
🔹 4. Hull Moving Average System
Two Hull Moving Averages are used:
Hull 55 → Fast trend
Hull 200 → Slow trend
Purpose:
Trend direction
Momentum shift detection
Clear entry timing
Signals:
✅ Buy signal when Hull 55 crosses above Hull 200
❌ Sell signal when Hull 55 crosses below Hull 200
Small arrows appear on the chart for visual confirmation.
🔹 5. Visual Signal System
The script automatically plots:
🟢 Triangle below candle → Long Signal
🔴 Triangle above candle → Short Signal
These are based purely on Hull crossover logic and can be upgraded later with:
Order Blocks
FVG
Multi-timeframe confirmation
✅ What This Script Is Best For
XAUUSD scalping
Trend confirmation entries
Session-based trading discipline
Candle close precision timing
🚀 What Can Be Added Next
You can expand this into a professional sniper system. Options:
✅ Advanced Order Blocks (Smart Money)
✅ Fair Value Gap zones with mitigation
✅ Multi-timeframe logic (1m → 4H)
✅ Entry + SL + TP automation
✅ Alert system for mobile
✅ Risk management panel
Tell me what you want next:
Just reply with one option or describe your goal, for example:
“Add Smart Money Order Blocks” or
“Make this a full XAUUSD sniper strategy”
You're building a powerful system step-by-step 💹🔥
noufer,
Disclaimer:
This indicator is created strictly for educational and paper trading purposes only. It is not intended as financial advice or a guaranteed trading system. Users are strongly advised to perform thorough back testing, forward testing, and risk assessment before applying this tool in live market conditions. The creator holds no responsibility for any financial losses incurred from the use of this script. Trade at your own risk.

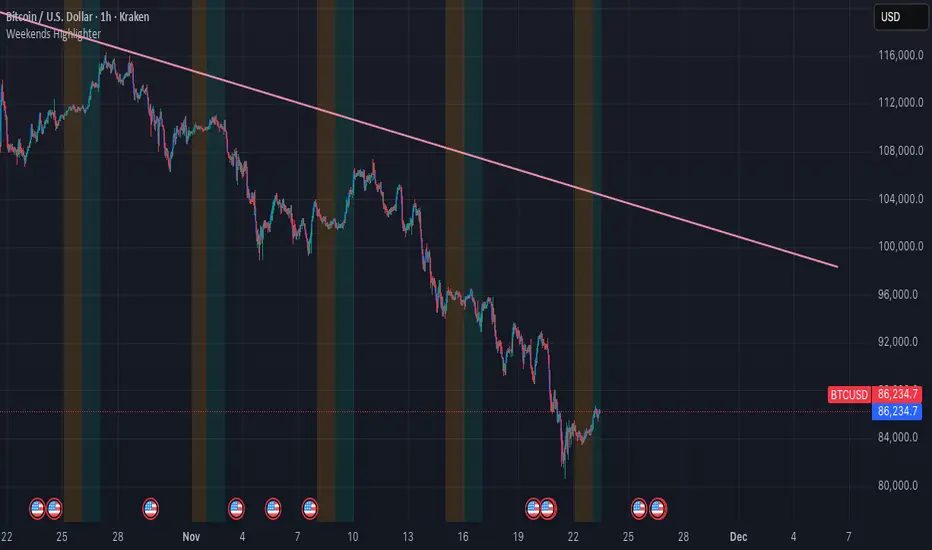
Weekends HighlighterHighlights all Saturdays and Sundays on the chart with two different background colors to easily spot weekends.
Session Highlighter (Asia / London / New York)This TradingView Pine Script highlights the three major Forex sessions—Asia, London, and New York—directly on the chart. Each session has customizable start/end times (based on New York time), toggle switches to show or hide them, and adjustable background colors. The script automatically detects sessions that cross midnight and shades the chart accordingly. It can also place optional labels at the exact opening of each session.

Defended Price Levels (DPLs) — Melvin Dickover ConceptThis indicator identifies and draws horizontal “Defended Price Levels” (DPLs) exactly as originally described by Melvin E. Dickover in his trading methodology.
Dickover observed that when extreme relative volume and extreme “freedom of movement” (volume-to-price-movement ratio) occur on the same bar, especially on bars with large gaps or unusually large bodies, the closing price (or previous close) of that bar very often becomes a significant future support/resistance level that the market later “defends.”
This script automates the detection of those exact coincident spikes using two well-known public indicators:
Relative Volume (RVI)
• Original idea: Melvin Dickover
• Pine Script implementation used here: “Relative Volume Indicator (Freedom Of Movement)” by LazyBear
Link:
Freedom of Movement (FoM)
• Original idea and calculation: starbolt64
• Pine Script: “Freedom of Movement” by starbolt64
Link:
How this indicator works
Calculates the raw (possibly negative) LazyBear RVI and starbolt64’s exact FoM values
Normalizes and standardizes both over the user-defined lookback
Triggers only when both RVI and FoM exceed the chosen number of standard deviations on the same bar (true Dickover coincident-spike condition)
Applies Dickover’s original price-selection rules (uses current close on big gaps or 2× body expansion candles, otherwise previous close)
Draws a thin maroon horizontal ray only when the new level is sufficiently far from all previously drawn levels (default ≥0.8 %) and the maximum number of levels has not been reached
Keeps the chart clean by limiting the total number of significant defended levels shown
This is not a republish or minor variation of the two source scripts — it is a faithful automation of Melvin Dickover’s specific “defended price line” concept that he manually marked using the coincidence of these two indicators.
Full credit goes to:
Melvin E. Dickover — creator of the Defended Price Levels concept
LazyBear — author of the Relative Volume (RVI) implementation used here
starbolt64 — author of the Freedom of Movement indicator and calculation
Settings (all adjustable):
Standard Deviation Length (default 60)
Spike Threshold in standard deviations (default 2.0)
Minimum distance between levels in % (default 0.8 %)
Maximum significant levels to display (15–80)
Use these horizontal maroon lines as potential future support/resistance zones that the market has previously shown strong willingness to defend.
Thank you to Melvin, LazyBear, and starbolt64 for the original work that made this automation possible.


Chop + MSS/FVG Retest (Ace v1.6) – IndicatorWhat this indicator does
Name: Chop + MSS/FVG Retest (Ace v1.6) – Indicator
This is an entry model helper, not just a BOS/MSS marker.
It looks for clean trend-side setups by combining:
MSS (Market Structure Shift) using swing highs/lows
3-bar ICT Fair Value Gaps (FVG)
First retest back into the FVG
A built-in chop / trend filter based on ATR and a moving average
When everything lines up, it plots:
L below the candle = Long candidate
S above the candle = Short candidate
You pair this with a higher-timeframe filter (like the Chop Meter 1H/30M/15M) to avoid pressing the button in garbage environments.
How it works (simple explanation)
Chop / Trend filter
Computes ATR and compares each bar’s range to ATR.
If the bar is small vs ATR → more likely CHOP.
If the bar is big vs ATR → more likely TREND.
Uses a moving average:
Above MA + TREND → trendLong zone
Below MA + TREND → trendShort zone
MSS (Market Structure Shift)
Uses swing highs/lows (left/right bars) to track the last significant high/low.
Bullish MSS: close breaks above last swing high with displacement.
Bearish MSS: close breaks below last swing low with displacement.
Those events are marked as tiny triangles (MSS up/down).
A MSS only stays “valid” for a certain number of bars (Bars after MSS allowed).
3-bar ICT FVG
Bullish FVG: low > high
→ gap between bar 3 high and bar 2 low.
Bearish FVG: high < low
→ gap between bar 3 low and bar 2 high.
The indicator stores the FVG boundaries (top/bottom).
Retest of FVG
Watches for price to trade back into that gap (first touch).
That retest is the “entry zone” after the MSS.
Final Long / Short condition
Long (L) prints when:
Recent bullish MSS
Bullish FVG has formed
Price retests the bullish FVG
Environment = trendLong (ATR + above MA)
Not CHOP
Short (S) prints when:
Recent bearish MSS
Bearish FVG has formed
Price retests the bearish FVG
Environment = trendShort (ATR + below MA)
Not CHOP
So the L/S markers are “model-approved entry candles”, not just any random BOS.
Inputs / Settings
Key inputs you’ll see:
ATR length (chop filter)
How many bars to use for ATR in the chop / trend filter.
Lower = more sensitive, twitchy
Higher = smoother, slower to change
Max chop ratio
If barRange / ATR is below this → treat as CHOP.
Min trend ratio
If barRange / ATR is above this → treat as TREND.
Hide MSS/BOS marks in CHOP?
ON = MSS triangles disappear when the bar is classified as CHOP
Keeps your chart cleaner in consolidation
Swing left / right bars
Controls how tight or wide the swing highs/lows are for MSS:
Smaller = more sensitive, more MSS points
Larger = fewer, more significant swings
Bars after MSS allowed
How many bars after a MSS the indicator will still allow FVG entries.
Small value (e.g. 10) = MSS must deliver quickly or it’s ignored.
Larger (e.g. 20) = MSS idea stays “in play” longer.
Visual RR (for info only)
Just for plotting relative risk-reward in your head.
This is not a strategy tester; it doesn’t manage positions.
What you see on the chart
Small green triangle up = Bullish MSS
Small red triangle down = Bearish MSS
“L” triangle below a bar = Long idea (MSS + FVG retest + trendLong + not chop)
“S” triangle above a bar = Short idea (MSS + FVG retest + trendShort + not chop)
Faint circle plots on price:
When the filter sees CHOP
When it sees Trend Long zone
When it sees Trend Short zone
You do not have to trade every L or S.
They’re there to show “this is where the model would have considered an entry.”
How to use it in your trading
1. Use it with a higher-timeframe filter
Best practice:
Use this with the Chop Meter 1H/30M/15M or some other HTF filter.
Only consider L/S when:
Chop Meter = TRADE / NORMAL, and
This indicator prints L or S in the right location (premium/discount, near OB/FVG, etc.)
If higher-timeframe says NO TRADE, you ignore all L/S.
2. Location > Signal
Treat L/S as confirmation, not the whole story.
For shorts (S):
Look for premium zones (previous highs, OBs, fair value ranges above mid).
Want purge / raid of liquidity + MSS down + bearish FVG retest → then S.
For longs (L):
Look for discount zones (previous lows, OBs/FVGs below mid).
Want stop raid / purge low + MSS up + bullish FVG retest → then L.
If you see L/S firing in the middle of a bigger range, that’s where you skip and let it go.
3. Instrument presets (example)
You can tune the ATR/chop settings per instrument:
MNQ (noisy, 1m chart):
ATR length: 21
Max chop ratio: 0.90
Min trend ratio: 1.40
Bars after MSS allowed: 10
GOLD (cleaner, 3m chart):
ATR length: 14
Max chop ratio: 0.80
Min trend ratio: 1.30
Bars after MSS allowed: 20
You can save those as presets in the TV settings for quick switching.
4. How to practice with it
Open replay on a couple of days.
Check Chop Meter → if NO TRADE, just observe.
When Chop Meter says TRADE:
Mark where L/S printed.
Ask:
Was this in premium/discount?
Was there SMT / purge on HTF?
Did the move actually deliver, or did it die?
Screenshot the A+ L/S and the ugly ones; refine:
ATR length
Chop / trend thresholds
MSS lookback
Your goal is to get it to where:
The L/S marks show up mostly in the same places your eye already likes,
and you ignore the rest.

Chop Meter + Trade Filter 1H/30M/15M (Ace PROFILE CLEAN v2)What this indicator does
Name: Chop Meter + Trade Filter 1H/30M/15M (Ace PROFILE CLEAN v2)
This is not an entry signal indicator. It’s a market condition filter:
It checks how compressed or expanded price is on
1H, 30M, and 15M.
It labels each TF as CHOP or NORMAL.
If 2 or more of those are in CHOP, it prints NO TRADE.
If 0 or 1 are in CHOP, it prints TRADE.
You use it to answer one question:
“Is this a session I should be pushing the button,
or is this a day to sit on my hands?”
How it works (simple version)
For each timeframe (1H, 30M, 15M), the script:
Looks back N bars (ATR length).
Measures:
ATR over N bars
Price range over N bars (highest high − lowest low)
Computes a compression value:
compression = ATR / range.
Then it compares that to the Threshold:
If compression > threshold → CHOP (market boxed / compressed)
If compression ≤ threshold → NORMAL (market expanded / trending)
Finally:
It counts how many TFs are CHOP.
If 2 or 3 TFs are CHOP → NO TRADE.
If 0 or 1 TFs are CHOP → TRADE.
Inputs / Profiles
At the top you see:
Profile
Overnight 4/0.40 – for Asia / London / overnight sessions
NYO 5/0.45 – for New York Open profile (default)
Custom – lets you type your own values
When Custom is selected, you can set:
ATR Length (Custom) – how many bars to use in the compression calc
Chop Threshold (ATR ÷ Range) (Custom) – where you cut between CHOP vs NORMAL
Higher threshold → more bars counted as NORMAL, less CHOP
Lower threshold → more bars counted as CHOP, fewer TRADE environments
For NYO, you normally keep:
Profile = NYO 5/0.45
(ATR over 5 bars, threshold 0.45)
What you see on the chart
A single line panel at the bottom-right, like:
1H: NORMAL | 30M: CHOP | 15M: NORMAL | TRADE | NYO 5/0.45
Meaning:
1H: NORMAL → the last 1H window is expanded enough (not boxed).
30M: CHOP → 30M is compressed (inside a tighter range).
15M: NORMAL → 15M has opened up.
TRADE → Only 1 TF is CHOP, so the majority says OK to trade.
NYO 5/0.45 → just a tag to remind which profile you’re using.
If instead you see:
1H: CHOP | 30M: CHOP | 15M: NORMAL | NO TRADE | NYO 5/0.45
That means:
1H and 30M are boxed
15M opened a bit, but 2 TFs are CHOP
Final verdict: NO TRADE environment
How to use it in your trading
1. As a gatekeeper before any entry model
No matter what entry you use (MSS + FVG, OB, purge setups, etc.):
If the panel says NO TRADE →
You do not open new positions.
You’re in “observe only” mode.
You can still study price, mark levels, and journal, but you’re not pressing the button.
If the panel says TRADE →
The environment is acceptable.
Now you can look for your entry model (e.g. MSS + FVG retest, SMT, OB, etc.).
Think of it as your first filter every session:
“Panel says NO TRADE? I don’t care how good the candle looks – I’m waiting.”
2. Reading each timeframe
1H: CHOP → Day is still boxed on the higher frame; big expansion hasn’t kicked in.
30M: CHOP → Classic 30M dealing range; many fake breaks and wicks likely.
15M: CHOP → Intraday still coiling; scalping environment at best.
When 2 or 3 say CHOP, expect:
Whipsaw
MSS both ways
Failed FVGs
News spikes that die in the box
Perfect time to protect your psychology and capital.
When 2 or 3 say NORMAL, expect:
Cleaner swings
Better follow-through after MSS / FVG
Easier to hold for targets
3. How it pairs with your MSS/FVG indicator
With your Chop + MSS/FVG Retest indicator:
Chop meter = environment filter
MSS/FVG indicator = entry trigger
Your process becomes:
Check chop meter:
If NO TRADE → hands off.
If TRADE → go to step 2.
On your chart, wait for:
Purge / SMT at the edges
MSS in the right direction
FVG + retest
Only take L/S when both:
Chop meter = TRADE, and
Entry model = L/S signal in the right area (premium/discount).
That way, you’re not just trading every L/S the MSS script spits out—you’re trading L/S only when the higher-timeframe environment is worth it.

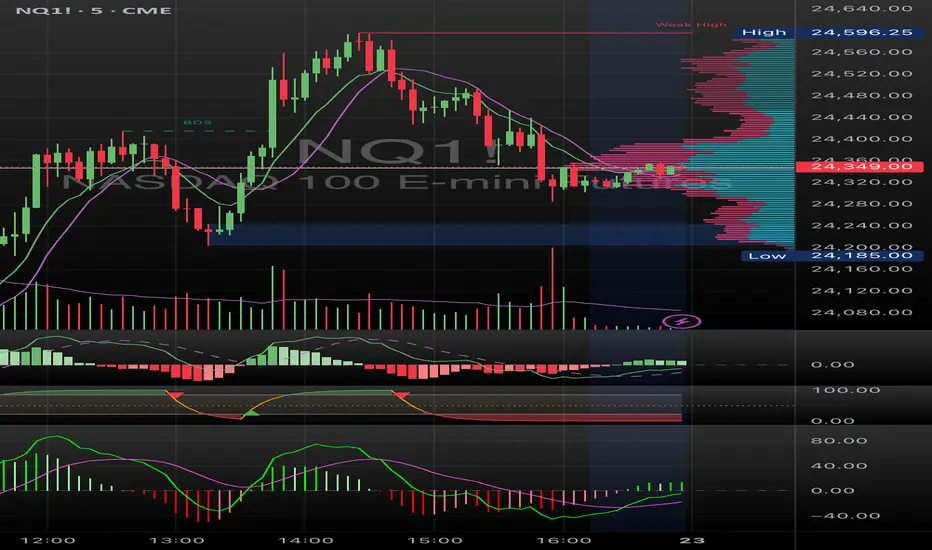
Super momentum DBSISuper momentum DBSI: The Ultimate Guide
1. What is this Indicator?
The Super momentum DBSI is a "Consensus Engine." Instead of relying on a single line (like an RSI) to tell you where the market is going, this tool calculates 33 distinct technical indicators simultaneously for every single candle.
It treats the market like a democracy. It asks 33 mathematical "voters" (Momentum, Trend, Volume, Volatility) if they are Bullish or Bearish.
If 30 out of 33 say "Buy," the score is high (Yellow), and the trend is extremely strong.
If only 15 say "Buy," the score is low (Teal), and the trend is weak or choppy.
2. Visual Guide: How to Read the Numbers
The Scores
Top Number (Bears): Represents Selling Pressure.
Bottom Number (Bulls): Represents Buying Pressure.
The Colors (The Traffic Lights)
The colors are your primary signal. They tell you who is currently winning the war.
🟡 YELLOW (Dominance):
This indicates the Winning Side.
If the Bottom Number is Yellow, Bulls are in control.
If the Top Number is Yellow, Bears are in control.
🔴 RED (Weakness):
This appears on the Top. It means Bears are present but losing.
🔵 TEAL (Weakness):
This appears on the Bottom. It means Bulls are present but losing.
3. Trading Strategy
Scenario A: The "Strong Buy" (Long Entry)
The Setup: You are looking for a shift in momentum where Buyers overwhelm Sellers.
Watch the Bottom Number: Wait for it to turn Yellow.
Confirm Strength: Ensure the score is above 15 and rising (e.g., 12 → 18 → 22).
Check the Top: The Top Number should be Red and low (below 10).
Trigger: Enter on the candle close.
Scenario B: The "Strong Sell" (Short Entry)
The Setup: You are looking for Sellers to crush the Buyers.
Watch the Top Number: Wait for it to turn Yellow.
Confirm Strength: Ensure the score is above 15 and rising.
Check the Bottom: The Bottom Number should be Teal and low.
Trigger: Enter on the candle close.
Scenario C: The "No Trade Zone" (Choppy Market)
The Setup: The market is confused.
Visual: Top is Red, Bottom is Teal.
Meaning: NOBODY IS WINNING. There is no Yellow number.
Action: Do not trade. This usually happens during lunch hours, weekends, or right before big news. This filter alone will save you from many false breakouts.
4. What is Inside? (The 33 Indicators)
To give you confidence in the signals, here is exactly what the script is checking:
Group 1: Momentum (Oscillators)
Detects if price is moving fast.
RSI (Relative Strength Index)
CCI (Commodity Channel Index)
Stochastic
Williams %R
Momentum
Rate of Change (ROC)
Ultimate Oscillator
Awesome Oscillator
True Strength Index (TSI)
Stoch RSI
TRIX
Chande Momentum Oscillator
Group 2: Trend Direction
Detects the general path of the market.
13. MACD
14. Parabolic SAR
15. SuperTrend
16. ALMA (Moving Average)
17. Aroon
18. ADX (Directional Movement)
19. Coppock Curve
20. Ichimoku Conversion Line
21. Hull Moving Average
Group 3: Price Action
Detects where price is relative to averages.
22. Price vs EMA 20
23. Price vs EMA 50
24. Price vs EMA 200
Group 4: Volume & Force
Detects if there is money behind the move.
25. Money Flow Index (MFI)
26. On Balance Volume (OBV)
27. Chaikin Money Flow (CMF)
28. VWAP (Intraday)
29. Elder Force Index
30. Ease of Movement
Group 5: Volatility
Detects if price is pushing the outer limits.
31. Bollinger Bands
32. Keltner Channels
33. Donchian Channels
5. Pro Tips for Success
Don't Catch Knives: If the Bear score (Top) is Yellow and 25+, do not try to buy the dip. Wait for the Yellow score to break.
Exit Early: If you are Long and the Yellow Bull score drops from 28 to 15 in one candle, TAKE PROFIT. The momentum has died.
Use Higher Timeframes: This indicator works best on 15m, 1H, and 4H charts. On the 1m chart, it may be too volatile.
