Momentum Candle by DNDFXMomentum Candle v2 is a simple yet powerful indicator designed to detect strong momentum candles based on candle body size and the ratio between the body and total wick.
This indicator is ideal for traders who focus on:
Momentum trading
Breakout strategies
XAUUSD (Gold) scalping
Supply & Demand / Smart Money Concepts (SMC) confirmation
🔧 How the Indicator Works
The indicator analyzes each candle and classifies it as a Bullish Momentum or Bearish Momentum candle when these conditions are met:
✅ The candle body exceeds the minimum size
✅ The total wick is smaller compared to the body
✅ The Body-to-Wick ratio meets the strength filter
Visual signals include:
Green background for bullish momentum
Red background for bearish momentum
Up/Down triangle markers as entry guidance
⚙️ Customizable Parameters
Min Body Size (Points) – Sets the minimum candle body size
Min Body : Wick Ratio – Controls how dominant the body is compared to the wicks
All parameters can be optimized according to your trading style and timeframe.
✅ Best Use Cases
This indicator is useful for:
Breakout confirmation
Momentum validation
Filtering false breakouts
Scalping and intraday trading on XAUUSD
🧠 Trading Tips
For better accuracy, combine this indicator with:
Support & Resistance
Supply & Demand zones
Break of Structure (BOS) / CHoCH
Best performance on M5 – H1 timeframes.
⚠️ DISCLAIMER
This indicator is a supporting tool, not a guaranteed profit system. Always apply proper risk management. You are fully responsible for your trading decisions.
Candlestick analysis

Candlestick Pattern Identifier (Extended + Alerts)Candlestick Pattern Identifier (Extended + Alerts)


Effort per 1% Move (Normalized Columns)This indicator Shows a Normalized "effort" needed to move a certain assets price by 1 percent.
Used correctly, this can help in visualizing manipulation and shows a certain chance of a candle turning to a swing point.

Koushik_BBEMAJust a combination of BB and EMA. An easy way to immediately add bollinger band and multiple ema to your chart.

5MA+スーパートレンド + Disparity Scalping (SIMPLE FILTER)5MA + ATR Trend Filter + Disparity Scalping
This indicator combines a five-EMA trend framework, an ATR-based trailing trend line, a volatility breakout detector, and an ultra-fast scalping module using RSI and custom momentum prediction.
It is designed for both trend continuation and rapid reversal trading.
🔹 Main Components
1️⃣ Five-EMA Trend Framework
Uses 9 / 20 / 50 / 100 / 200 EMAs
Identifies short-term and long-term market direction
Provides dynamic support and resistance
Helpful for determining breakout vs. pullback conditions
2️⃣ ATR-Based Trailing Trend Line
Uses ATR multiplier to build a trailing stop line
Color change indicates directional shift
Works as a trend filter or trailing stop reference
Helps avoid counter-trend trades during strong trends
3️⃣ High-Volatility Breakout Detector (Optimized for Fast Markets)
Uses ATR expansion, Bollinger band breakout, and volatility comparison (HV vs RV)
Detects sudden market acceleration
Generates breakout BUY/SELL signals when volatility pressure aligns with direction
Useful for explosive markets such as gold or crypto, but compatible with all assets
4️⃣ Ultra-Fast Disparity Scalper
Measures price distance from EMA5 and EMA10
Uses RSI for exhaustion filtering
Predicts momentum turns with a custom RVI-based algorithm
Generates early reversal BUY/SELL signals before full market reaction
Designed for scalping in high-speed environments
5️⃣ Simple Overheat Filter
Blocks trades in extremely overbought/oversold zones
Gray signals indicate low-quality trade setups to avoid
Helps remove “chasing” entries during excessive deviation
🎯 Best Use Cases
Scalping fast reversals
Entering trends after confirmed volatility breakouts
Filtering entries during extreme overbought/oversold phases
Combining EMA structure with breakout momentum
⚠️ Important Notice
This tool is designed to support decision making, not guarantee trade results.
For best performance, combine with:
Price action (market structure)
Volume/volatility context
Support and resistance analysis
🏷️ Short Description (for compact summary)
Five-EMA trend structure with ATR trailing filter, volatility breakout detection, and ultra-fast scalping using RSI + momentum prediction. Suitable for both rapid reversals and trend continuation setups.

5MA+TrendMagic + Disparity Scalping (SIMPLE FILTER)5MA + Trend Filter + Disparity Scalping
This multi-purpose indicator combines a five-EMA trend structure, a volatility-based trend filter, and an ultra-fast scalping module to detect both trend continuation and sharp reversal opportunities.
It is suitable for scalping, day trading, and trend-following strategies.
🔹 Main Components
1️⃣ Five-EMA Trend Structure
Displays 9 / 20 / 50 / 100 / 200 EMA levels
Helps identify short-term and long-term market direction
Useful for support and resistance during trending markets
2️⃣ Volatility-Driven Trend Filter
Uses CCI and ATR to form a dynamic trailing line
The line switches color based on momentum direction
Can act as a trailing stop or trend confirmation filter
Helps avoid counter-trend entries
3️⃣ High-Volatility GOLD Signal
Detects sudden volatility expansions using ATR, Bollinger metrics, and volatility comparison (HV vs RV)
Marks rapid breakout situations with potential continuation setups
Available for all assets, optimized for highly volatile markets
4️⃣ Ultra-Fast Disparity Scalper
Measures price deviation from EMA5 and EMA10
Confirms exhaustion using RSI + momentum prediction from a custom RVI model
Generates early BUY/SELL reversal markers
Detects momentum shifts before price fully reacts
5️⃣ Simple Overheat Filter
Prevents trades in extremely overbought/oversold zones
Gray-colored signals indicate unsafe trades to avoid
🎯 Best Use Cases
Catching early reversals during fast movement
Identifying strong trend continuation after volatility expansion
Avoiding low-probability scalps in overheated conditions
Applying EMA structure for confluence with price action
⚠️ Note
This indicator is a decision-support tool, not a standalone signal generator.
For best precision, combine with:
Market structure
Volume analysis
Support / resistance levels
🏷️ Short Description (for compact field)
Multi-function tool combining 5EMA structure, volatility-based trend filtering, and ultra-fast reversal scalping using RSI + custom RVI momentum. Ideal for both trend continuation and rapid reversals.

ATR + BJ Signal(GOLD)This script visualizes a price-based counting pattern that highlights potential market exhaustion and reversal areas.
When a series of candles continues in one direction, the indicator measures price momentum loss and marks possible turning points.
Features
Counts consecutive upward or downward price movement
Highlights possible exhaustion or reversal areas
Optional alerts, take-profit and stop-loss visual levels
Fully customizable colors and display settings
Useful as a confirmation tool with trend or volume indicators
This indicator is designed to assist decision-making, not to generate mechanical buy/sell signals.
Best used together with other trend or volatility tools.
📎 Short Description (for compact field)
Counts consecutive price movement to highlight potential market exhaustion and reversal zones.
Helps identify when strong trends may be weakening.

CISD Trend Candle - EMA + Always MACDThis indicator combines trend detection using EMA with constant MACD cross signals to provide a clear visual understanding of market direction and potential entry/exit points.
■ 1. Trend Detection with EMA (Candle Coloring)
Calculates an EMA (default: 21).
Checks whether the last n candles (default: 5):
Close above the EMA → Uptrend (Blue candles)
Close below the EMA → Downtrend (Red candles)
Otherwise → Neutral (Gray candles)
Candle colors automatically change to show the current market trend at a glance.
■ 2. Always-Visible MACD Golden/Dead Cross Signals
Based on MACD settings (12, 26, 9)
Golden Cross → Blue upward triangle below the bar
Dead Cross → Red downward triangle above the bar
Signals are always displayed, regardless of trend state, making them useful for timing entries and exits.
■ 3. EMA Line Display
The EMA used for trend detection is plotted as an orange line.
🎯 Ideal Use Cases
This indicator is designed for traders who want to:
Quickly visualize trend direction through candle colors
Always monitor MACD cross signals
Improve decision-making with simple, intuitive visual cues

Momentum Marks - Buy and Sell IndicatorsIndicator Overview
This tool is a multi‑factor entry signal system designed to highlight potential BUY and SHORT opportunities directly on the chart with hard‑anchored labels. It combines trend, momentum, volatility, and volume conditions to reduce noise and provide more reliable trade signals.
Core Components
- EMA Trend Filter
- Uses a fast EMA (9) and a slow EMA (21) to determine short‑term vs. medium‑term trend direction.
- Signals only trigger when price aligns with the EMA relationship (e.g., fast above slow for shorts, fast below slow for buys).
- RSI Extremes
- RSI thresholds (default 65/35) ensure signals occur only when momentum is stretched into overbought or oversold zones.
- Helps avoid false triggers during neutral conditions.
- Linear Regression Channel
- A regression line with ±2 standard deviation bands defines dynamic support and resistance.
- Signals require price to be near the top (for shorts) or bottom (for buys) of the channel, adding a structural filter.
- TTM Squeeze Histogram
- Measures momentum shifts by comparing price to its EMA.
- Signals require histogram confirmation: weakening momentum for shorts, strengthening momentum for buys.
- Volume Confirmation
- Volume must fade for shorts or surge for buys relative to a 20‑period average.
- Ensures signals align with participation strength.
Visual Output
- Red “SHORT” label above bars when all short conditions align.
- Green “BUY” label below bars when all buy conditions align.
- Optional plotshape arrows (triangles) as backup markers.
- Linear regression channel shaded between upper and lower bands.
- EMA lines plotted for trend context.
Key Features
- Hard‑anchored labels: Signals are locked to confirmed bars, preventing repainting or shifting.
- Multi‑layer confirmation: Requires trend, momentum, volume, and structure to align before firing.
- Customizable inputs: Users can adjust EMA lengths, RSI thresholds, regression length, and squeeze parameters.

Alson Chew PAM EXE and Mother BarIndicators for strategies taught by Alson Chew's Price Action Manipulation (PAM) course
Two functions.
First it identifies EXE bars (Pin, Mark, Icecream bars).
Second it identifies Mother bars and draws an extension line for 6 bars.
Applicable to all time frames and can customise how many signals to show.
To be used in conjunction with trading strategies like
- 20 SMA, 50 SMA, 200 SMA FS formation
- Force Bottom, Force Top FS formation
- UR1 and DR1 using EXE Bar

猛の掟・初動完成版//@version=5
indicator("猛の掟・初動スクリーナー_完成版", overlay=true)
// =============================
// 入力パラメータ
// =============================
emaLenShort = input.int(5, "短期EMA", minval=1)
emaLenMid = input.int(13, "中期EMA", minval=1)
emaLenLong = input.int(26, "長期EMA", minval=1)
macdFastLen = input.int(12, "MACD Fast", minval=1)
macdSlowLen = input.int(26, "MACD Slow", minval=1)
macdSignalLen = input.int(9, "MACD Signal", minval=1)
macdZeroTh = input.float(0.2, "MACDゼロライン近辺とみなす許容値", step=0.05)
volMaLen = input.int(5, "出来高平均日数", minval=1)
volMinRatio = input.float(1.3, "出来高倍率(初動判定しきい値)", step=0.1)
volStrongRatio = input.float(1.5, "出来高倍率(本物/三点シグナル用)", step=0.1)
highLookback = input.int(60, "直近高値の参照本数", minval=10)
pullbackMin = input.float(5.0, "押し目最小 ", step=0.5)
pullbackMax = input.float(15.0, "押し目最大 ", step=0.5)
breakLookback = input.int(15, "レジブレ後とみなす本数", minval=1)
wickBodyMult = input.float(2.0, "ピンバー:下ヒゲが実体の何倍以上か", step=0.5)
// ★ シグナル表示 ON/OFF
showMou = input.bool(true, "猛シグナルを表示")
showKaku = input.bool(true, "確シグナルを表示")
// =============================
// 基本指標計算
// =============================
emaShort = ta.ema(close, emaLenShort)
emaMid = ta.ema(close, emaLenMid)
emaLong = ta.ema(close, emaLenLong)
= ta.macd(close, macdFastLen, macdSlowLen, macdSignalLen)
volMa = ta.sma(volume, volMaLen)
volRatio = volMa > 0 ? volume / volMa : 0.0
recentHigh = ta.highest(high, highLookback)
prevHigh = ta.highest(high , highLookback)
pullbackPct = recentHigh > 0 ? (recentHigh - close) / recentHigh * 100.0 : 0.0
// ローソク足
body = math.abs(close - open)
upperWick = high - math.max(open, close)
lowerWick = math.min(open, close) - low
// =============================
// A:トレンド条件
// =============================
emaUp = emaShort > emaShort and emaMid > emaMid and emaLong > emaLong
goldenOrder = emaShort > emaMid and emaMid > emaLong
aboveEma2 = close > emaLong and close > emaLong
trendOK = emaUp and goldenOrder and aboveEma2
// =============================
// B:MACD条件
// =============================
macdGC = ta.crossover(macdLine, macdSignal)
macdNearZero = math.abs(macdLine) <= macdZeroTh
macdUp = macdLine > macdLine
macdOK = macdGC and macdNearZero and macdUp
// =============================
// C:出来高条件
// =============================
volInitOK = volRatio >= volMinRatio // 8条件用
volStrongOK = volRatio >= volStrongRatio // 三点シグナル用
volumeOK = volInitOK
// =============================
// D:ローソク足パターン
// =============================
isBullPinbar = lowerWick > wickBodyMult * body and lowerWick > upperWick and close >= open
isBullEngulf = close > open and open < close and close > open
isBigBullCross = close > emaShort and close > emaMid and open < emaShort and open < emaMid and close > open
candleOK = isBullPinbar or isBullEngulf or isBigBullCross
// =============================
// E:価格帯(押し目&レジブレ)
// =============================
pullbackOK = pullbackPct >= pullbackMin and pullbackPct <= pullbackMax
isBreakout = close > prevHigh and close <= prevHigh
barsSinceBreak = ta.barssince(isBreakout)
afterBreakZone = barsSinceBreak >= 0 and barsSinceBreak <= breakLookback
afterBreakPullbackOK = afterBreakZone and pullbackOK and close > emaShort
priceOK = pullbackOK and afterBreakPullbackOK
// =============================
// 8条件の統合
// =============================
allRulesOK = trendOK and macdOK and volumeOK and candleOK and priceOK
// =============================
// 最終三点シグナル
// =============================
longLowerWick = lowerWick > wickBodyMult * body and lowerWick > upperWick
macdGCAboveZero = ta.crossover(macdLine, macdSignal) and macdLine > 0
volumeSpike = volStrongOK
finalThreeSignal = longLowerWick and macdGCAboveZero and volumeSpike
buyConfirmed = allRulesOK and finalThreeSignal
// =============================
// 描画
// =============================
plot(emaShort, color=color.new(color.yellow, 0), title="EMA 短期(5)")
plot(emaMid, color=color.new(color.orange, 0), title="EMA 中期(13)")
plot(emaLong, color=color.new(color.blue, 0), title="EMA 長期(26)")
// シグナル表示(ON/OFF付き)
plotshape(showMou and allRulesOK, title="猛の掟 8条件クリア候補", location=location.belowbar, color=color.new(color.lime, 0), text="猛")
plotshape(showKaku and buyConfirmed, title="猛の掟 最終三点シグナル確定", location=location.belowbar, color=color.new(color.yellow, 0), text="確")
// =============================
// アラート条件
// =============================
alertcondition(allRulesOK, title="猛の掟 8条件クリア候補", message="猛の掟 8条件クリア候補シグナル発生")
alertcondition(buyConfirmed, title="猛の掟 最終三点シグナル確定", message="猛の掟 最終三点シグナル=買い確定")

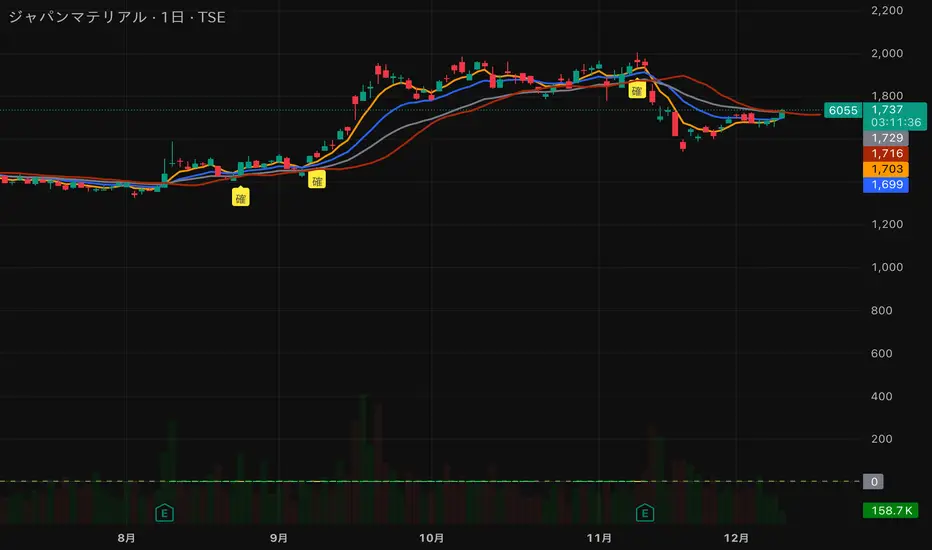
猛の掟・初動スクリーナー v3//@version=5
indicator("猛の掟・初動スクリーナー v3", overlay=true)
// ===============================
// 1. 移動平均線(EMA)設定
// ===============================
ema5 = ta.ema(close, 5)
ema13 = ta.ema(close, 13)
ema26 = ta.ema(close, 26)
plot(ema5, title="EMA5", color=color.orange, linewidth=2)
plot(ema13, title="EMA13", color=color.new(color.blue, 0), linewidth=2)
plot(ema26, title="EMA26", color=color.new(color.gray, 0), linewidth=2)
// ===============================
// 2. MACD(10,26,9)設定
// ===============================
fast = ta.ema(close, 10)
slow = ta.ema(close, 26)
macd = fast - slow
signal = ta.ema(macd, 9)
macdBull = ta.crossover(macd, signal)
// ===============================
// 3. 初動判定ロジック
// ===============================
// ゴールデン並び条件
goldenAligned = ema5 > ema13 and ema13 > ema26
// ローソク足が26EMAより上
priceAbove26 = close > ema26
// 3条件すべて満たすと「確」
bullEntry = goldenAligned and priceAbove26 and macdBull
// ===============================
// 4. スコア(0=なし / 1=猛 / 2=確)
// ===============================
score = bullEntry ? 2 : (goldenAligned ? 1 : 0)
// ===============================
// 5. スコアの色分け
// ===============================
scoreColor = score == 2 ? color.new(color.yellow, 0) : score == 1 ? color.new(color.lime, 0) : color.new(color.gray, 80)
// ===============================
// 6. スコア表示(カラム)
// ===============================
plot(score,
title="猛スコア (0=なし,1=猛,2=確)",
style=plot.style_columns,
color=scoreColor,
linewidth=3)
// 目安ライン
hline(0, "なし", color=color.new(color.gray, 80))
hline(1, "猛", color=color.new(color.lime, 60))
hline(2, "確", color=color.new(color.yellow, 60))
// ===============================
// 7. チャート上に「確」ラベル
// ===============================
plotshape(score == 2,
title="初動確定",
style=shape.labelup,
text="確",
color=color.yellow,
textcolor=color.black,
size=size.tiny,
location=location.belowbar)
Pious 3EMA-8EMA with 89ema when the stock price is above 89 ema and 3emah is above 8emah and 3emal is above 8emal buy prefers and vice versa, other conditions are additive to it

30-Minute High and Low30-Minute High and Low Levels
This indicator plots the previous 30-minute candle’s high and low on any intraday chart.
These levels are widely used by intraday traders to identify key breakout zones, liquidity pools, micro-range boundaries, and early trend direction.
Features:
• Automatically pulls the previous 30-minute candle using higher-timeframe HTF requests
• Displays the HTF High (blue) and HTF Low (red) on lower-timeframe charts
• Works on all intraday timeframes (1m, 3m, 5m, 10m, etc.)
• Levels stay fixed until the next 30-minute bar completes
• Ideal for ORB strategies, scalping, liquidity sweeps, and reversal traps
Use Cases:
• Watch for breakouts above the 30-minute high
• Monitor for liquidity sweeps and fakeouts around the high/low
• Treat the mid-range as a magnet during consolidation
• Combine with VWAP or EMA trend structure for high-precision intraday setups
This indicator is simple, fast, and designed for traders who rely on HTF micro-structure to guide intraday execution.

Scary Flush Indicator R0Work in progress.
Calculates the gradient based on candle lows (previous low to current low). Works on all time frames.
Looks for a selling gradient of >0.75pts per minute then highlights. Anything less than this indicates a lazy grind down and indicates a potential invalidation for the FBD.

Cold Brew Ranges🧭 Core Logic and Calculation
The fundamental logic for each range (OR and CR) is identical:
Time Definition: Each range is defined by a specific Start Time and a fixed 30-second duration. The timestamp function, using the "America/New_York" time zone, is used to calculate the exact start time in Unix milliseconds for the current day.
Example: t0200 = timestamp(TZ, yC, mC, dC, 2, 0, 0) sets the start time for the 02:00 OR to 2:00:00 AM NY time.
Range Data Collection: The indicator uses the request.security_lower_tf() function to collect the High (hArr) and Low (lArr) prices of all bars that fall within the defined 30-second window, using a user-specified, sub-chart-timeframe (openrangetime, defaulted to "1" second, "30S", or "5" minutes). This ensures high precision in capturing the exact high and low during the 30-second window.
High/Low Determination: It iteratively finds the absolute highest price (OR_high) and the absolute lowest price (OR_low) recorded by the bars during that 30-second window.
Range Locking: Once the current chart bar's time (lastTs) passes the 30-second End Time (tEnd), the High and Low are locked (OR_locked = true), meaning the range calculation is complete for the day.
Drawing: Upon locking, the range is drawn on the chart using line.new for the High, Low, and Equilibrium, and box.new for the shaded fill. The lines are extended to a subsequent time anchor point (e.g., the 02:00 OR is extended to 08:20, the 09:30 OR is extended to 16:00).
Equilibrium (EQ): This is calculated as the simple average (midpoint) of the High and Low of the range.
EQ=
2
OR_High+OR_Low
⏰ Defined Trading Ranges
The indicator defines and tracks the following specific 30-second ranges:
Range Name Type Start Time (NY) Line Extension End Time (NY) Common Market Context
02:00 OR Opening 02:00:00 08:20:00 Asian/European Market Overlap
08:20 OR Opening 08:20:00 16:00:00 Pre-New York Open
09:30 OR Opening 09:30:00 16:00:00 New York Stock Exchange Open (Most significant OR)
18:00 OR Opening 18:00:00 20:00:00 Futures Market Open (Sunday/Monday)
20:00 OR Opening 20:00:00 Next Day's session start Asian Session Start
15:50 CR Closing 15:50:00 20:00:00 New York Close Range
⚙️ Key User Inputs and Customization
The script offers extensive control over which ranges are displayed and how they are visualized:
Range Time & History
openrangetime: Sets the sub-timeframe (e.g., "1" for 1 second) used to calculate the precise High/Low of the 30-second range. Crucial for accuracy.
showHistory: A toggle to show the ranges from previous days (up to a histCap of 50 days).
Range Toggles and Styling
On/Off Toggles: Independent input.bool (e.g., OR_0200_on) to enable or disable the display of each individual range.
Colors & Width: Separate color and width inputs for the High/Low lines (hlC), the Equilibrium line (eqC), and the background fill (fillC) for each range.
Line Styles: Global inputs for the line styles of High/Low (lineStyleInput) and Equilibrium (eqLineStyleInput) lines (Solid, Dotted, or Dashed).
showFill: Global toggle to enable the shaded background box that highlights the area between the High and Low.
Extensions
The script calculates and plots extensions (multiples of the initial range) above the High and below the Low.
showExt: Toggles the visibility of the extension lines.
useRangeMultiples: If true, the step size for each extension level is equal to the initial range size:
Step=Range=OR_High−OR_Low
If false, the step size is a fixed value defined by stepPts (e.g., 60.0 points, which is a common value for NQ futures).
stepCnt: Determines how many extension levels (multiples) are drawn above and below the range (default is 10).
📈 Trading Strategy Implications
The Cold Brew Ranges indicator is a tool for session-based support and resistance and range breakout/reversal strategies.
Key Support/Resistance: The High and Low of these defined opening ranges often act as strong, predefined price levels. Traders look for price rejection off these boundaries or a breakout with conviction.
Equilibrium (Midpoint): The EQ often represents a fair value for that specific session's opening. Movements away from it are seen as opportunities, and a return to it is common.
Extensions: The range extensions serve as potential profit targets or stronger, layered support/resistance levels if the market trends aggressively after the opening range is set.
The core idea is that the activity in the first 30 seconds of a significant trading session (like the NYSE or a market session open) sets a bias and initial boundary for the trading period that follows.

仓位计算器# 仓位计算器
通过开仓、止损、止盈计算固定盈亏比适合的开仓数量,根据开仓和止损判断开仓方向。
首次使用需要手动设置开仓、止盈、止损,之后可以手动拖拽价格线设置值然后自动计算仓位信息。
---
# Position Calculator
Calculates the optimal position size with a fixed profit/loss ratio based on opening, stop-loss, and take-profit levels. Determines the direction of the position based on the opening and stop-loss settings.
Initial use requires manual setting of opening, take-profit, and stop-loss. Afterward, you can manually drag the price line to set values and the system will automatically calculate position information.

FOR CRT SMT – 4 CANDLEFOR CRT SMT – 4 CANDLE Indicator
This indicator detects SMT (Smart Money Technique) divergence by comparing the last 4 candle highs and lows of two different assets.
Originally designed for BTC–ETH comparison, but it works on any market, including Forex pairs.
You can open EURUSD on the chart and select GBPUSD from the settings, and the indicator will detect SMT divergence between EUR and GBP the same way it does between BTC and ETH. This makes it useful for analyzing correlated markets across crypto, forex, and more.
🔴 Upper SMT (Bearish Divergence – Red)
Occurs when:
The main chart asset makes a higher high,
The comparison asset makes a lower high.
This may signal a liquidity grab and potential reversal.
🟢 Lower SMT (Bullish Divergence – Green)
Occurs when:
The main chart asset makes a lower low,
The comparison asset makes a higher low.
This may indicate the market is sweeping liquidity before reversing upward.
📌 Features
Uses the last 4 candles of both assets.
Automatically draws divergence lines.
Shows clear “SMT ↑” or “SMT ↓” labels.
Works on Crypto, Forex, and all correlated assets.

LiquidityPulse Higher Timeframe Consecutive Candle Run LevelsLiquidityPulse Higher Timeframe Consecutive Candle Run Levels
Research suggests that financial markets can alternate between trend-persistence and mean-reversion regimes, particularly at short (intraday) or very long timeframes. Extended directional moves, whether prolonged intraday rallies or sell-offs, also carry a statistically higher chance of retracing or reversing (Safari & Schmidhuber, 2025). In addition, studies examining support and resistance behaviour show that swing highs or lows formed after strong directional moves may act as structurally and psychologically important price levels, where subsequent price interactions have an increased likelihood of stalling or bouncing rather than passing through directly (Chung & Bellotti, 2021). By highlighting higher-timeframe candle runs and marking their extremal levels, this indicator aims to display areas where directional momentum previously stopped, providing contextual "watch levels" that traders may incorporate into their broader analysis.
How this information is used in the indicator:
When a sequence of consecutive higher-timeframe candles prints in the same direction, the indicator highlights the lower-timeframe chart with a green or red background, depending on whether the higher-timeframe run was bullish or bearish. The highest high (for a bull run) or lowest low (for a bear run) of that sequence forms a recent extremum, and this value is plotted as a swing-high or swing-low level. These levels appear only after the required number of consecutive higher-timeframe candles (set by the user) have closed, and they continue updating as long as the higher-timeframe streak remains intact. A level "freezes" and stops updating only when an opposite-colour higher-timeframe candle closes (e.g., a red candle ending a bull run, or a green candle ending a bear run). Once frozen, the level remains fixed to preserve that structural information for future analysis or retests. The number of past bull/bear levels displayed on the chart is also adjustable in the settings.
Why capture a level after a long directional run:
When price moves in one direction for several consecutive candles (e.g. 4, 5, or more), it reflects strong directional bias, often associated with momentum, liquidity imbalance, or liquidity grabs. Once that sequence breaks, the final level reached marks a point of exhaustion or structural resistance/support, where that bias failed to continue. These inflection points are often used by traders and trading algorithms to assess potential reversals, retests, or breakout setups. By freezing these levels once the run ends, the indicator creates a map of historically significant price zones, allowing traders to observe how price behaves around them over time.
Additional information displayed by the indicator:
Each detected run includes a label showing the run length (the number of consecutive higher-timeframe candles in the streak) along with the source timeframe used for detection. The indicator also displays an overstretch marker: this numerical value appears when the total size of the candle bodies within the run exceeds a user-defined multiple of the average higher-timeframe body size (default: 1.5x). This helps highlight runs that were unusually strong or extended relative to typical volatility. You can also enable alerts that trigger when this overstretch ratio exceeds a higher threshold.
Key Settings
Timeframe: Choose which HTF to analyse (e.g., 15m, 1h, 4h)
Minimum Candle Run Length: Define how many consecutive candles are needed to trigger a level (e.g., 4)
Overstretch Settings: Customize detection threshold and alert trigger (in multiples of average body size)
Background Tints: Enable/disable visual highlights for bull and bear runs
Display Capacity: Choose how many past bull/bear levels to show
How Traders Can Use This Indicator
Traders can:
-Watch levels for retests, reversals, breakouts, or consolidation
-Identify areas where price showed strong directional conviction
-Spot extended or aggressive moves based on overstretch detection
-Monitor how price reacts when retesting prior run levels
-Build confluence with your existing levels, zones, or indicators
Disclaimer
This tool does not reflect true order flow, liquidity, or institutional positioning. It is a visual aid that highlights specific candle behaviour patterns and does not produce predictive signals. All analysis is subject to interpretation, and past price behaviour does not imply future outcomes.
References:
Trends and Reversion in Financial Markets on Time Scales from Minutes to Decades (Sara A. Safari & Christof Schmidhuber, 2025)
Evidence and Behaviour of Support and Resistance Levels in Financial Time Series (Chung & Bellotti, 2021)

Reversal (Heikin Ashi-ready)This indicator detects bullish and bearish reversal patterns based purely on price action relative to prior candles. It is designed to be Heikin Ashi–compatible, meaning it can optionally use HA OHLC values rather than standard candles.
The script identifies:
Bullish reversals (V Up triangles)
Bearish reversals (V Down triangles)
It uses a two-stage system:
Context detection (a potential reversal setup forms).
Confirmation detection (price breaks a key level within a specified number of bars).

Indicator ***TuYa*** V8.2 – HH/HL MTF + Peak Mid ZoneIndicator TuYa V8.0 – HH/HL MTF + Peak Mid Zone
TuYa V8.0 combines multi-timeframe market structure with a Peak Reaction midline to create clean, rule-based reversal and trend entries – designed primarily for 1-minute execution with 1-hour bias.
🧠 Core Concept
This indicator fuses three ideas:
HTF Peak Reaction Midline (1H)
Uses a Peak Reaction style logic on the higher timeframe (HTF, default: 1H).
Identifies a reaction high and reaction low, then calculates their midpoint → the Peak Mid Zone.
This midline acts as a dynamic sentiment divider (above = premium / below = discount).
Multi-Timeframe HH/HL/LH/LL Structure
HTF structure (1H): detects HH, HL, LH, LL using pivot highs/lows.
LTF structure (1m): detects HH, HL, LH, LL on the execution timeframe (chart TF, intended for 1m).
HTF → LTF Confirmation Window
After a 1H structure event (HH, HL, LL, LH), the indicator opens a confirmation window of up to N LTF candles (default: 10 x 1m bars).
Within that window, the required 1m structure event must occur to confirm an entry.
🎯 Signal Logic
All entries are generated on the LTF (e.g. 1m chart), using HTF (e.g. 1H) bias + Peak Mid Zone:
1️⃣ Price ABOVE Peak Mid (Bullish premium zone)
Reversal SELL
HTF: HH (Higher High)
Within N 1m bars: LTF HH
→ SELL signal (fading HTF strength near premium)
Trend/Bullish BUY
HTF: HL (Higher Low)
Within N 1m bars: LTF LL
→ BUY signal (buying dips in an uptrend above midline)
2️⃣ Price BELOW Peak Mid (Bearish discount zone)
Reversal BUY
HTF: LL (Lower Low)
Within N 1m bars: LTF LL
→ BUY signal (catching potential reversal from discount)
Trend/Bearish SELL
HTF: LH (Lower High)
Within N 1m bars: LTF HH
→ SELL signal (shorting strength in a downtrend below midline)
Signals are plotted as small BUY/SELL triangles on the chart and exposed via alert conditions.
🧾 Filters & Options
⏳ HTF → LTF Delay Window
Input: “Max 1m bars after HTF trigger” (default: 10)
After a 1H HH/HL/LL/LH event, the indicator waits up to N LTF candles for the matching 1m structure pattern.
If no match occurs within the window, no signal is generated.
📉 RSI No-Trade Zone (HTF)
Toggle: Use RSI no-trade zone
Inputs:
RSI Length (HTF)
No-trade lower bound (default 45)
No-trade upper bound (default 65)
If HTF RSI is inside the defined band (e.g. 45–65), signals are blocked (no-trade regime), helping to avoid noisy mid-range conditions.
You can turn this filter ON/OFF and adjust the band dynamically.
🧱 5m OB / Direction Filter (Optional)
Toggle: Use 5m OB direction filter
Timeframe: Configurable (default: 5m).
Uses a simple directional proxy on the OB timeframe:
For BUY signals → require a bullish candle on OB timeframe.
For SELL signals → require a bearish candle on OB timeframe.
When enabled, this adds an extra layer of confluence by aligning entries with the short-term directional context.
⚙️ Key Inputs (Summary)
Timeframes
HTF (Peak Reaction & Structure): default 60 (1H)
Peak Reaction
Lookback bars (HTF)
ATR multiplier for zones
Show/Hide Peak Mid line
Structure
Pivot left/right bars (for HH/HL/LH/LL swings)
Toggle structure labels (HTF & LTF)
Confirmation
Max LTF bars after HTF trigger (default 10, fully configurable)
RSI Filter
Use filter (on/off)
RSI length
No-trade range (low/high)
5m OB Filter
Use filter (on/off)
OB timeframe (default 5m)
📡 Alerts & Automation
The script includes alertconditions for both BUY and SELL signals, with JSON-formatted alert messages suitable for routing to external bridges (e.g. bots, MT5/MT4, n8n, etc.).
Each alert includes:
Symbol
Side (BUY / SELL)
Price / Entry
SL & TP placeholders (from hidden plots, ready to be wired to your own logic)
Time
Performance tag
CommentCode (for strategy/type tagging on the receiver side)
You can attach these alerts to a webhook and let your execution engine handle SL/TP and order management.
📌 How to Use
Attach the indicator to a 1-minute chart.
Set HTF timeframe to 60 (or your preferred higher timeframe).
Optionally enable:
RSI regime filter
5m OB direction filter
Watch for:
Price relative to the Peak Mid line
BUY/SELL triangles that respect HTF structure + LTF confirmation + filters.
For automation, create alerts using the built-in conditions and your preferred JSON alert template.
⚠️ Disclaimer
This tool is for educational and informational purposes only.
It is not financial advice and does not guarantee profits. Always test thoroughly in replay / paper trading before using with live funds, and trade at your own risk.

5-Bar BreakoutThis indicator shows if the price is breaking out above the high or the low of the previous 5 bars
