Obsidian Flux Matrix# Obsidian Flux Matrix | JackOfAllTrades
Made with my Senior Level AI Pine Script v6 coding bot for the community!
Narrative Overview
Obsidian Flux Matrix (OFM) is an open-source Pine Script v6 study that fuses social sentiment, higher timeframe trend bias, fair-value-gap detection, liquidity raids, VWAP gravitation, session profiling, and a diagnostic HUD. The layout keeps the obsidian palette so critical overlays stay readable without overwhelming a price chart.
Purpose & Scope
OFM focuses on actionable structure rather than marketing claims. It documents every driver that powers its confluence engine so reviewers understand what triggers each visual.
Core Analytical Pillars
1. Social Pulse Engine
Sentiment Webhook Feed: Accepts normalized scores (-1 to +1). Signals only arm when the EMA-smoothed value exceeds the `sentimentMin` input (0.35 by default).
Volume Confirmation: Requires local volume > 30-bar average × `volSpikeMult` (default 2.0) before sentiment flags.
EMA Cross Validation: Fast EMA 8 crossing above/below slow EMA 21 keeps momentum aligned with flow.
Momentum Alignment: Multi-timeframe momentum composite must agree (positive for longs, negative for shorts).
2. Peer Momentum Heatmap
Multi-Timeframe Blend: RSI + Stoch RSI fetched via request.security() on 1H/4H/1D by default.
Composite Scoring: Each timeframe votes +1/-1/0; totals are clamped between -3 and +3.
Intraday Readability: Configurable band thickness (1-5) so scalpers see context without losing space.
Dynamic Opacity: Stronger agreement boosts column opacity for quick bias checks.
3. Trend & Displacement Framework
Dual EMA Ribbon: Cyan/magenta ribbon highlights immediate posture.
HTF Bias: A higher-timeframe EMA (default 55 on 4H) sets macro direction.
Displacement Score: Body-to-ATR ratio (>1.4 default) detects impulses that seed FVGs or VWAP raids.
ATR Normalization: All thresholds float with volatility so the study adapts to assets and regimes.
4. Intelligent Fair Value Gap (FVG) System
Gap Detection: Three-candle logic (bullish: low > high ; bearish: high < low ) with ATR-sized minimums (0.15 × ATR default).
Overlap Prevention: Price-range checks stop redundant boxes.
Spacing Control: `fvgMinSpacing` (default 5) avoids stacking from the same impulse.
Storage Caps: Max three FVGs per side unless the user widens the limit.
Session Awareness: Kill zone filters keep taps focused on London/NY if desired.
Auto Cleanup: Boxes delete when price closes beyond their invalidation level.
5. VWAP Magnet + Liquidity Raid Engine
Session or Rolling VWAP: Toggle resets to match intraday or rolling preferences.
Equal High/Low Scanner: Looks back 20 bars by default for liquidity pools.
Displacement Filter: ATR multiplier ensures raids represent genuine liquidity sweeps.
Mean Reversion Focus: Signals fire when price displaces back toward VWAP following a raid.
6. Session Range Breakout System
Initial Balance Tracking: First N bars (15 default) define the session box.
Breakout Logic: Requires simultaneous liquidity spikes, nearby FVG activity, and supportive momentum.
Z-Score Volume Filter: >1.5σ by default to filter noisy moves.
7. Lifestyle Liquidity Scanner
Volume Z-Scores: 50-bar baseline highlights statistically significant spikes.
Smart Money Footprints: Bottom-of-chart squares color-code buy vs sell participation.
Panel Memory: HUD logs the last five raid timestamps, direction, and normalized size.
8. Risk Matrix & Diagnostic HUD
HUD Structure: Table in the top-right summarizes HTF bias, sentiment, momentum, range state, liquidity memory, and current risk references.
Signal Tags: Aggregates SPS, FVG, VWAP, Range, and Liquidity states into a compact string.
Risk Metrics: Swing-based stops (5-bar lookback) + ATR targets (1.5× default) keep risk transparent.
Signal Families & Alerts
Social Pulse (SPS): Volume-confirmed sentiment alignment; triangle markers with “SPS”.
Kill-Zone FVG: Session + HTF alignment + FVG tap; arrow markers plus SL/TP labels.
Local FVG: Captures local reversals when HTF bias has not flipped yet.
VWAP Raid: Equal-high/low raids that snap toward VWAP; “VWAP” label markers.
Range Breakout: Initial balance violations with liquidity and imbalance confirmation; circle markers.
Liquidity Spike: Z-score spikes ≥ threshold; square markers along the baseline.
Visual Design & Customization
Theme Palette: Primary background RGB (12,6,24). Accent shading RGB (26,10,48). Long accents RGB (88,174,255). Short accents RGB (219,109,255).
Stylized Candles: Optional overlay using theme colors.
Signal Toggles: Independently enable markers, heatmap, and diagnostics.
Label Spacing: Auto-spacing enforces ≥4-bar gaps to prevent text overlap.
Customization & Workflow Notes
Adjust ATR/FVG thresholds when volatility shifts.
Re-anchor sentiment to your webhook cadence; EMA smoothing (default 5) dampens noise.
Reposition the HUD by editing the `table.new` coordinates.
Use multiples of the chart timeframe for HTF requests to minimize load.
Session inputs accept exchange-local time; align them to your market.
Performance & Compliance
Pure Pine v6: Single-line statements, no `lookahead_on`.
Resource Safe: Arrays trimmed, boxes limited, `request.security` cached.
Repaint Awareness: Signals confirm on close; alerts mirror on-chart logic.
Runtime Safety: Arrays/loops guard against `na`.
Use Cases
Measure when social sentiment aligns with structure.
Plan ICT-style intraday rebalances around session-specific FVG taps.
Fade VWAP raids when displacement shows exhaustion.
Watch initial balance breaks backed by statistical volume.
Keep risk/target references anchored in ATR logic.
Signal Logic Snapshot
Social Pulse Long/Short: `sentimentEMA` gated by `sentimentMin`, `volSpike`, EMA 8/21 cross, and `momoComposite` sign agreement. Keeps hype tied to structural follow-through.
Kill-Zone FVG Long/Short: Requires session filter, HTF EMA bias alignment, and an active FVG tap (`bullFvgTap` / `bearFvgTap`). Labels include swing stops + ATR targets pulled from `swingLookback` and `liqTargetMultiple`.
Local FVG Long/Short: Uses `localBullish` / `localBearish` heuristics (EMA slope, displacement, sequential closes) to surface intraday reversals even when HTF bias has not flipped.
VWAP Raids: Detect equal-high/equal-low sweeps (`raidHigh`, `raidLow`) that revert toward `sessionVwap` or rolling VWAP when displacement exceeds `vwapAlertDisplace`.
Range Breakouts: Combine `rangeComplete`, breakout confirmation, liquidity spikes, and nearby FVG activity for statistically backed initial balance breaks.
Liquidity Spikes: Volume Z-score > `zScoreThreshold` logs direction, size, and timestamp for the HUD and optional review workflows.
Session Logic & VWAP Handling
Kill zone + NY session inputs use TradingView’s session strings; `f_inSession()` drives both visual shading and whether FVG taps are tradeable when `killZoneOnly` is true.
Session VWAP resets using cumulative price × volume sums that restart when the daily timestamp changes; rolling VWAP falls back to `ta.vwap(hlc3)` for instruments where daily resets are less relevant.
Initial balance box (`rangeBars` input) locks once complete, extends forward, and stays on chart to contextualize later liquidity raids or breakouts.
Parameter Reference
Trend: `emaFastLen`, `emaSlowLen`, `htfResolution`, `htfEmaLen`, `showEmaRibbon`, `showHtfBiasLine`.
Momentum: `tf1`, `tf2`, `tf3`, `rsiLen`, `stochLen`, `stochSmooth`, `heatmapHeight`.
Volume/Liquidity: `volLookback`, `volSpikeMult`, `zScoreLen`, `zScoreThreshold`, `equalLookback`.
VWAP & Sessions: `vwapMode`, `showVwapLine`, `vwapAlertDisplace`, `killSession`, `nySession`, `showSessionShade`, `rangeBars`.
FVG/Risk: `fvgMinTicks`, `fvgLookback`, `fvgMinSpacing`, `killZoneOnly`, `liqTargetMultiple`, `swingLookback`.
Visualization Toggles: `showSignalMarkers`, `showHeatmapBand`, `showInfoPanel`, `showStylizedCandles`.
Workflow Recipes
Kill-Zone Continuation: During the defined kill session, look for `killFvgLong` or `killFvgShort` arrows that line up with `sentimentValid` and positive `momoComposite`. Use the HUD’s risk readout to confirm SL/TP distances before entering.
VWAP Raid Fade: Outside kill zone, track `raidToVwapLong/Short`. Confirm the candle body exceeds the displacement multiplier, and price crosses back toward VWAP before considering reversions.
Range Break Monitor: After the initial balance locks, mark `rangeBreakLong/Short` circles only when the momentum band is >0 or <0 respectively and a fresh FVG box sits near price.
Liquidity Spike Review: When the HUD shows “Liquidity” timestamps, hover the plotted squares at chart bottom to see whether spikes were buy/sell oriented and if local FVGs formed immediately after.
Metadata
Author: officialjackofalltrades
Platform: TradingView (Pine Script v6)
Category: Sentiment + Liquidity Intelligence
Hope you Enjoy!
Candlestick analysis

bcon's bemas (5,8,13,21)simple ribbin i use for scalps. the 5 8 13 and 21 ema. like to see them lined up when i see a cross thats my sign to take profit

Instant Volume Flow1. Volume Bars (Green/Red)
Shows instantly whether buyers or sellers are dominant.
2. Delta Volume Histogram
Green = net buying pressure
Red = net selling pressure
This lets you spot:
Big sell dumps
Sudden buy absorption
Volume momentum shifts
3. Spike Alerts
You get alerts when volume is more than 2× the 20-MA average volume.

OFM Key LevelsDaily and Weekly Levels Only
Daily Levels Calculated from RTH Sessions
Weekly Levels Calculated ETH

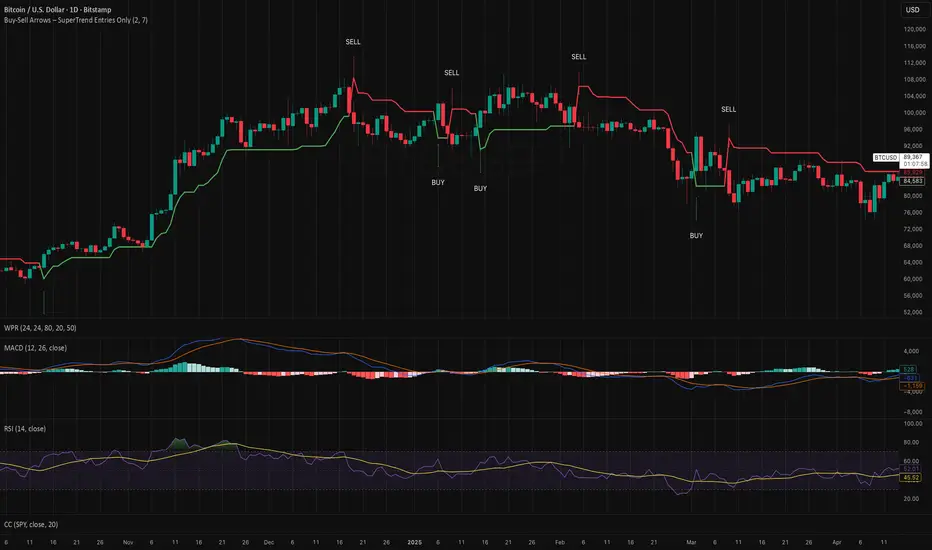
Buy-Sell Arrows – SuperTrend Entries OnlyRecommended Rules for "Buy Calls Only + Exit Fast on Downtrend"
Signal from SuperTrend Script Your Action (Calls Only)
Green BUY arrow → Enter calls (ATM or slightly OTM, 21–45 DTE)
Red SELL arrow → Immediately exit the call (market order or tight stop) — do NOT wait
No position between signals Stay in cash — no calls open during red SuperTrend phases
Buy-Call Arrows – SuperTrend Entries OnlyRecommended Rules
Signal from Script Your Action (Calls Only)
Green BUY arrow → Enter calls (ATM or slightly OTM, 45 DTE)
Red SELL arrow → Immediately exit the call (market order or tight stop) — do NOT wait
No position between signals Stay in cash — no calls open during red SuperTrend phases

Khango's Key//@version=5
//@sbtnc thank you for doing the base code
//Added additional levels for convienience sake.
indicator('Key Levels SpacemanBTC IDWM', shorttitle='Khangos Key', overlay=true, max_lines_count=100)
//35 works
displayStyle = input.string(defval='Standard', title='Display Style', options= , inline='Display')
mergebool = input.bool(defval=true, title='Merge Levels?', inline='Display')
distanceright = input.int(defval=30, title='Distance', minval=5, maxval=500, inline='Dist')
radistance = input.int(defval=250, title='Anchor Distance', minval=5, maxval=500, inline='Dist')
labelsize = input.string(defval='Medium', title='Text Size', options= )
linesize = input.string(defval='Small', title='Line Width', options= , inline='Line')
linestyle = input.string(defval='Solid', title='Line Style', options= , inline='Line')
GlobalTextType = input.bool(defval=false, title='Global Text ShortHand', tooltip='Enable for shorthand text on all text')
var globalcoloring = input.bool(defval=false, title='Global Coloring', tooltip='Enable for all color controls via one color', inline='GC')
GlobalColor = input.color(title='', defval=color.white, inline='GC')
//var show_tails = input(defval = false, title = "Always Show", type = input.bool)
= request.security(syminfo.tickerid, 'D', , lookahead=barmerge.lookahead_on)
= request.security(syminfo.tickerid, 'D', [time , high ], lookahead=barmerge.lookahead_on)
= request.security(syminfo.tickerid, 'D', [time , low ], lookahead=barmerge.lookahead_on)
cdailyh_open = request.security(syminfo.tickerid, 'D', high, lookahead=barmerge.lookahead_on)
cdailyl_open = request.security(syminfo.tickerid, 'D', low, lookahead=barmerge.lookahead_on)
var monday_time = time
var monday_high = high
var monday_low = low
= request.security(syminfo.tickerid, 'W', , lookahead=barmerge.lookahead_on)
= request.security(syminfo.tickerid, 'W', [time , high ], lookahead=barmerge.lookahead_on)
= request.security(syminfo.tickerid, 'W', [time , low ], lookahead=barmerge.lookahead_on)
= request.security(syminfo.tickerid, 'M', , lookahead=barmerge.lookahead_on)
= request.security(syminfo.tickerid, 'M', [time , high ], lookahead=barmerge.lookahead_on)
= request.security(syminfo.tickerid, 'M', [time , low ], lookahead=barmerge.lookahead_on)
= request.security(syminfo.tickerid, '3M', , lookahead=barmerge.lookahead_on)
= request.security(syminfo.tickerid, '3M', [time , high ], lookahead=barmerge.lookahead_on)
= request.security(syminfo.tickerid, '3M', [time , low ], lookahead=barmerge.lookahead_on)
= request.security(syminfo.tickerid, '12M', , lookahead=barmerge.lookahead_on)
= request.security(syminfo.tickerid, '12M', , lookahead=barmerge.lookahead_on)
= request.security(syminfo.tickerid, '12M', , lookahead=barmerge.lookahead_on)
= request.security(syminfo.tickerid, '240', , lookahead=barmerge.lookahead_on)
= request.security(syminfo.tickerid, '240', [time , high ], lookahead=barmerge.lookahead_on)
= request.security(syminfo.tickerid, '240', [time , low ], lookahead=barmerge.lookahead_on)
//------------------------------ Inputs -------------------------------
var is_intra_enabled = input.bool(defval=false, title='Open', group='4H', inline='4H')
var is_intrarange_enabled = input.bool(defval=false, title='Prev H/L', group='4H', inline='4H')
var is_intram_enabled = input.bool(defval=false, title='Prev Mid', group='4H', inline='4H')
IntraTextType = input.bool(defval=false, title='ShortHand', group='4H', inline='4Hsh')
var is_daily_enabled = input.bool(defval=true, title='Open', group='Daily', inline='Daily')
var is_dailyrange_enabled = input.bool(defval=false, title='Prev H/L', group='Daily', inline='Daily')
var is_dailym_enabled = input.bool(defval=false, title='Prev Mid', group='Daily', inline='Daily')
DailyTextType = input.bool(defval=false, title='ShortHand', group='Daily', inline='Dailysh')
var is_monday_enabled = input.bool(defval=true, title='Range', group='Monday Range', inline='Monday')
var is_monday_mid = input.bool(defval=true, title='Mid', group='Monday Range', inline='Monday')
var untested_monday = false
MondayTextType = input.bool(defval=false, title='ShortHand', group='Monday Range', inline='Mondaysh')
var is_weekly_enabled = input.bool(defval=true, title='Open', group='Weekly', inline='Weekly')
var is_weeklyrange_enabled = input.bool(defval=true, title='Prev H/L', group='Weekly', inline='Weekly')
var is_weekly_mid = input.bool(defval=true, title='Prev Mid', group='Weekly', inline='Weekly')
WeeklyTextType = input.bool(defval=false, title='ShortHand', group='Weekly', inline='Weeklysh')
var is_monthly_enabled = input.bool(defval=true, title='Open', group='Monthly', inline='Monthly')
var is_monthlyrange_enabled = input.bool(defval=true, title='Prev H/L', group='Monthly', inline='Monthly')
var is_monthly_mid = input.bool(defval=true, title='Prev Mid', group='Monthly', inline='Monthly')
MonthlyTextType = input.bool(defval=false, title='ShortHand', group='Monthly', inline='Monthlysh')
var is_quarterly_enabled = input.bool(defval=true, title='Open', group='Quarterly', inline='Quarterly')
var is_quarterlyrange_enabled = input.bool(defval=false, title='Prev H/L', group='Quarterly', inline='Quarterly')
var is_quarterly_mid = input.bool(defval=true, title='Prev Mid', group='Quarterly', inline='Quarterly')
QuarterlyTextType = input.bool(defval=false, title='ShortHand', group='Quarterly', inline='Quarterlysh')
var is_yearly_enabled = input.bool(defval=true, title='Open', group='Yearly', inline='Yearly')
var is_yearlyrange_enabled = input.bool(defval=false, title='Current H/L', group='Yearly', inline='Yearly')
var is_yearly_mid = input.bool(defval=true, title='Mid', group='Yearly', inline='Yearly')
YearlyTextType = input.bool(defval=false, title='ShortHand', group='Yearly', inline='Yearlysh')
var is_londonrange_enabled = input.bool(defval=false, title='London Range', group='FX Sessions', inline='FX')
var is_usrange_enabled = input.bool(defval=false, title='New York Range', group='FX Sessions', inline='FX')
var is_asiarange_enabled = input.bool(defval=false, title='Asia Range', group='FX Sessions', inline='FX')
SessionTextType = input.bool(defval=false, title='ShortHand', group='FX Sessions', inline='FXColor')
Londont = input.session("0800-1600", "London Session")
USt = input.session("1400-2100", "New York Session")
Asiat = input.session("0000-0900", "Tokyo Session")
DailyColor = input.color(title='', defval=#08bcd4, group='Daily', inline='Dailysh')
MondayColor = input.color(title='', defval=color.white, group='Monday Range', inline='Mondaysh')
WeeklyColor = input.color(title='', defval=#fffcbc, group='Weekly', inline='Weeklysh')
MonthlyColor = input.color(title='', defval=#08d48c, group='Monthly', inline='Monthlysh')
YearlyColor = input.color(title='', defval=color.red, group='Yearly', inline='Yearlysh')
quarterlyColor = input.color(title='', defval=color.red, group='Quarterly', inline='Quarterlysh')
IntraColor = input.color(title='', defval=color.orange, group='4H', inline='4Hsh')
LondonColor = input.color(title='', defval=color.white, group='FX Sessions', inline='FXColor')
USColor = input.color(title='', defval=color.white, group='FX Sessions', inline='FXColor')
AsiaColor = input.color(title='', defval=color.white, group='FX Sessions', inline='FXColor')
var pdhtext = GlobalTextType or DailyTextType ? 'PDH' : 'Prev Day High'
var pdltext = GlobalTextType or DailyTextType ? 'PDL' : 'Prev Day Low'
var dotext = GlobalTextType or DailyTextType ? 'DO' : 'Daily Open'
var pdmtext = GlobalTextType or DailyTextType ? 'PDM' : 'Prev Day Mid'
var pwhtext = GlobalTextType or WeeklyTextType ? 'PWH' : 'Prev Week High'
var pwltext = GlobalTextType or WeeklyTextType ? 'PWL' : 'Prev Week Low'
var wotext = GlobalTextType or WeeklyTextType ? 'WO' : 'Weekly Open'
var pwmtext = GlobalTextType or WeeklyTextType ? 'PWM' : 'Prev Week Mid'
var pmhtext = GlobalTextType or MonthlyTextType ? 'PMH' : 'Prev Month High'
var pmltext = GlobalTextType or MonthlyTextType ? 'PML' : 'Prev Month Low'
var motext = GlobalTextType or MonthlyTextType ? 'MO' : 'Monthly Open'
var pmmtext = GlobalTextType or MonthlyTextType ? 'PMM' : 'Prev Month Mid'
var pqhtext = GlobalTextType or QuarterlyTextType ? 'PQH' : 'Prev Quarter High'
var pqltext = GlobalTextType or QuarterlyTextType ? 'PQL' : 'Prev Quarter Low'
var qotext = GlobalTextType or QuarterlyTextType ? 'QO' : 'Quarterly Open'
var pqmtext = GlobalTextType or QuarterlyTextType ? 'PQM' : 'Prev Quarter Mid'
var cyhtext = GlobalTextType or YearlyTextType ? 'CYH' : 'Current Year High'
var cyltext = GlobalTextType or YearlyTextType ? 'CYL' : 'Current Year Low'
var yotext = GlobalTextType or YearlyTextType ? 'YO' : 'Yearly Open'
var cymtext = GlobalTextType or YearlyTextType ? 'CYM' : 'Current Year Mid'
var pihtext = GlobalTextType or IntraTextType ? 'P-4H-H' : 'Prev 4H High'
var piltext = GlobalTextType or IntraTextType ? 'P-4H-L' : 'Prev 4H Low'
var iotext = GlobalTextType or IntraTextType ? '4H-O' : '4H Open'
var pimtext = GlobalTextType or IntraTextType ? 'P-4H-M' : 'Prev 4H Mid'
var pmonhtext = GlobalTextType or MondayTextType ? 'MDAY-H' : 'Monday High'
var pmonltext = GlobalTextType or MondayTextType ? 'MDAY-L' : 'Monday Low'
var pmonmtext = GlobalTextType or MondayTextType ? 'MDAY-M' : 'Monday Mid'
var lhtext = GlobalTextType or SessionTextType ? 'Lon-H' : 'London High'
var lltext = GlobalTextType or SessionTextType ? 'Lon-L' : 'London Low'
var lotext = GlobalTextType or SessionTextType ? 'Lon-O' : 'London Open'
var ushtext = GlobalTextType or SessionTextType ? 'NY-H' : 'New York High'
var usltext = GlobalTextType or SessionTextType ? 'NY-L' : 'New York Low'
var usotext = GlobalTextType or SessionTextType ? 'NY-O' : 'New York Open'
var asiahtext = GlobalTextType or SessionTextType ? 'AS-H' : 'Asia High'
var asialtext = GlobalTextType or SessionTextType ? 'AS-L' : 'Asia Low'
var asiaotext = GlobalTextType or SessionTextType ? 'AS-O' : 'Asia Open'
if globalcoloring == true
DailyColor := GlobalColor
MondayColor := GlobalColor
WeeklyColor := GlobalColor
MonthlyColor := GlobalColor
YearlyColor := GlobalColor
quarterlyColor := GlobalColor
IntraColor := GlobalColor
IntraColor
if weekly_time != weekly_time
untested_monday := false
untested_monday
if is_monday_enabled == true and untested_monday == false
untested_monday := true
monday_time := daily_time
monday_high := cdailyh_open
monday_low := cdailyl_open
monday_low
linewidthint = 1
if linesize == 'Small'
linewidthint := 1
linewidthint
if linesize == 'Medium'
linewidthint := 2
linewidthint
if linesize == 'Large'
linewidthint := 3
linewidthint
var DEFAULT_LINE_WIDTH = linewidthint
var DEFAULT_TAIL_WIDTH = linewidthint
fontsize = size.small
if labelsize == 'Small'
fontsize := size.small
fontsize
if labelsize == 'Medium'
fontsize := size.normal
fontsize
if labelsize == 'Large'
fontsize := size.large
fontsize
linestyles = line.style_solid
if linestyle == 'Dashed'
linestyles := line.style_dashed
linestyles
if linestyle == 'Dotted'
linestyles := line.style_dotted
linestyles
var DEFAULT_LABEL_SIZE = fontsize
var DEFAULT_LABEL_STYLE = label.style_none
var DEFAULT_EXTEND_RIGHT = distanceright
London = time(timeframe.period, Londont)
US = time(timeframe.period, USt)
Asia = time(timeframe.period, Asiat)
var clondonhigh = 0.0
var clondonlow = close
var londontime = time
var flondonhigh = 0.0
var flondonlow = 0.0
var flondonopen = 0.0
var onelondonfalse = false
if London
if high > clondonhigh
clondonhigh := high
clondonhigh
if low < clondonlow
clondonlow := low
clondonlow
if onelondonfalse
londontime := time
flondonopen := open
flondonopen
flondonhigh := clondonhigh
flondonlow := clondonlow
onelondonfalse := false
onelondonfalse
else
if onelondonfalse == false
flondonhigh := clondonhigh
flondonlow := clondonlow
flondonlow
onelondonfalse := true
clondonhigh := 0.0
clondonlow := close
clondonlow
//////////////////////////////////
var cushigh = 0.0
var cuslow = close
var ustime = time
var fushigh = 0.0
var fuslow = 0.0
var fusopen = 0.0
var oneusfalse = false
if US
if high > cushigh
cushigh := high
cushigh
if low < cuslow
cuslow := low
cuslow
if oneusfalse
ustime := time
fusopen := open
fusopen
fushigh := cushigh
fuslow := cuslow
oneusfalse := false
oneusfalse
else
if oneusfalse == false
fushigh := cushigh
fuslow := cuslow
fuslow
oneusfalse := true
cushigh := 0.0
cuslow := close
cuslow
//////////////////////////////////
var casiahigh = 0.0
var casialow = close
var asiatime = time
var fasiahigh = 0.0
var fasialow = 0.0
var fasiaopen = 0.0
var oneasiafalse = false
if Asia
if high > casiahigh
casiahigh := high
casiahigh
if low < casialow
casialow := low
casialow
if oneasiafalse
asiatime := time
fasiaopen := open
fasiaopen
fasiahigh := casiahigh
fasialow := casialow
oneasiafalse := false
oneasiafalse
else
if oneasiafalse == false
fasiahigh := casiahigh
fasialow := casialow
fasialow
oneasiafalse := true
casiahigh := 0.0
casialow := close
casialow
//------------------------------ Plotting ------------------------------
var pricearray = array.new_float(0)
var labelarray = array.new_label(0)
f_LevelMerge(pricearray, labelarray, currentprice, currentlabel, currentcolor) =>
if array.includes(pricearray, currentprice)
whichindex = array.indexof(pricearray, currentprice)
labelhold = array.get(labelarray, whichindex)
whichtext = label.get_text(labelhold)
label.set_text(labelhold, label.get_text(currentlabel) + ' / ' + whichtext)
label.set_text(currentlabel, '')
label.set_textcolor(labelhold, currentcolor)
else
array.push(pricearray, currentprice)
array.push(labelarray, currentlabel)
var can_show_daily = is_daily_enabled and timeframe.isintraday
var can_show_weekly = is_weekly_enabled and not timeframe.isweekly and not timeframe.ismonthly
var can_show_monthly = is_monthly_enabled and not timeframe.ismonthly
get_limit_right(bars) =>
timenow + (time - time ) * bars
// the following code doesn't need to be processed on every candle
if barstate.islast
is_weekly_open = dayofweek == dayofweek.monday
is_monthly_open = dayofmonth == 1
can_draw_daily = (is_weekly_enabled ? not is_weekly_open : true) and (is_monthly_enabled ? not is_monthly_open : true)
can_draw_weekly = is_monthly_enabled ? not(is_monthly_open and is_weekly_open) : true
can_draw_intra = is_intra_enabled
can_draw_intrah = is_intrarange_enabled
can_draw_intral = is_intrarange_enabled
can_draw_intram = is_intram_enabled
pricearray := array.new_float(0)
labelarray := array.new_label(0)
/////////////////////////////////
if is_londonrange_enabled
//label.new(bar_index,high)
london_limit_right = get_limit_right(DEFAULT_EXTEND_RIGHT)
if displayStyle == 'Right Anchored'
londontime := get_limit_right(radistance)
londontime
var londonh_line = line.new(x1=londontime, x2=london_limit_right, y1=flondonhigh, y2=flondonhigh, color=LondonColor, width=DEFAULT_LINE_WIDTH, xloc=xloc.bar_time, style=linestyles)
var londonl_line = line.new(x1=londontime, x2=london_limit_right, y1=flondonlow, y2=flondonlow, color=LondonColor, width=DEFAULT_LINE_WIDTH, xloc=xloc.bar_time, style=linestyles)
var londono_line = line.new(x1=londontime, x2=london_limit_right, y1=flondonopen, y2=flondonopen, color=LondonColor, width=DEFAULT_LINE_WIDTH, xloc=xloc.bar_time, style=linestyles)
var londonh_label = label.new(x=london_limit_right, y=flondonhigh, text=lhtext, style=DEFAULT_LABEL_STYLE, textcolor=LondonColor, size=DEFAULT_LABEL_SIZE, xloc=xloc.bar_time)
var londonl_label = label.new(x=london_limit_right, y=flondonlow, text=lltext, style=DEFAULT_LABEL_STYLE, textcolor=LondonColor, size=DEFAULT_LABEL_SIZE, xloc=xloc.bar_time)
var londono_label = label.new(x=london_limit_right, y=flondonopen, text=lotext, style=DEFAULT_LABEL_STYLE, textcolor=LondonColor, size=DEFAULT_LABEL_SIZE, xloc=xloc.bar_time)
line.set_x1(londonh_line, londontime)
line.set_x2(londonh_line, london_limit_right)
line.set_y1(londonh_line, flondonhigh)
line.set_y2(londonh_line, flondonhigh)
line.set_x1(londonl_line, londontime)
line.set_x2(londonl_line, london_limit_right)
line.set_y1(londonl_line, flondonlow)
line.set_y2(londonl_line, flondonlow)
line.set_x1(londono_line, londontime)
line.set_x2(londono_line, london_limit_right)
line.set_y1(londono_line, flondonopen)
line.set_y2(londono_line, flondonopen)
label.set_x(londonh_label, london_limit_right)
label.set_y(londonh_label, flondonhigh)
label.set_text(londonh_label, lhtext)
label.set_x(londonl_label, london_limit_right)
label.set_y(londonl_label, flondonlow)
label.set_text(londonl_label, lltext)
label.set_x(londono_label, london_limit_right)
label.set_y(londono_label, flondonopen)
label.set_text(londono_label, lotext)
if mergebool
f_LevelMerge(pricearray, labelarray, flondonhigh, londonh_label, LondonColor)
f_LevelMerge(pricearray, labelarray, flondonlow, londonl_label, LondonColor)
f_LevelMerge(pricearray, labelarray, flondonopen, londono_label, LondonColor)
//////////////////////////////////////////////////////////////////////////////////
/////////////////////////////////
if is_usrange_enabled
//label.new(bar_index,high)
us_limit_right = get_limit_right(DEFAULT_EXTEND_RIGHT)
if displayStyle == 'Right Anchored'
ustime := get_limit_right(radistance)
ustime
var ush_line = line.new(x1=ustime, x2=us_limit_right, y1=fushigh, y2=fushigh, color=USColor, width=DEFAULT_LINE_WIDTH, xloc=xloc.bar_time, style=linestyles)
var usl_line = line.new(x1=ustime, x2=us_limit_right, y1=fuslow, y2=fuslow, color=USColor, width=DEFAULT_LINE_WIDTH, xloc=xloc.bar_time, style=linestyles)
var uso_line = line.new(x1=ustime, x2=us_limit_right, y1=fusopen, y2=fusopen, color=USColor, width=DEFAULT_LINE_WIDTH, xloc=xloc.bar_time, style=linestyles)
var ush_label = label.new(x=us_limit_right, y=fushigh, text=lhtext, style=DEFAULT_LABEL_STYLE, textcolor=USColor, size=DEFAULT_LABEL_SIZE, xloc=xloc.bar_time)
var usl_label = label.new(x=us_limit_right, y=fuslow, text=lltext, style=DEFAULT_LABEL_STYLE, textcolor=USColor, size=DEFAULT_LABEL_SIZE, xloc=xloc.bar_time)
var uso_label = label.new(x=us_limit_right, y=fusopen, text=lotext, style=DEFAULT_LABEL_STYLE, textcolor=USColor, size=DEFAULT_LABEL_SIZE, xloc=xloc.bar_time)
line.set_x1(ush_line, ustime)
line.set_x2(ush_line, us_limit_right)
line.set_y1(ush_line, fushigh)
line.set_y2(ush_line, fushigh)
line.set_x1(usl_line, ustime)
line.set_x2(usl_line, us_limit_right)
line.set_y1(usl_line, fuslow)
line.set_y2(usl_line, fuslow)
line.set_x1(uso_line, ustime)
line.set_x2(uso_line, us_limit_right)
line.set_y1(uso_line, fusopen)
line.set_y2(uso_line, fusopen)
label.set_x(ush_label, us_limit_right)
label.set_y(ush_label, fushigh)
label.set_text(ush_label, ushtext)
label.set_x(usl_label, us_limit_right)
label.set_y(usl_label, fuslow)
label.set_text(usl_label, usltext)
label.set_x(uso_label, us_limit_right)
label.set_y(uso_label, fusopen)
label.set_text(uso_label, usotext)
if mergebool
f_LevelMerge(pricearray, labelarray, fushigh, ush_label, USColor)
f_LevelMerge(pricearray, labelarray, fuslow, usl_label, USColor)
f_LevelMerge(pricearray, labelarray, fusopen, uso_label, USColor)
/////////////////////////////////
if is_asiarange_enabled
//label.new(bar_index,high)
asia_limit_right = get_limit_right(DEFAULT_EXTEND_RIGHT)
if displayStyle == 'Right Anchored'
asiatime := get_limit_right(radistance)
asiatime
var asiah_line = line.new(x1=asiatime, x2=asia_limit_right, y1=fasiahigh, y2=fasiahigh, color=AsiaColor, width=DEFAULT_LINE_WIDTH, xloc=xloc.bar_time, style=linestyles)
var asial_line = line.new(x1=asiatime, x2=asia_limit_right, y1=fasialow, y2=fasialow, color=AsiaColor, width=DEFAULT_LINE_WIDTH, xloc=xloc.bar_time, style=linestyles)
var asiao_line = line.new(x1=asiatime, x2=asia_limit_right, y1=fasiaopen, y2=fasiaopen, color=AsiaColor, width=DEFAULT_LINE_WIDTH, xloc=xloc.bar_time, style=linestyles)
var asiah_label = label.new(x=asia_limit_right, y=fasiahigh, text=asiahtext, style=DEFAULT_LABEL_STYLE, textcolor=AsiaColor, size=DEFAULT_LABEL_SIZE, xloc=xloc.bar_time)
var asial_label = label.new(x=asia_limit_right, y=fasialow, text=asialtext, style=DEFAULT_LABEL_STYLE, textcolor=AsiaColor, size=DEFAULT_LABEL_SIZE, xloc=xloc.bar_time)
var asiao_label = label.new(x=asia_limit_right, y=fasiaopen, text=asiaotext, style=DEFAULT_LABEL_STYLE, textcolor=AsiaColor, size=DEFAULT_LABEL_SIZE, xloc=xloc.bar_time)
line.set_x1(asiah_line, asiatime)
line.set_x2(asiah_line, asia_limit_right)
line.set_y1(asiah_line, fasiahigh)
line.set_y2(asiah_line, fasiahigh)
line.set_x1(asial_line, asiatime)
line.set_x2(asial_line, asia_limit_right)
line.set_y1(asial_line, fasialow)
line.set_y2(asial_line, fasialow)
line.set_x1(asiao_line, asiatime)
line.set_x2(asiao_line, asia_limit_right)
line.set_y1(asiao_line, fasiaopen)
line.set_y2(asiao_line, fasiaopen)
label.set_x(asiah_label, asia_limit_right)
label.set_y(asiah_label, fasiahigh)
label.set_text(asiah_label, asiahtext)
label.set_x(asial_label, asia_limit_right)
label.set_y(asial_label, fasialow)
label.set_text(asial_label, asialtext)
label.set_x(asiao_label, asia_limit_right)
label.set_y(asiao_label, fasiaopen)
label.set_text(asiao_label, asiaotext)
if mergebool
f_LevelMerge(pricearray, labelarray, fasiahigh, asiah_label, AsiaColor)
f_LevelMerge(pricearray, labelarray, fasialow, asial_label, AsiaColor)
f_LevelMerge(pricearray, labelarray, fasiaopen, asiao_label, AsiaColor)
//////////////////////////////////////////////////////////////////////////////////
//////////////////////////////////////////////////////////////////////////////////
if can_draw_intra
intra_limit_right = get_limit_right(DEFAULT_EXTEND_RIGHT)
if displayStyle == 'Right Anchored'
intra_time := get_limit_right(radistance)
intra_time
var intra_line = line.new(x1=intra_time, x2=intra_limit_right, y1=intra_open, y2=intra_open, color=IntraColor, width=DEFAULT_LINE_WIDTH, xloc=xloc.bar_time, style=linestyles)
var intra_label = label.new(x=intra_limit_right, y=intra_open, text=iotext, style=DEFAULT_LABEL_STYLE, textcolor=IntraColor, size=DEFAULT_LABEL_SIZE, xloc=xloc.bar_time)
line.set_x1(intra_line, intra_time)
line.set_x2(intra_line, intra_limit_right)
line.set_y1(intra_line, intra_open)
line.set_y2(intra_line, intra_open)
label.set_x(intra_label, intra_limit_right)
label.set_y(intra_label, intra_open)
label.set_text(intra_label, iotext)
if mergebool
f_LevelMerge(pricearray, labelarray, intra_open, intra_label, IntraColor)
//////////////////////////////////////////////////////////////////////////////////
//HIGH HIGH HIGH HIGH HIGH HIGH HIGH HIGH HIGH HIGH HIGH HIGH HIGH HIGH HIGH HIGH
if can_draw_intrah
intrah_limit_right = get_limit_right(DEFAULT_EXTEND_RIGHT)
if displayStyle == 'Right Anchored'
intrah_time := get_limit_right(radistance)
intrah_time
var intrah_line = line.new(x1=intrah_time, x2=intrah_limit_right, y1=intrah_open, y2=intrah_open, color=IntraColor, width=DEFAULT_LINE_WIDTH, xloc=xloc.bar_time, style=linestyles)
var intrah_label = label.new(x=intrah_limit_right, y=intrah_open, text=pihtext, style=DEFAULT_LABEL_STYLE, textcolor=IntraColor, size=DEFAULT_LABEL_SIZE, xloc=xloc.bar_time)
line.set_x1(intrah_line, intrah_time)
line.set_x2(intrah_line, intrah_limit_right)
line.set_y1(intrah_line, intrah_open)
line.set_y2(intrah_line, intrah_open)
label.set_x(intrah_label, intrah_limit_right)
label.set_y(intrah_label, intrah_open)
label.set_text(intrah_label, pihtext)
if mergebool
f_LevelMerge(pricearray, labelarray, intrah_open, intrah_label, IntraColor)
//////////////////////////////////////////////////////////////////////////////////
//LOW LOW LOW LOW LOW LOW LOW LOW LOW LOW LOW LOW LOW LOW LOW LOW
if can_draw_intral
intral_limit_right = get_limit_right(DEFAULT_EXTEND_RIGHT)
if displayStyle == 'Right Anchored'
intral_time := get_limit_right(radistance)
intral_time
var intral_line = line.new(x1=intral_time, x2=intral_limit_right, y1=intral_open, y2=intral_open, color=IntraColor, width=DEFAULT_LINE_WIDTH, xloc=xloc.bar_time, style=linestyles)
var intral_label = label.new(x=intral_limit_right, y=intral_open, text=piltext, style=DEFAULT_LABEL_STYLE, textcolor=IntraColor, size=DEFAULT_LABEL_SIZE, xloc=xloc.bar_time)
line.set_x1(intral_line, intral_time)
line.set_x2(intral_line, intral_limit_right)
line.set_y1(intral_line, intral_open)
line.set_y2(intral_line, intral_open)
label.set_x(intral_label, intral_limit_right)
label.set_y(intral_label, intral_open)
label.set_text(intral_label, piltext)
if mergebool
f_LevelMerge(pricearray, labelarray, intral_open, intral_label, IntraColor)
///////////////////////////////////////////////////////////////////////////////
if can_draw_intram
intram_limit_right = get_limit_right(DEFAULT_EXTEND_RIGHT)
intram_time = intrah_time
intram_open = (intral_open + intrah_open) / 2
if displayStyle == 'Right Anchored'
intram_time := get_limit_right(radistance)
intram_time
var intram_line = line.new(x1=intram_time, x2=intram_limit_right, y1=intram_open, y2=intram_open, color=IntraColor, width=DEFAULT_LINE_WIDTH, xloc=xloc.bar_time, style=linestyles)
var intram_label = label.new(x=intram_limit_right, y=intram_open, text=pimtext, style=DEFAULT_LABEL_STYLE, textcolor=IntraColor, size=DEFAULT_LABEL_SIZE, xloc=xloc.bar_time)
line.set_x1(intram_line, intram_time)
line.set_x2(intram_line, intram_limit_right)
line.set_y1(intram_line, intram_open)
line.set_y2(intram_line, intram_open)
label.set_x(intram_label, intram_limit_right)
label.set_y(intram_label, intram_open)
label.set_text(intram_label, pimtext)
if mergebool
f_LevelMerge(pricearray, labelarray, intram_open, intram_label, IntraColor)
////////////////////////////////////////// MONDAY
if is_monday_enabled
monday_limit_right = get_limit_right(DEFAULT_EXTEND_RIGHT)
if displayStyle == 'Right Anchored'
monday_time := get_limit_right(radistance)
monday_time
var monday_line = line.new(x1=monday_time, x2=monday_limit_right, y1=monday_high, y2=monday_high, color=MondayColor, width=DEFAULT_LINE_WIDTH, xloc=xloc.bar_time, style=linestyles)
var monday_label = label.new(x=monday_limit_right, y=monday_high, text=pmonhtext, style=DEFAULT_LABEL_STYLE, textcolor=MondayColor, size=DEFAULT_LABEL_SIZE, xloc=xloc.bar_time)
line.set_x1(monday_line, monday_time)
line.set_x2(monday_line, monday_limit_right)
line.set_y1(monday_line, monday_high)
line.set_y2(monday_line, monday_high)
label.set_x(monday_label, monday_limit_right)
label.set_y(monday_label, monday_high)
label.set_text(monday_label, pmonhtext)
if mergebool
f_LevelMerge(pricearray, labelarray, monday_high, monday_label, MondayColor)
if is_monday_enabled
monday_limit_right = get_limit_right(DEFAULT_EXTEND_RIGHT)
if displayStyle == 'Right Anchored'
monday_time := get_limit_right(radistance)
monday_time
var monday_low_line = line.new(x1=monday_time, x2=monday_limit_right, y1=monday_low, y2=monday_low, color=MondayColor, width=DEFAULT_LINE_WIDTH, xloc=xloc.bar_time, style=linestyles)
var monday_low_label = label.new(x=monday_limit_right, y=monday_low, text=pmonltext, style=DEFAULT_LABEL_STYLE, textcolor=MondayColor, size=DEFAULT_LABEL_SIZE, xloc=xloc.bar_time)
line.set_x1(monday_low_line, monday_time)
line.set_x2(monday_low_line, monday_limit_right)
line.set_y1(monday_low_line, monday_low)
line.set_y2(monday_low_line, monday_low)
label.set_x(monday_low_label, monday_limit_right)
label.set_y(monday_low_label, monday_low)
label.set_text(monday_low_label, pmonltext)
if mergebool
f_LevelMerge(pricearray, labelarray, monday_low, monday_low_label, MondayColor)
if is_monday_mid
mondaym_limit_right = get_limit_right(DEFAULT_EXTEND_RIGHT)
mondaym_open = (monday_high + monday_low) / 2
if displayStyle == 'Right Anchored'
monday_time := get_limit_right(radistance)
monday_time
var mondaym_line = line.new(x1=monday_time, x2=mondaym_limit_right, y1=mondaym_open, y2=mondaym_open, color=MondayColor, width=DEFAULT_LINE_WIDTH, xloc=xloc.bar_time, style=linestyles)
var mondaym_label = label.new(x=mondaym_limit_right, y=mondaym_open, text=pmonmtext, style=DEFAULT_LABEL_STYLE, textcolor=MondayColor, size=DEFAULT_LABEL_SIZE, xloc=xloc.bar_time)
line.set_x1(mondaym_line, monday_time)
line.set_x2(mondaym_line, mondaym_limit_right)
line.set_y1(mondaym_line, mondaym_open)
line.set_y2(mondaym_line, mondaym_open)
label.set_x(mondaym_label, mondaym_limit_right)
label.set_y(mondaym_label, mondaym_open)
label.set_text(mondaym_label, pmonmtext)
if mergebool
f_LevelMerge(pricearray, labelarray, mondaym_open, mondaym_label, MondayColor)
//////////////////////////////////////////////////////////////////////////////////
////////////////////////DAILY OPEN DAILY OPEN DAILY OPEN DAILY OPEN DAILY OPEN DAILY OPEN DAILY OPEN
if is_daily_enabled
daily_limit_right = get_limit_right(DEFAULT_EXTEND_RIGHT)
if displayStyle == 'Right Anchored'
daily_time := get_limit_right(radistance)
daily_time
var daily_line = line.new(x1=daily_time, x2=daily_limit_right, y1=daily_open, y2=daily_open, color=DailyColor, width=DEFAULT_LINE_WIDTH, xloc=xloc.bar_time, style=linestyles)
var daily_label = label.new(x=daily_limit_right, y=daily_open, text=dotext, style=DEFAULT_LABEL_STYLE, textcolor=DailyColor, size=DEFAULT_LABEL_SIZE, xloc=xloc.bar_time)
line.set_x1(daily_line, daily_time)
line.set_x2(daily_line, daily_limit_right)
line.set_y1(daily_line, daily_open)
line.set_y2(daily_line, daily_open)
label.set_x(daily_label, daily_limit_right)
label.set_y(daily_label, daily_open)
label.set_text(daily_label, dotext)
if mergebool
f_LevelMerge(pricearray, labelarray, daily_open, daily_label, DailyColor)
//////////////////////////////////////////////////////////////////////////////////
//////////////////DAILY HIGH DAILY HIGH DAILY HIGH DAILY HIGH DAILY HIGH DAILY HIGH DAILY HIGH
if is_dailyrange_enabled
dailyh_limit_right = get_limit_right(DEFAULT_EXTEND_RIGHT)
if displayStyle == 'Right Anchored'
dailyh_time := get_limit_right(radistance)
dailyh_time
// draw tails before lines for better visual
var dailyh_line = line.new(x1=dailyh_time, x2=dailyh_limit_right, y1=dailyh_open, y2=dailyh_open, color=DailyColor, width=DEFAULT_LINE_WIDTH, xloc=xloc.bar_time, style=linestyles)
var dailyh_label = label.new(x=dailyh_limit_right, y=dailyh_open, text=pdhtext, style=DEFAULT_LABEL_STYLE, textcolor=DailyColor, size=DEFAULT_LABEL_SIZE, xloc=xloc.bar_time)
line.set_x1(dailyh_line, dailyh_time)
line.set_x2(dailyh_line, dailyh_limit_right)
line.set_y1(dailyh_line, dailyh_open)
line.set_y2(dailyh_line, dailyh_open)
label.set_x(dailyh_label, dailyh_limit_right)
label.set_y(dailyh_label, dailyh_open)
label.set_text(dailyh_label, pdhtext)
if mergebool
f_LevelMerge(pricearray, labelarray, dailyh_open, dailyh_label, DailyColor)
//////////////////////////////////////////////////////////////////////////////////
//////////////////DAILY LOW DAILY LOW DAILY LOW DAILY LOW DAILY LOW DAILY LOW DAILY LOW DAILY LOW
if is_dailyrange_enabled
dailyl_limit_right = get_limit_right(DEFAULT_EXTEND_RIGHT)
if displayStyle == 'Right Anchored'
dailyl_time := get_limit_right(radistance)
dailyl_time
var dailyl_line = line.new(x1=dailyl_time, x2=dailyl_limit_right, y1=dailyl_open, y2=dailyl_open, color=DailyColor, width=DEFAULT_LINE_WIDTH, xloc=xloc.bar_time, style=linestyles)
var dailyl_label = label.new(x=dailyl_limit_right, y=dailyl_open, text=pdltext, style=DEFAULT_LABEL_STYLE, textcolor=DailyColor, size=DEFAULT_LABEL_SIZE, xloc=xloc.bar_time)
line.set_x1(dailyl_line, dailyl_time)
line.set_x2(dailyl_line, dailyl_limit_right)
line.set_y1(dailyl_line, dailyl_open)
line.set_y2(dailyl_line, dailyl_open)
label.set_x(dailyl_label, dailyl_limit_right)
label.set_y(dailyl_label, dailyl_open)
label.set_text(dailyl_label, pdltext)
if mergebool
f_LevelMerge(pricearray, labelarray, dailyl_open, dailyl_label, DailyColor)
//////////////////////////////////////////////////////////////////////////////// Daily MID
if is_dailym_enabled
dailym_limit_right = get_limit_right(DEFAULT_EXTEND_RIGHT)
dailym_time = dailyh_time
dailym_open = (dailyl_open + dailyh_open) / 2
if displayStyle == 'Right Anchored'
dailym_time := get_limit_right(radistance)
dailym_time
var dailym_line = line.new(x1=dailym_time, x2=dailym_limit_right, y1=dailym_open, y2=dailym_open, color=DailyColor, width=DEFAULT_LINE_WIDTH, xloc=xloc.bar_time, style=linestyles)
var dailym_label = label.new(x=dailym_limit_right, y=dailym_open, text=pdmtext, style=DEFAULT_LABEL_STYLE, textcolor=DailyColor, size=DEFAULT_LABEL_SIZE, xloc=xloc.bar_time)
line.set_x1(dailym_line, dailym_time)
line.set_x2(dailym_line, dailym_limit_right)
line.set_y1(dailym_line, dailym_open)
line.set_y2(dailym_line, dailym_open)
label.set_x(dailym_label, dailym_limit_right)
label.set_y(dailym_label, dailym_open)
label.set_text(dailym_label, pdmtext)
if mergebool
f_LevelMerge(pricearray, labelarray, dailym_open, dailym_label, DailyColor)
//////////////////////////////////////////////////////////////////////////////////
if is_weekly_enabled
weekly_limit_right = get_limit_right(DEFAULT_EXTEND_RIGHT)
cweekly_time = weekly_time
if displayStyle == 'Right Anchored'
cweekly_time := get_limit_right(radistance)
cweekly_time
var weekly_line = line.new(x1=cweekly_time, x2=weekly_limit_right, y1=weekly_open, y2=weekly_open, color=WeeklyColor, width=DEFAULT_LINE_WIDTH, xloc=xloc.bar_time, style=linestyles)
var weekly_label = label.new(x=weekly_limit_right, y=weekly_open, text=wotext, style=DEFAULT_LABEL_STYLE, textcolor=WeeklyColor, size=DEFAULT_LABEL_SIZE, xloc=xloc.bar_time)
line.set_x1(weekly_line, cweekly_time)
line.set_x2(weekly_line, weekly_limit_right)
line.set_y1(weekly_line, weekly_open)
line.set_y2(weekly_line, weekly_open)
label.set_x(weekly_label, weekly_limit_right)
label.set_y(weekly_label, weekly_open)
label.set_text(weekly_label, wotext)
if mergebool
f_LevelMerge(pricearray, labelarray, weekly_open, weekly_label, WeeklyColor)
// the weekly open can be the daily open too (monday)
// only the weekly will be draw, in these case we update its label
// if is_weekly_open and can_show_daily
// label.set_text(weekly_label, "DO / WO ")
//////////////////////////////////////////////////////////////////////////////////
////////////////////////////////////////////////////////////////////////////////// WEEKLY HIGH WEEKLY HIGH WEEKLY HIGH
if is_weeklyrange_enabled
weeklyh_limit_right = get_limit_right(DEFAULT_EXTEND_RIGHT)
if displayStyle == 'Right Anchored'
weeklyh_time := get_limit_right(radistance)
weeklyh_time
var weeklyh_line = line.new(x1=weeklyh_time, x2=weeklyh_limit_right, y1=weeklyh_open, y2=weeklyh_open, color=WeeklyColor, width=DEFAULT_LINE_WIDTH, xloc=xloc.bar_time, style=linestyles)
var weeklyh_label = label.new(x=weeklyh_limit_right, y=weeklyh_open, text=pwhtext, style=DEFAULT_LABEL_STYLE, textcolor=WeeklyColor, size=DEFAULT_LABEL_SIZE, xloc=xloc.bar_time)
line.set_x1(weeklyh_line, weeklyh_time)
line.set_x2(weeklyh_line, weeklyh_limit_right)
line.set_y1(weeklyh_line, weeklyh_open)
line.set_y2(weeklyh_line, weeklyh_open)
label.set_x(weeklyh_label, weeklyh_limit_right)
label.set_y(weeklyh_label, weeklyh_open)
label.set_text(weeklyh_label, pwhtext)
if mergebool
f_LevelMerge(pricearray, labelarray, weeklyh_open, weeklyh_label, WeeklyColor)
//////////////////////////////////////////////////////////////////////////////////
////////////////////////////////////////////////////////////////////////////////// WEEKLY LOW WEEKLY LOW WEEKLY LOW
if is_weeklyrange_enabled
weeklyl_limit_right = get_limit_right(DEFAULT_EXTEND_RIGHT)
if displayStyle == 'Right Anchored'
weeklyl_time := get_limit_right(radistance)
weeklyl_time
var weeklyl_line = line.new(x1=weeklyl_time, x2=weeklyl_limit_right, y1=weekly_open, y2=weekly_open, color=WeeklyColor, width=DEFAULT_LINE_WIDTH, xloc=xloc.bar_time, style=linestyles)
var weeklyl_label = label.new(x=weeklyl_limit_right, y=weeklyl_open, text=pwltext, style=DEFAULT_LABEL_STYLE, textcolor=WeeklyColor, size=DEFAULT_LABEL_SIZE, xloc=xloc.bar_time)
line.set_x1(weeklyl_line, weeklyl_time)
line.set_x2(weeklyl_line, weeklyl_limit_right)
line.set_y1(weeklyl_line, weeklyl_open)
line.set_y2(weeklyl_line, weeklyl_open)
label.set_x(weeklyl_label, weeklyl_limit_right)
label.set_y(weeklyl_label, weeklyl_open)
label.set_text(weeklyl_label, pwltext)
if mergebool
f_LevelMerge(pricearray, labelarray, weeklyl_open, weeklyl_label, WeeklyColor)
//////////////////////////////////////////////////////////////////////////////////
//////////////////////////////////////////////////////////////////////////////// Weekly MID
if is_weekly_mid
weeklym_limit_right = get_limit_right(DEFAULT_EXTEND_RIGHT)
weeklym_time = weeklyh_time
weeklym_open = (weeklyl_open + weeklyh_open) / 2
if displayStyle == 'Right Anchored'
weeklym_time := get_limit_right(radistance)
weeklym_time
var weeklym_line = line.new(x1=weeklym_time, x2=weeklym_limit_right, y1=weeklym_open, y2=weeklym_open, color=WeeklyColor, width=DEFAULT_LINE_WIDTH, xloc=xloc.bar_time, style=linestyles)
var weeklym_label = label.new(x=weeklym_limit_right, y=weeklym_open, text=pwmtext, style=DEFAULT_LABEL_STYLE, textcolor=WeeklyColor, size=DEFAULT_LABEL_SIZE, xloc=xloc.bar_time)
line.set_x1(weeklym_line, weeklym_time)
line.set_x2(weeklym_line, weeklym_limit_right)
line.set_y1(weeklym_line, weeklym_open)
line.set_y2(weeklym_line, weeklym_open)
label.set_x(weeklym_label, weeklym_limit_right)
label.set_y(weeklym_label, weeklym_open)
label.set_text(weeklym_label, pwmtext)
if mergebool
f_LevelMerge(pricearray, labelarray, weeklym_open, weeklym_label, WeeklyColor)
////////////////////////////////////////////////////////////////////////////////// YEEEAARRLLYY LOW LOW LOW
if is_yearlyrange_enabled
yearlyl_limit_right = get_limit_right(DEFAULT_EXTEND_RIGHT)
if displayStyle == 'Right Anchored'
yearlyl_time := get_limit_right(radistance)
yearlyl_time
var yearlyl_line = line.new(x1=yearlyl_time, x2=yearlyl_limit_right, y1=yearlyl_open, y2=yearlyl_open, color=YearlyColor, width=DEFAULT_LINE_WIDTH, xloc=xloc.bar_time, style=linestyles)
var yearlyl_label = label.new(x=yearlyl_limit_right, y=yearlyl_open, text=cyltext, style=DEFAULT_LABEL_STYLE, textcolor=YearlyColor, size=DEFAULT_LABEL_SIZE, xloc=xloc.bar_time)
line.set_x1(yearlyl_line, yearlyl_time)
line.set_x2(yearlyl_line, yearlyl_limit_right)
line.set_y1(yearlyl_line, yearlyl_open)
line.set_y2(yearlyl_line, yearlyl_open)
label.set_x(yearlyl_label, yearlyl_limit_right)
label.set_y(yearlyl_label, yearlyl_open)
label.set_text(yearlyl_label, cyltext)
if mergebool
f_LevelMerge(pricearray, labelarray, yearlyl_open, yearlyl_label, YearlyColor)
//////////////////////////////////////////////////////////////////////////////////
////////////////////////////////////////////////////////////////////////////////// YEEEAARRLLYY HIGH HIGH HIGH
if is_yearlyrange_enabled
yearlyh_limit_right = get_limit_right(DEFAULT_EXTEND_RIGHT)
if displayStyle == 'Right Anchored'
yearlyh_time := get_limit_right(radistance)
yearlyh_time
var yearlyh_line = line.new(x1=yearlyh_time, x2=yearlyh_limit_right, y1=yearlyh_open, y2=yearlyh_open, color=YearlyColor, width=DEFAULT_LINE_WIDTH, xloc=xloc.bar_time, style=linestyles)
var yearlyh_label = label.new(x=yearlyh_limit_right, y=yearlyh_open, text=cyhtext, style=DEFAULT_LABEL_STYLE, textcolor=YearlyColor, size=DEFAULT_LABEL_SIZE, xloc=xloc.bar_time)
line.set_x1(yearlyh_line, yearlyh_time)
line.set_x2(yearlyh_line, yearlyh_limit_right)
line.set_y1(yearlyh_line, yearlyh_open)
line.set_y2(yearlyh_line, yearlyh_open)
label.set_x(yearlyh_label, yearlyh_limit_right)
label.set_y(yearlyh_label, yearlyh_open)
label.set_text(yearlyh_label, cyhtext)
if mergebool
f_LevelMerge(pricearray, labelarray, yearlyh_open, yearlyh_label, YearlyColor)
//////////////////////////////////////////////////////////////////////////////////
////////////////////////////////////////////////////////////////////////////////// YEEEAARRLLYY OPEN
if is_yearly_enabled
yearly_limit_right = get_limit_right(DEFAULT_EXTEND_RIGHT)
if displayStyle == 'Right Anchored'
yearly_time := get_limit_right(radistance)
yearly_time
var yearly_line = line.new(x1=yearly_time, x2=yearly_limit_right, y1=yearly_open, y2=yearly_open, color=YearlyColor, width=DEFAULT_LINE_WIDTH, xloc=xloc.bar_time, style=linestyles)
var yearly_label = label.new(x=yearly_limit_right, y=yearly_open, text=yotext, style=DEFAULT_LABEL_STYLE, textcolor=YearlyColor, size=DEFAULT_LABEL_SIZE, xloc=xloc.bar_time)
line.set_x1(yearly_line, yearly_time)
line.set_x2(yearly_line, yearly_limit_right)
line.set_y1(yearly_line, yearly_open)
line.set_y2(yearly_line, yearly_open)
label.set_x(yearly_label, yearly_limit_right)
label.set_y(yearly_label, yearly_open)
label.set_text(yearly_label, yotext)
if mergebool
f_LevelMerge(pricearray, labelarray, yearly_open, yearly_label, YearlyColor)
//////////////////////////////////////////////////////////////////////////////////
//////////////////////////////////////////////////////////////////////////////// yearly MID
if is_yearly_mid
yearlym_limit_right = get_limit_right(DEFAULT_EXTEND_RIGHT)
yearlym_time = yearlyh_time
yearlym_open = (yearlyl_open + yearlyh_open) / 2
if displayStyle == 'Right Anchored'
yearlym_time := get_limit_right(radistance)
yearlym_time
var yearlym_line = line.new(x1=yearlym_time, x2=yearlym_limit_right, y1=yearlym_open, y2=yearlym_open, color=YearlyColor, width=DEFAULT_LINE_WIDTH, xloc=xloc.bar_time, style=linestyles)
var yearlym_label = label.new(x=yearlym_limit_right, y=yearlym_open, text=cymtext, style=DEFAULT_LABEL_STYLE, textcolor=YearlyColor, size=DEFAULT_LABEL_SIZE, xloc=xloc.bar_time)
line.set_x1(yearlym_line, yearlym_time)
line.set_x2(yearlym_line, yearlym_limit_right)
line.set_y1(yearlym_line, yearlym_open)
line.set_y2(yearlym_line, yearlym_open)
label.set_x(yearlym_label, yearlym_limit_right)
label.set_y(yearlym_label, yearlym_open)
label.set_text(yearlym_label, cymtext)
if mergebool
f_LevelMerge(pricearray, labelarray, yearlym_open, yearlym_label, YearlyColor)
////////////////////////////////////////////////////////////////////////////////// QUATERLLYYYYY OPEN
if is_quarterly_enabled
quarterly_limit_right = get_limit_right(DEFAULT_EXTEND_RIGHT)
if displayStyle == 'Right Anchored'
quarterly_time := get_limit_right(radistance)
quarterly_time
var quarterly_line = line.new(x1=quarterly_time, x2=quarterly_limit_right, y1=quarterly_open, y2=quarterly_open, color=quarterlyColor, width=DEFAULT_LINE_WIDTH, xloc=xloc.bar_time, style=linestyles)
var quarterly_label = label.new(x=quarterly_limit_right, y=quarterly_open, text=qotext, style=DEFAULT_LABEL_STYLE, textcolor=quarterlyColor, size=DEFAULT_LABEL_SIZE, xloc=xloc.bar_time)
line.set_x1(quarterly_line, quarterly_time)
line.set_x2(quarterly_line, quarterly_limit_right)
line.set_y1(quarterly_line, quarterly_open)
line.set_y2(quarterly_line, quarterly_open)
label.set_x(quarterly_label, quarterly_limit_right)
label.set_y(quarterly_label, quarterly_open)
label.set_text(quarterly_label, qotext)
if mergebool
f_LevelMerge(pricearray, labelarray, quarterly_open, quarterly_label, quarterlyColor)
//////////////////////////////////////////////////////////////////////////////////
////////////////////////////////////////////////////////////////////////////////// QUATERLLYYYYY High
if is_quarterlyrange_enabled
quarterlyh_limit_right = get_limit_right(DEFAULT_EXTEND_RIGHT)
if displayStyle == 'Right Anchored'
quarterlyh_time := get_limit_right(radistance)
quarterlyh_time
var quarterlyh_line = line.new(x1=quarterlyh_time, x2=quarterlyh_limit_right, y1=quarterlyh_open, y2=quarterlyh_open, color=quarterlyColor, width=DEFAULT_LINE_WIDTH, xloc=xloc.bar_time, style=linestyles)
var quarterlyh_label = label.new(x=quarterlyh_limit_right, y=quarterlyh_open, text=pqhtext, style=DEFAULT_LABEL_STYLE, textcolor=quarterlyColor, size=DEFAULT_LABEL_SIZE, xloc=xloc.bar_time)
line.set_x1(quarterlyh_line, quarterlyh_time)
line.set_x2(quarterlyh_line, quarterlyh_limit_right)
line.set_y1(quarterlyh_line, quarterlyh_open)
line.set_y2(quarterlyh_line, quarterlyh_open)
label.set_x(quarterlyh_label, quarterlyh_limit_right)
label.set_y(quarterlyh_label, quarterlyh_open)
label.set_text(quarterlyh_label, pqhtext)
if mergebool
f_LevelMerge(pricearray, labelarray, quarterlyh_open, quarterlyh_label, quarterlyColor)
//////////////////////////////////////////////////////////////////////////////////
////////////////////////////////////////////////////////////////////////////////// QUATERLLYYYYY Low
if is_quarterlyrange_enabled
quarterlyl_limit_right = get_limit_right(DEFAULT_EXTEND_RIGHT)
if displayStyle == 'Right Anchored'
quarterlyl_time := get_limit_right(radistance)
quarterlyl_time
var quarterlyl_line = line.new(x1=quarterlyl_time, x2=quarterlyl_limit_right, y1=quarterlyl_open, y2=quarterlyl_open, color=quarterlyColor, width=DEFAULT_LINE_WIDTH, xloc=xloc.bar_time, style=linestyles)
var quarterlyl_label = label.new(x=quarterlyl_limit_right, y=quarterlyl_open, text=pqltext, style=DEFAULT_LABEL_STYLE, textcolor=quarterlyColor, size=DEFAULT_LABEL_SIZE, xloc=xloc.bar_time)
line.set_x1(quarterlyl_line, quarterlyl_time)
line.set_x2(quarterlyl_line, quarterlyl_limit_right)
line.set_y1(quarterlyl_line, quarterlyl_open)
line.set_y2(quarterlyl_line, quarterlyl_open)
label.set_x(quarterlyl_label, quarterlyl_limit_right)
label.set_y(quarterlyl_label, quarterlyl_open)
label.set_text(quarterlyl_label, pqltext)
if mergebool
f_LevelMerge(pricearray, labelarray, quarterlyl_open, quarterlyl_label, quarterlyColor)
//////////////////////////////////////////////////////////////////////////////////
//////////////////////////////////////////////////////////////////////////////// QUATERLLYYYYY MID
if is_quarterly_mid
quarterlym_limit_right = get_limit_right(DEFAULT_EXTEND_RIGHT)
quarterlym_time = quarterlyh_time
quarterlym_open = (quarterlyl_open + quarterlyh_open) / 2
if displayStyle == 'Right Anchored'
quarterlym_time := get_limit_right(radistance)
quarterlym_time
var quarterlym_line = line.new(x1=quarterlym_time, x2=quarterlym_limit_right, y1=quarterlym_open, y2=quarterlym_open, color=quarterlyColor, width=DEFAULT_LINE_WIDTH, xloc=xloc.bar_time, style=linestyles)
var quarterlym_label = label.new(x=quarterlym_limit_right, y=quarterlym_open, text=pqmtext, style=DEFAULT_LABEL_STYLE, textcolor=quarterlyColor, size=DEFAULT_LABEL_SIZE, xloc=xloc.bar_time)
line.set_x1(quarterlym_line, quarterlym_time)
line.set_x2(quarterlym_line, quarterlym_limit_right)
line.set_y1(quarterlym_line, quarterlym_open)
line.set_y2(quarterlym_line, quarterlym_open)
label.set_x(quarterlym_label, quarterlym_limit_right)
label.set_y(quarterlym_label, quarterlym_open)
label.set_text(quarterlym_label, pqmtext)
if mergebool
f_LevelMerge(pricearray, labelarray, quarterlym_open, quarterlym_label, quarterlyColor)
////////////////////////////////////////////////////////////////////////////////// Monthly LOW LOW LOW
if is_monthlyrange_enabled
monthlyl_limit_right = get_limit_right(DEFAULT_EXTEND_RIGHT)
if displayStyle == 'Right Anchored'
monthlyl_time := get_limit_right(radistance)
monthlyl_time
var monthlyl_line = line.new(x1=monthlyl_time, x2=monthlyl_limit_right, y1=monthlyl_open, y2=monthlyl_open, color=MonthlyColor, width=DEFAULT_LINE_WIDTH, xloc=xloc.bar_time, style=linestyles)
var monthlyl_label = label.new(x=monthlyl_limit_right, y=monthlyl_open, text=pmltext, style=DEFAULT_LABEL_STYLE, textcolor=MonthlyColor, size=DEFAULT_LABEL_SIZE, xloc=xloc.bar_time)
line.set_x1(monthlyl_line, monthlyl_time)
line.set_x2(monthlyl_line, monthlyl_limit_right)
line.set_y1(monthlyl_line, monthlyl_open)
line.set_y2(monthlyl_line, monthlyl_open)
label.set_x(monthlyl_label, monthlyl_limit_right)
label.set_y(monthlyl_label, monthlyl_open)
label.set_text(monthlyl_label, pmltext)
if mergebool
f_LevelMerge(pricearray, labelarray, monthlyl_open, monthlyl_label, MonthlyColor)
// the weekly open can be the daily open too (monday)
// only the weekly will be draw, in these case we update its label
//////////////////////////////////////////////////////////////////////////////////
////////////////////////////////////////////////////////////////////////////////// MONTHLY HIGH HIGH HIGH
if is_monthlyrange_enabled
monthlyh_limit_right = get_limit_right(DEFAULT_EXTEND_RIGHT)
if displayStyle == 'Right Anchored'
monthlyh_time := get_limit_right(radistance)
monthlyh_time
var monthlyh_line = line.new(x1=monthlyh_time, x2=monthlyh_limit_right, y1=monthlyh_open, y2=monthlyh_open, color=MonthlyColor, width=DEFAULT_LINE_WIDTH, xloc=xloc.bar_time, style=linestyles)
var monthlyh_label = label.new(x=monthlyh_limit_right, y=monthlyh_open, text=pmhtext, style=DEFAULT_LABEL_STYLE, textcolor=MonthlyColor, size=DEFAULT_LABEL_SIZE, xloc=xloc.bar_time)
line.set_x1(monthlyh_line, monthlyl_time)
line.set_x2(monthlyh_line, monthlyh_limit_right)
line.set_y1(monthlyh_line, monthlyh_open)
line.set_y2(monthlyh_line, monthlyh_open)
label.set_x(monthlyh_label, monthlyh_limit_right)
label.set_y(monthlyh_label, monthlyh_open)
label.set_text(monthlyh_label, pmhtext)
if mergebool
f_LevelMerge(pricearray, labelarray, monthlyh_open, monthlyh_label, MonthlyColor)
// the weekly open can be the daily open too (monday)
// only the weekly will be draw, in these case we update its label
//////////////////////////////////////////////////////////////////////////////// MONTHLY MID
if is_monthly_mid
monthlym_limit_right = get_limit_right(DEFAULT_EXTEND_RIGHT)
monthlym_time = monthlyh_time
monthlym_open = (monthlyl_open + monthlyh_open) / 2
if displayStyle == 'Right Anchored'
monthlym_time := get_limit_right(radistance)
monthlym_time
var monthlym_line = line.new(x1=monthlym_time, x2=monthlym_limit_right, y1=monthlym_open, y2=monthlym_open, color=MonthlyColor, width=DEFAULT_LINE_WIDTH, xloc=xloc.bar_time, style=linestyles)
var monthlym_label = label.new(x=monthlym_limit_right, y=monthlym_open, text=pmmtext, style=DEFAULT_LABEL_STYLE, textcolor=MonthlyColor, size=DEFAULT_LABEL_SIZE, xloc=xloc.bar_time)
line.set_x1(monthlym_line, monthlym_time)
line.set_x2(monthlym_line, monthlym_limit_right)
line.set_y1(monthlym_line, monthlym_open)
line.set_y2(monthlym_line, monthlym_open)
label.set_x(monthlym_label, monthlym_limit_right)
label.set_y(monthlym_label, monthlym_open)
label.set_text(monthlym_label, pmmtext)
if mergebool
f_LevelMerge(pricearray, labelarray, monthlym_open, monthlym_label, MonthlyColor)
//////////////////////////////////////////////////////////////////////////////////
if is_monthly_enabled
monthly_limit_right = get_limit_right(DEFAULT_EXTEND_RIGHT)
if displayStyle == 'Right Anchored'
monthly_time := get_limit_right(radistance)
monthly_time
var monthlyLine = line.new(x1=monthly_time, x2=monthly_limit_right, y1=monthly_open, y2=monthly_open, color=MonthlyColor, width=DEFAULT_LINE_WIDTH, xloc=xloc.bar_time, style=linestyles)
var monthlyLabel = label.new(x=monthly_limit_right, y=monthly_open, text=motext, style=DEFAULT_LABEL_STYLE, textcolor=MonthlyColor, size=DEFAULT_LABEL_SIZE, xloc=xloc.bar_time)
line.set_x1(monthlyLine, monthly_time)
line.set_x2(monthlyLine, monthly_limit_right)
line.set_y1(monthlyLine, monthly_open)
line.set_y2(monthlyLine, monthly_open)
label.set_x(monthlyLabel, monthly_limit_right)
label.set_y(monthlyLabel, monthly_open)
label.set_text(monthlyLabel, motext)
if mergebool
f_LevelMerge(pricearray, labelarray, monthly_open, monthlyLabel, MonthlyColor)
/////////////////////////////////////////////////////////////////////////////
// the monthly open can be the weekly open (monday 1st) and/or daily open too
// only the monthly will be draw, in these case we update its label
// if is_monthly_open
// if can_show_daily
// label.set_text(monthlyLabel, "DO / MO ")
// if is_weekly_open
// if can_show_weekly
// label.set_text(monthlyLabel, "WO / MO ")
// if can_show_daily and can_show_weekly
// label.set_text(monthlyLabel, "DO / WO / MO ")
// the start of the line is drew from the first week of the month
// if the first day of the weekly candle (monday) is the 2nd of the month
// we fix the start of the line position on the Prev weekly candle
if timeframe.isweekly and dayofweek(monthly_time) != dayofweek.monday
line.set_x1(monthlyLine, monthly_time - (weekly_time - weekly_time ))

Key Levels//@version=5
//@sbtnc thank you for doing the base code
//Added additional levels for convienience sake.
indicator('Key Levels SpacemanBTC IDWM', shorttitle='SpacemanBTC Key Level V13.1', overlay=true, max_lines_count=100)
//35 works
displayStyle = input.string(defval='Standard', title='Display Style', options= , inline='Display')
mergebool = input.bool(defval=true, title='Merge Levels?', inline='Display')
distanceright = input.int(defval=30, title='Distance', minval=5, maxval=500, inline='Dist')
radistance = input.int(defval=250, title='Anchor Distance', minval=5, maxval=500, inline='Dist')
labelsize = input.string(defval='Medium', title='Text Size', options= )
linesize = input.string(defval='Small', title='Line Width', options= , inline='Line')
linestyle = input.string(defval='Solid', title='Line Style', options= , inline='Line')
GlobalTextType = input.bool(defval=false, title='Global Text ShortHand', tooltip='Enable for shorthand text on all text')
var globalcoloring = input.bool(defval=false, title='Global Coloring', tooltip='Enable for all color controls via one color', inline='GC')
GlobalColor = input.color(title='', defval=color.white, inline='GC')
//var show_tails = input(defval = false, title = "Always Show", type = input.bool)
= request.security(syminfo.tickerid, 'D', , lookahead=barmerge.lookahead_on)
= request.security(syminfo.tickerid, 'D', [time , high ], lookahead=barmerge.lookahead_on)
= request.security(syminfo.tickerid, 'D', [time , low ], lookahead=barmerge.lookahead_on)
cdailyh_open = request.security(syminfo.tickerid, 'D', high, lookahead=barmerge.lookahead_on)
cdailyl_open = request.security(syminfo.tickerid, 'D', low, lookahead=barmerge.lookahead_on)
var monday_time = time
var monday_high = high
var monday_low = low
= request.security(syminfo.tickerid, 'W', , lookahead=barmerge.lookahead_on)
= request.security(syminfo.tickerid, 'W', [time , high ], lookahead=barmerge.lookahead_on)
= request.security(syminfo.tickerid, 'W', [time , low ], lookahead=barmerge.lookahead_on)
= request.security(syminfo.tickerid, 'M', , lookahead=barmerge.lookahead_on)
= request.security(syminfo.tickerid, 'M', [time , high ], lookahead=barmerge.lookahead_on)
= request.security(syminfo.tickerid, 'M', [time , low ], lookahead=barmerge.lookahead_on)
= request.security(syminfo.tickerid, '3M', , lookahead=barmerge.lookahead_on)
= request.security(syminfo.tickerid, '3M', [time , high ], lookahead=barmerge.lookahead_on)
= request.security(syminfo.tickerid, '3M', [time , low ], lookahead=barmerge.lookahead_on)
= request.security(syminfo.tickerid, '12M', , lookahead=barmerge.lookahead_on)
= request.security(syminfo.tickerid, '12M', , lookahead=barmerge.lookahead_on)
= request.security(syminfo.tickerid, '12M', , lookahead=barmerge.lookahead_on)
= request.security(syminfo.tickerid, '240', , lookahead=barmerge.lookahead_on)
= request.security(syminfo.tickerid, '240', [time , high ], lookahead=barmerge.lookahead_on)
= request.security(syminfo.tickerid, '240', [time , low ], lookahead=barmerge.lookahead_on)
//------------------------------ Inputs -------------------------------
var is_intra_enabled = input.bool(defval=false, title='Open', group='4H', inline='4H')
var is_intrarange_enabled = input.bool(defval=false, title='Prev H/L', group='4H', inline='4H')
var is_intram_enabled = input.bool(defval=false, title='Prev Mid', group='4H', inline='4H')
IntraTextType = input.bool(defval=false, title='ShortHand', group='4H', inline='4Hsh')
var is_daily_enabled = input.bool(defval=true, title='Open', group='Daily', inline='Daily')
var is_dailyrange_enabled = input.bool(defval=false, title='Prev H/L', group='Daily', inline='Daily')
var is_dailym_enabled = input.bool(defval=false, title='Prev Mid', group='Daily', inline='Daily')
DailyTextType = input.bool(defval=false, title='ShortHand', group='Daily', inline='Dailysh')
var is_monday_enabled = input.bool(defval=true, title='Range', group='Monday Range', inline='Monday')
var is_monday_mid = input.bool(defval=true, title='Mid', group='Monday Range', inline='Monday')
var untested_monday = false
MondayTextType = input.bool(defval=false, title='ShortHand', group='Monday Range', inline='Mondaysh')
var is_weekly_enabled = input.bool(defval=true, title='Open', group='Weekly', inline='Weekly')
var is_weeklyrange_enabled = input.bool(defval=true, title='Prev H/L', group='Weekly', inline='Weekly')
var is_weekly_mid = input.bool(defval=true, title='Prev Mid', group='Weekly', inline='Weekly')
WeeklyTextType = input.bool(defval=false, title='ShortHand', group='Weekly', inline='Weeklysh')
var is_monthly_enabled = input.bool(defval=true, title='Open', group='Monthly', inline='Monthly')
var is_monthlyrange_enabled = input.bool(defval=true, title='Prev H/L', group='Monthly', inline='Monthly')
var is_monthly_mid = input.bool(defval=true, title='Prev Mid', group='Monthly', inline='Monthly')
MonthlyTextType = input.bool(defval=false, title='ShortHand', group='Monthly', inline='Monthlysh')
var is_quarterly_enabled = input.bool(defval=true, title='Open', group='Quarterly', inline='Quarterly')
var is_quarterlyrange_enabled = input.bool(defval=false, title='Prev H/L', group='Quarterly', inline='Quarterly')
var is_quarterly_mid = input.bool(defval=true, title='Prev Mid', group='Quarterly', inline='Quarterly')
QuarterlyTextType = input.bool(defval=false, title='ShortHand', group='Quarterly', inline='Quarterlysh')
var is_yearly_enabled = input.bool(defval=true, title='Open', group='Yearly', inline='Yearly')
var is_yearlyrange_enabled = input.bool(defval=false, title='Current H/L', group='Yearly', inline='Yearly')
var is_yearly_mid = input.bool(defval=true, title='Mid', group='Yearly', inline='Yearly')
YearlyTextType = input.bool(defval=false, title='ShortHand', group='Yearly', inline='Yearlysh')
var is_londonrange_enabled = input.bool(defval=false, title='London Range', group='FX Sessions', inline='FX')
var is_usrange_enabled = input.bool(defval=false, title='New York Range', group='FX Sessions', inline='FX')
var is_asiarange_enabled = input.bool(defval=false, title='Asia Range', group='FX Sessions', inline='FX')
SessionTextType = input.bool(defval=false, title='ShortHand', group='FX Sessions', inline='FXColor')
Londont = input.session("0800-1600", "London Session")
USt = input.session("1400-2100", "New York Session")
Asiat = input.session("0000-0900", "Tokyo Session")
DailyColor = input.color(title='', defval=#08bcd4, group='Daily', inline='Dailysh')
MondayColor = input.color(title='', defval=color.white, group='Monday Range', inline='Mondaysh')
WeeklyColor = input.color(title='', defval=#fffcbc, group='Weekly', inline='Weeklysh')
MonthlyColor = input.color(title='', defval=#08d48c, group='Monthly', inline='Monthlysh')
YearlyColor = input.color(title='', defval=color.red, group='Yearly', inline='Yearlysh')
quarterlyColor = input.color(title='', defval=color.red, group='Quarterly', inline='Quarterlysh')
IntraColor = input.color(title='', defval=color.orange, group='4H', inline='4Hsh')
LondonColor = input.color(title='', defval=color.white, group='FX Sessions', inline='FXColor')
USColor = input.color(title='', defval=color.white, group='FX Sessions', inline='FXColor')
AsiaColor = input.color(title='', defval=color.white, group='FX Sessions', inline='FXColor')
var pdhtext = GlobalTextType or DailyTextType ? 'PDH' : 'Prev Day High'
var pdltext = GlobalTextType or DailyTextType ? 'PDL' : 'Prev Day Low'
var dotext = GlobalTextType or DailyTextType ? 'DO' : 'Daily Open'
var pdmtext = GlobalTextType or DailyTextType ? 'PDM' : 'Prev Day Mid'
var pwhtext = GlobalTextType or WeeklyTextType ? 'PWH' : 'Prev Week High'
var pwltext = GlobalTextType or WeeklyTextType ? 'PWL' : 'Prev Week Low'
var wotext = GlobalTextType or WeeklyTextType ? 'WO' : 'Weekly Open'
var pwmtext = GlobalTextType or WeeklyTextType ? 'PWM' : 'Prev Week Mid'
var pmhtext = GlobalTextType or MonthlyTextType ? 'PMH' : 'Prev Month High'
var pmltext = GlobalTextType or MonthlyTextType ? 'PML' : 'Prev Month Low'
var motext = GlobalTextType or MonthlyTextType ? 'MO' : 'Monthly Open'
var pmmtext = GlobalTextType or MonthlyTextType ? 'PMM' : 'Prev Month Mid'
var pqhtext = GlobalTextType or QuarterlyTextType ? 'PQH' : 'Prev Quarter High'
var pqltext = GlobalTextType or QuarterlyTextType ? 'PQL' : 'Prev Quarter Low'
var qotext = GlobalTextType or QuarterlyTextType ? 'QO' : 'Quarterly Open'
var pqmtext = GlobalTextType or QuarterlyTextType ? 'PQM' : 'Prev Quarter Mid'
var cyhtext = GlobalTextType or YearlyTextType ? 'CYH' : 'Current Year High'
var cyltext = GlobalTextType or YearlyTextType ? 'CYL' : 'Current Year Low'
var yotext = GlobalTextType or YearlyTextType ? 'YO' : 'Yearly Open'
var cymtext = GlobalTextType or YearlyTextType ? 'CYM' : 'Current Year Mid'
var pihtext = GlobalTextType or IntraTextType ? 'P-4H-H' : 'Prev 4H High'
var piltext = GlobalTextType or IntraTextType ? 'P-4H-L' : 'Prev 4H Low'
var iotext = GlobalTextType or IntraTextType ? '4H-O' : '4H Open'
var pimtext = GlobalTextType or IntraTextType ? 'P-4H-M' : 'Prev 4H Mid'
var pmonhtext = GlobalTextType or MondayTextType ? 'MDAY-H' : 'Monday High'
var pmonltext = GlobalTextType or MondayTextType ? 'MDAY-L' : 'Monday Low'
var pmonmtext = GlobalTextType or MondayTextType ? 'MDAY-M' : 'Monday Mid'
var lhtext = GlobalTextType or SessionTextType ? 'Lon-H' : 'London High'
var lltext = GlobalTextType or SessionTextType ? 'Lon-L' : 'London Low'
var lotext = GlobalTextType or SessionTextType ? 'Lon-O' : 'London Open'
var ushtext = GlobalTextType or SessionTextType ? 'NY-H' : 'New York High'
var usltext = GlobalTextType or SessionTextType ? 'NY-L' : 'New York Low'
var usotext = GlobalTextType or SessionTextType ? 'NY-O' : 'New York Open'
var asiahtext = GlobalTextType or SessionTextType ? 'AS-H' : 'Asia High'
var asialtext = GlobalTextType or SessionTextType ? 'AS-L' : 'Asia Low'
var asiaotext = GlobalTextType or SessionTextType ? 'AS-O' : 'Asia Open'
if globalcoloring == true
DailyColor := GlobalColor
MondayColor := GlobalColor
WeeklyColor := GlobalColor
MonthlyColor := GlobalColor
YearlyColor := GlobalColor
quarterlyColor := GlobalColor
IntraColor := GlobalColor
IntraColor
if weekly_time != weekly_time
untested_monday := false
untested_monday
if is_monday_enabled == true and untested_monday == false
untested_monday := true
monday_time := daily_time
monday_high := cdailyh_open
monday_low := cdailyl_open
monday_low
linewidthint = 1
if linesize == 'Small'
linewidthint := 1
linewidthint
if linesize == 'Medium'
linewidthint := 2
linewidthint
if linesize == 'Large'
linewidthint := 3
linewidthint
var DEFAULT_LINE_WIDTH = linewidthint
var DEFAULT_TAIL_WIDTH = linewidthint
fontsize = size.small
if labelsize == 'Small'
fontsize := size.small
fontsize
if labelsize == 'Medium'
fontsize := size.normal
fontsize
if labelsize == 'Large'
fontsize := size.large
fontsize
linestyles = line.style_solid
if linestyle == 'Dashed'
linestyles := line.style_dashed
linestyles
if linestyle == 'Dotted'
linestyles := line.style_dotted
linestyles
var DEFAULT_LABEL_SIZE = fontsize
var DEFAULT_LABEL_STYLE = label.style_none
var DEFAULT_EXTEND_RIGHT = distanceright
London = time(timeframe.period, Londont)
US = time(timeframe.period, USt)
Asia = time(timeframe.period, Asiat)
var clondonhigh = 0.0
var clondonlow = close
var londontime = time
var flondonhigh = 0.0
var flondonlow = 0.0
var flondonopen = 0.0
var onelondonfalse = false
if London
if high > clondonhigh
clondonhigh := high
clondonhigh
if low < clondonlow
clondonlow := low
clondonlow
if onelondonfalse
londontime := time
flondonopen := open
flondonopen
flondonhigh := clondonhigh
flondonlow := clondonlow
onelondonfalse := false
onelondonfalse
else
if onelondonfalse == false
flondonhigh := clondonhigh
flondonlow := clondonlow
flondonlow
onelondonfalse := true
clondonhigh := 0.0
clondonlow := close
clondonlow
//////////////////////////////////
var cushigh = 0.0
var cuslow = close
var ustime = time
var fushigh = 0.0
var fuslow = 0.0
var fusopen = 0.0
var oneusfalse = false
if US
if high > cushigh
cushigh := high
cushigh
if low < cuslow
cuslow := low
cuslow
if oneusfalse
ustime := time
fusopen := open
fusopen
fushigh := cushigh
fuslow := cuslow
oneusfalse := false
oneusfalse
else
if oneusfalse == false
fushigh := cushigh
fuslow := cuslow
fuslow
oneusfalse := true
cushigh := 0.0
cuslow := close
cuslow
//////////////////////////////////
var casiahigh = 0.0
var casialow = close
var asiatime = time
var fasiahigh = 0.0
var fasialow = 0.0
var fasiaopen = 0.0
var oneasiafalse = false
if Asia
if high > casiahigh
casiahigh := high
casiahigh
if low < casialow
casialow := low
casialow
if oneasiafalse
asiatime := time
fasiaopen := open
fasiaopen
fasiahigh := casiahigh
fasialow := casialow
oneasiafalse := false
oneasiafalse
else
if oneasiafalse == false
fasiahigh := casiahigh
fasialow := casialow
fasialow
oneasiafalse := true
casiahigh := 0.0
casialow := close
casialow
//------------------------------ Plotting ------------------------------
var pricearray = array.new_float(0)
var labelarray = array.new_label(0)
f_LevelMerge(pricearray, labelarray, currentprice, currentlabel, currentcolor) =>
if array.includes(pricearray, currentprice)
whichindex = array.indexof(pricearray, currentprice)
labelhold = array.get(labelarray, whichindex)
whichtext = label.get_text(labelhold)
label.set_text(labelhold, label.get_text(currentlabel) + ' / ' + whichtext)
label.set_text(currentlabel, '')
label.set_textcolor(labelhold, currentcolor)
else
array.push(pricearray, currentprice)
array.push(labelarray, currentlabel)
var can_show_daily = is_daily_enabled and timeframe.isintraday
var can_show_weekly = is_weekly_enabled and not timeframe.isweekly and not timeframe.ismonthly
var can_show_monthly = is_monthly_enabled and not timeframe.ismonthly
get_limit_right(bars) =>
timenow + (time - time ) * bars
// the following code doesn't need to be processed on every candle
if barstate.islast
is_weekly_open = dayofweek == dayofweek.monday
is_monthly_open = dayofmonth == 1
can_draw_daily = (is_weekly_enabled ? not is_weekly_open : true) and (is_monthly_enabled ? not is_monthly_open : true)
can_draw_weekly = is_monthly_enabled ? not(is_monthly_open and is_weekly_open) : true
can_draw_intra = is_intra_enabled
can_draw_intrah = is_intrarange_enabled
can_draw_intral = is_intrarange_enabled
can_draw_intram = is_intram_enabled
pricearray := array.new_float(0)
labelarray := array.new_label(0)
/////////////////////////////////
if is_londonrange_enabled
//label.new(bar_index,high)
london_limit_right = get_limit_right(DEFAULT_EXTEND_RIGHT)
if displayStyle == 'Right Anchored'
londontime := get_limit_right(radistance)
londontime
var londonh_line = line.new(x1=londontime, x2=london_limit_right, y1=flondonhigh, y2=flondonhigh, color=LondonColor, width=DEFAULT_LINE_WIDTH, xloc=xloc.bar_time, style=linestyles)
var londonl_line = line.new(x1=londontime, x2=london_limit_right, y1=flondonlow, y2=flondonlow, color=LondonColor, width=DEFAULT_LINE_WIDTH, xloc=xloc.bar_time, style=linestyles)
var londono_line = line.new(x1=londontime, x2=london_limit_right, y1=flondonopen, y2=flondonopen, color=LondonColor, width=DEFAULT_LINE_WIDTH, xloc=xloc.bar_time, style=linestyles)
var londonh_label = label.new(x=london_limit_right, y=flondonhigh, text=lhtext, style=DEFAULT_LABEL_STYLE, textcolor=LondonColor, size=DEFAULT_LABEL_SIZE, xloc=xloc.bar_time)
var londonl_label = label.new(x=london_limit_right, y=flondonlow, text=lltext, style=DEFAULT_LABEL_STYLE, textcolor=LondonColor, size=DEFAULT_LABEL_SIZE, xloc=xloc.bar_time)
var londono_label = label.new(x=london_limit_right, y=flondonopen, text=lotext, style=DEFAULT_LABEL_STYLE, textcolor=LondonColor, size=DEFAULT_LABEL_SIZE, xloc=xloc.bar_time)
line.set_x1(londonh_line, londontime)
line.set_x2(londonh_line, london_limit_right)
line.set_y1(londonh_line, flondonhigh)
line.set_y2(londonh_line, flondonhigh)
line.set_x1(londonl_line, londontime)
line.set_x2(londonl_line, london_limit_right)
line.set_y1(londonl_line, flondonlow)
line.set_y2(londonl_line, flondonlow)
line.set_x1(londono_line, londontime)
line.set_x2(londono_line, london_limit_right)
line.set_y1(londono_line, flondonopen)
line.set_y2(londono_line, flondonopen)
label.set_x(londonh_label, london_limit_right)
label.set_y(londonh_label, flondonhigh)
label.set_text(londonh_label, lhtext)
label.set_x(londonl_label, london_limit_right)
label.set_y(londonl_label, flondonlow)
label.set_text(londonl_label, lltext)
label.set_x(londono_label, london_limit_right)
label.set_y(londono_label, flondonopen)
label.set_text(londono_label, lotext)
if mergebool
f_LevelMerge(pricearray, labelarray, flondonhigh, londonh_label, LondonColor)
f_LevelMerge(pricearray, labelarray, flondonlow, londonl_label, LondonColor)
f_LevelMerge(pricearray, labelarray, flondonopen, londono_label, LondonColor)
//////////////////////////////////////////////////////////////////////////////////
/////////////////////////////////
if is_usrange_enabled
//label.new(bar_index,high)
us_limit_right = get_limit_right(DEFAULT_EXTEND_RIGHT)
if displayStyle == 'Right Anchored'
ustime := get_limit_right(radistance)
ustime
var ush_line = line.new(x1=ustime, x2=us_limit_right, y1=fushigh, y2=fushigh, color=USColor, width=DEFAULT_LINE_WIDTH, xloc=xloc.bar_time, style=linestyles)
var usl_line = line.new(x1=ustime, x2=us_limit_right, y1=fuslow, y2=fuslow, color=USColor, width=DEFAULT_LINE_WIDTH, xloc=xloc.bar_time, style=linestyles)
var uso_line = line.new(x1=ustime, x2=us_limit_right, y1=fusopen, y2=fusopen, color=USColor, width=DEFAULT_LINE_WIDTH, xloc=xloc.bar_time, style=linestyles)
var ush_label = label.new(x=us_limit_right, y=fushigh, text=lhtext, style=DEFAULT_LABEL_STYLE, textcolor=USColor, size=DEFAULT_LABEL_SIZE, xloc=xloc.bar_time)
var usl_label = label.new(x=us_limit_right, y=fuslow, text=lltext, style=DEFAULT_LABEL_STYLE, textcolor=USColor, size=DEFAULT_LABEL_SIZE, xloc=xloc.bar_time)
var uso_label = label.new(x=us_limit_right, y=fusopen, text=lotext, style=DEFAULT_LABEL_STYLE, textcolor=USColor, size=DEFAULT_LABEL_SIZE, xloc=xloc.bar_time)
line.set_x1(ush_line, ustime)
line.set_x2(ush_line, us_limit_right)
line.set_y1(ush_line, fushigh)
line.set_y2(ush_line, fushigh)
line.set_x1(usl_line, ustime)
line.set_x2(usl_line, us_limit_right)
line.set_y1(usl_line, fuslow)
line.set_y2(usl_line, fuslow)
line.set_x1(uso_line, ustime)
line.set_x2(uso_line, us_limit_right)
line.set_y1(uso_line, fusopen)
line.set_y2(uso_line, fusopen)
label.set_x(ush_label, us_limit_right)
label.set_y(ush_label, fushigh)
label.set_text(ush_label, ushtext)
label.set_x(usl_label, us_limit_right)
label.set_y(usl_label, fuslow)
label.set_text(usl_label, usltext)
label.set_x(uso_label, us_limit_right)
label.set_y(uso_label, fusopen)
label.set_text(uso_label, usotext)
if mergebool
f_LevelMerge(pricearray, labelarray, fushigh, ush_label, USColor)
f_LevelMerge(pricearray, labelarray, fuslow, usl_label, USColor)
f_LevelMerge(pricearray, labelarray, fusopen, uso_label, USColor)
/////////////////////////////////
if is_asiarange_enabled
//label.new(bar_index,high)
asia_limit_right = get_limit_right(DEFAULT_EXTEND_RIGHT)
if displayStyle == 'Right Anchored'
asiatime := get_limit_right(radistance)
asiatime
var asiah_line = line.new(x1=asiatime, x2=asia_limit_right, y1=fasiahigh, y2=fasiahigh, color=AsiaColor, width=DEFAULT_LINE_WIDTH, xloc=xloc.bar_time, style=linestyles)
var asial_line = line.new(x1=asiatime, x2=asia_limit_right, y1=fasialow, y2=fasialow, color=AsiaColor, width=DEFAULT_LINE_WIDTH, xloc=xloc.bar_time, style=linestyles)
var asiao_line = line.new(x1=asiatime, x2=asia_limit_right, y1=fasiaopen, y2=fasiaopen, color=AsiaColor, width=DEFAULT_LINE_WIDTH, xloc=xloc.bar_time, style=linestyles)
var asiah_label = label.new(x=asia_limit_right, y=fasiahigh, text=asiahtext, style=DEFAULT_LABEL_STYLE, textcolor=AsiaColor, size=DEFAULT_LABEL_SIZE, xloc=xloc.bar_time)
var asial_label = label.new(x=asia_limit_right, y=fasialow, text=asialtext, style=DEFAULT_LABEL_STYLE, textcolor=AsiaColor, size=DEFAULT_LABEL_SIZE, xloc=xloc.bar_time)
var asiao_label = label.new(x=asia_limit_right, y=fasiaopen, text=asiaotext, style=DEFAULT_LABEL_STYLE, textcolor=AsiaColor, size=DEFAULT_LABEL_SIZE, xloc=xloc.bar_time)
line.set_x1(asiah_line, asiatime)
line.set_x2(asiah_line, asia_limit_right)
line.set_y1(asiah_line, fasiahigh)
line.set_y2(asiah_line, fasiahigh)
line.set_x1(asial_line, asiatime)
line.set_x2(asial_line, asia_limit_right)
line.set_y1(asial_line, fasialow)
line.set_y2(asial_line, fasialow)
line.set_x1(asiao_line, asiatime)
line.set_x2(asiao_line, asia_limit_right)
line.set_y1(asiao_line, fasiaopen)
line.set_y2(asiao_line, fasiaopen)
label.set_x(asiah_label, asia_limit_right)
label.set_y(asiah_label, fasiahigh)
label.set_text(asiah_label, asiahtext)
label.set_x(asial_label, asia_limit_right)
label.set_y(asial_label, fasialow)
label.set_text(asial_label, asialtext)
label.set_x(asiao_label, asia_limit_right)
label.set_y(asiao_label, fasiaopen)
label.set_text(asiao_label, asiaotext)
if mergebool
f_LevelMerge(pricearray, labelarray, fasiahigh, asiah_label, AsiaColor)
f_LevelMerge(pricearray, labelarray, fasialow, asial_label, AsiaColor)
f_LevelMerge(pricearray, labelarray, fasiaopen, asiao_label, AsiaColor)
//////////////////////////////////////////////////////////////////////////////////
//////////////////////////////////////////////////////////////////////////////////
if can_draw_intra
intra_limit_right = get_limit_right(DEFAULT_EXTEND_RIGHT)
if displayStyle == 'Right Anchored'
intra_time := get_limit_right(radistance)
intra_time
var intra_line = line.new(x1=intra_time, x2=intra_limit_right, y1=intra_open, y2=intra_open, color=IntraColor, width=DEFAULT_LINE_WIDTH, xloc=xloc.bar_time, style=linestyles)
var intra_label = label.new(x=intra_limit_right, y=intra_open, text=iotext, style=DEFAULT_LABEL_STYLE, textcolor=IntraColor, size=DEFAULT_LABEL_SIZE, xloc=xloc.bar_time)
line.set_x1(intra_line, intra_time)
line.set_x2(intra_line, intra_limit_right)
line.set_y1(intra_line, intra_open)
line.set_y2(intra_line, intra_open)
label.set_x(intra_label, intra_limit_right)
label.set_y(intra_label, intra_open)
label.set_text(intra_label, iotext)
if mergebool
f_LevelMerge(pricearray, labelarray, intra_open, intra_label, IntraColor)
//////////////////////////////////////////////////////////////////////////////////
//HIGH HIGH HIGH HIGH HIGH HIGH HIGH HIGH HIGH HIGH HIGH HIGH HIGH HIGH HIGH HIGH
if can_draw_intrah
intrah_limit_right = get_limit_right(DEFAULT_EXTEND_RIGHT)
if displayStyle == 'Right Anchored'
intrah_time := get_limit_right(radistance)
intrah_time
var intrah_line = line.new(x1=intrah_time, x2=intrah_limit_right, y1=intrah_open, y2=intrah_open, color=IntraColor, width=DEFAULT_LINE_WIDTH, xloc=xloc.bar_time, style=linestyles)
var intrah_label = label.new(x=intrah_limit_right, y=intrah_open, text=pihtext, style=DEFAULT_LABEL_STYLE, textcolor=IntraColor, size=DEFAULT_LABEL_SIZE, xloc=xloc.bar_time)
line.set_x1(intrah_line, intrah_time)
line.set_x2(intrah_line, intrah_limit_right)
line.set_y1(intrah_line, intrah_open)
line.set_y2(intrah_line, intrah_open)
label.set_x(intrah_label, intrah_limit_right)
label.set_y(intrah_label, intrah_open)
label.set_text(intrah_label, pihtext)
if mergebool
f_LevelMerge(pricearray, labelarray, intrah_open, intrah_label, IntraColor)
//////////////////////////////////////////////////////////////////////////////////
//LOW LOW LOW LOW LOW LOW LOW LOW LOW LOW LOW LOW LOW LOW LOW LOW
if can_draw_intral
intral_limit_right = get_limit_right(DEFAULT_EXTEND_RIGHT)
if displayStyle == 'Right Anchored'
intral_time := get_limit_right(radistance)
intral_time
var intral_line = line.new(x1=intral_time, x2=intral_limit_right, y1=intral_open, y2=intral_open, color=IntraColor, width=DEFAULT_LINE_WIDTH, xloc=xloc.bar_time, style=linestyles)
var intral_label = label.new(x=intral_limit_right, y=intral_open, text=piltext, style=DEFAULT_LABEL_STYLE, textcolor=IntraColor, size=DEFAULT_LABEL_SIZE, xloc=xloc.bar_time)
line.set_x1(intral_line, intral_time)
line.set_x2(intral_line, intral_limit_right)
line.set_y1(intral_line, intral_open)
line.set_y2(intral_line, intral_open)
label.set_x(intral_label, intral_limit_right)
label.set_y(intral_label, intral_open)
label.set_text(intral_label, piltext)
if mergebool
f_LevelMerge(pricearray, labelarray, intral_open, intral_label, IntraColor)
///////////////////////////////////////////////////////////////////////////////
if can_draw_intram
intram_limit_right = get_limit_right(DEFAULT_EXTEND_RIGHT)
intram_time = intrah_time
intram_open = (intral_open + intrah_open) / 2
if displayStyle == 'Right Anchored'
intram_time := get_limit_right(radistance)
intram_time
var intram_line = line.new(x1=intram_time, x2=intram_limit_right, y1=intram_open, y2=intram_open, color=IntraColor, width=DEFAULT_LINE_WIDTH, xloc=xloc.bar_time, style=linestyles)
var intram_label = label.new(x=intram_limit_right, y=intram_open, text=pimtext, style=DEFAULT_LABEL_STYLE, textcolor=IntraColor, size=DEFAULT_LABEL_SIZE, xloc=xloc.bar_time)
line.set_x1(intram_line, intram_time)
line.set_x2(intram_line, intram_limit_right)
line.set_y1(intram_line, intram_open)
line.set_y2(intram_line, intram_open)
label.set_x(intram_label, intram_limit_right)
label.set_y(intram_label, intram_open)
label.set_text(intram_label, pimtext)
if mergebool
f_LevelMerge(pricearray, labelarray, intram_open, intram_label, IntraColor)
////////////////////////////////////////// MONDAY
if is_monday_enabled
monday_limit_right = get_limit_right(DEFAULT_EXTEND_RIGHT)
if displayStyle == 'Right Anchored'
monday_time := get_limit_right(radistance)
monday_time
var monday_line = line.new(x1=monday_time, x2=monday_limit_right, y1=monday_high, y2=monday_high, color=MondayColor, width=DEFAULT_LINE_WIDTH, xloc=xloc.bar_time, style=linestyles)
var monday_label = label.new(x=monday_limit_right, y=monday_high, text=pmonhtext, style=DEFAULT_LABEL_STYLE, textcolor=MondayColor, size=DEFAULT_LABEL_SIZE, xloc=xloc.bar_time)
line.set_x1(monday_line, monday_time)
line.set_x2(monday_line, monday_limit_right)
line.set_y1(monday_line, monday_high)
line.set_y2(monday_line, monday_high)
label.set_x(monday_label, monday_limit_right)
label.set_y(monday_label, monday_high)
label.set_text(monday_label, pmonhtext)
if mergebool
f_LevelMerge(pricearray, labelarray, monday_high, monday_label, MondayColor)
if is_monday_enabled
monday_limit_right = get_limit_right(DEFAULT_EXTEND_RIGHT)
if displayStyle == 'Right Anchored'
monday_time := get_limit_right(radistance)
monday_time
var monday_low_line = line.new(x1=monday_time, x2=monday_limit_right, y1=monday_low, y2=monday_low, color=MondayColor, width=DEFAULT_LINE_WIDTH, xloc=xloc.bar_time, style=linestyles)
var monday_low_label = label.new(x=monday_limit_right, y=monday_low, text=pmonltext, style=DEFAULT_LABEL_STYLE, textcolor=MondayColor, size=DEFAULT_LABEL_SIZE, xloc=xloc.bar_time)
line.set_x1(monday_low_line, monday_time)
line.set_x2(monday_low_line, monday_limit_right)
line.set_y1(monday_low_line, monday_low)
line.set_y2(monday_low_line, monday_low)
label.set_x(monday_low_label, monday_limit_right)
label.set_y(monday_low_label, monday_low)
label.set_text(monday_low_label, pmonltext)
if mergebool
f_LevelMerge(pricearray, labelarray, monday_low, monday_low_label, MondayColor)
if is_monday_mid
mondaym_limit_right = get_limit_right(DEFAULT_EXTEND_RIGHT)
mondaym_open = (monday_high + monday_low) / 2
if displayStyle == 'Right Anchored'
monday_time := get_limit_right(radistance)
monday_time
var mondaym_line = line.new(x1=monday_time, x2=mondaym_limit_right, y1=mondaym_open, y2=mondaym_open, color=MondayColor, width=DEFAULT_LINE_WIDTH, xloc=xloc.bar_time, style=linestyles)
var mondaym_label = label.new(x=mondaym_limit_right, y=mondaym_open, text=pmonmtext, style=DEFAULT_LABEL_STYLE, textcolor=MondayColor, size=DEFAULT_LABEL_SIZE, xloc=xloc.bar_time)
line.set_x1(mondaym_line, monday_time)
line.set_x2(mondaym_line, mondaym_limit_right)
line.set_y1(mondaym_line, mondaym_open)
line.set_y2(mondaym_line, mondaym_open)
label.set_x(mondaym_label, mondaym_limit_right)
label.set_y(mondaym_label, mondaym_open)
label.set_text(mondaym_label, pmonmtext)
if mergebool
f_LevelMerge(pricearray, labelarray, mondaym_open, mondaym_label, MondayColor)
//////////////////////////////////////////////////////////////////////////////////
////////////////////////DAILY OPEN DAILY OPEN DAILY OPEN DAILY OPEN DAILY OPEN DAILY OPEN DAILY OPEN
if is_daily_enabled
daily_limit_right = get_limit_right(DEFAULT_EXTEND_RIGHT)
if displayStyle == 'Right Anchored'
daily_time := get_limit_right(radistance)
daily_time
var daily_line = line.new(x1=daily_time, x2=daily_limit_right, y1=daily_open, y2=daily_open, color=DailyColor, width=DEFAULT_LINE_WIDTH, xloc=xloc.bar_time, style=linestyles)
var daily_label = label.new(x=daily_limit_right, y=daily_open, text=dotext, style=DEFAULT_LABEL_STYLE, textcolor=DailyColor, size=DEFAULT_LABEL_SIZE, xloc=xloc.bar_time)
line.set_x1(daily_line, daily_time)
line.set_x2(daily_line, daily_limit_right)
line.set_y1(daily_line, daily_open)
line.set_y2(daily_line, daily_open)
label.set_x(daily_label, daily_limit_right)
label.set_y(daily_label, daily_open)
label.set_text(daily_label, dotext)
if mergebool
f_LevelMerge(pricearray, labelarray, daily_open, daily_label, DailyColor)
//////////////////////////////////////////////////////////////////////////////////
//////////////////DAILY HIGH DAILY HIGH DAILY HIGH DAILY HIGH DAILY HIGH DAILY HIGH DAILY HIGH
if is_dailyrange_enabled
dailyh_limit_right = get_limit_right(DEFAULT_EXTEND_RIGHT)
if displayStyle == 'Right Anchored'
dailyh_time := get_limit_right(radistance)
dailyh_time
// draw tails before lines for better visual
var dailyh_line = line.new(x1=dailyh_time, x2=dailyh_limit_right, y1=dailyh_open, y2=dailyh_open, color=DailyColor, width=DEFAULT_LINE_WIDTH, xloc=xloc.bar_time, style=linestyles)
var dailyh_label = label.new(x=dailyh_limit_right, y=dailyh_open, text=pdhtext, style=DEFAULT_LABEL_STYLE, textcolor=DailyColor, size=DEFAULT_LABEL_SIZE, xloc=xloc.bar_time)
line.set_x1(dailyh_line, dailyh_time)
line.set_x2(dailyh_line, dailyh_limit_right)
line.set_y1(dailyh_line, dailyh_open)
line.set_y2(dailyh_line, dailyh_open)
label.set_x(dailyh_label, dailyh_limit_right)
label.set_y(dailyh_label, dailyh_open)
label.set_text(dailyh_label, pdhtext)
if mergebool
f_LevelMerge(pricearray, labelarray, dailyh_open, dailyh_label, DailyColor)
//////////////////////////////////////////////////////////////////////////////////
//////////////////DAILY LOW DAILY LOW DAILY LOW DAILY LOW DAILY LOW DAILY LOW DAILY LOW DAILY LOW
if is_dailyrange_enabled
dailyl_limit_right = get_limit_right(DEFAULT_EXTEND_RIGHT)
if displayStyle == 'Right Anchored'
dailyl_time := get_limit_right(radistance)
dailyl_time
var dailyl_line = line.new(x1=dailyl_time, x2=dailyl_limit_right, y1=dailyl_open, y2=dailyl_open, color=DailyColor, width=DEFAULT_LINE_WIDTH, xloc=xloc.bar_time, style=linestyles)
var dailyl_label = label.new(x=dailyl_limit_right, y=dailyl_open, text=pdltext, style=DEFAULT_LABEL_STYLE, textcolor=DailyColor, size=DEFAULT_LABEL_SIZE, xloc=xloc.bar_time)
line.set_x1(dailyl_line, dailyl_time)
line.set_x2(dailyl_line, dailyl_limit_right)
line.set_y1(dailyl_line, dailyl_open)
line.set_y2(dailyl_line, dailyl_open)
label.set_x(dailyl_label, dailyl_limit_right)
label.set_y(dailyl_label, dailyl_open)
label.set_text(dailyl_label, pdltext)
if mergebool
f_LevelMerge(pricearray, labelarray, dailyl_open, dailyl_label, DailyColor)
//////////////////////////////////////////////////////////////////////////////// Daily MID
if is_dailym_enabled
dailym_limit_right = get_limit_right(DEFAULT_EXTEND_RIGHT)
dailym_time = dailyh_time
dailym_open = (dailyl_open + dailyh_open) / 2
if displayStyle == 'Right Anchored'
dailym_time := get_limit_right(radistance)
dailym_time
var dailym_line = line.new(x1=dailym_time, x2=dailym_limit_right, y1=dailym_open, y2=dailym_open, color=DailyColor, width=DEFAULT_LINE_WIDTH, xloc=xloc.bar_time, style=linestyles)
var dailym_label = label.new(x=dailym_limit_right, y=dailym_open, text=pdmtext, style=DEFAULT_LABEL_STYLE, textcolor=DailyColor, size=DEFAULT_LABEL_SIZE, xloc=xloc.bar_time)
line.set_x1(dailym_line, dailym_time)
line.set_x2(dailym_line, dailym_limit_right)
line.set_y1(dailym_line, dailym_open)
line.set_y2(dailym_line, dailym_open)
label.set_x(dailym_label, dailym_limit_right)
label.set_y(dailym_label, dailym_open)
label.set_text(dailym_label, pdmtext)
if mergebool
f_LevelMerge(pricearray, labelarray, dailym_open, dailym_label, DailyColor)
//////////////////////////////////////////////////////////////////////////////////
if is_weekly_enabled
weekly_limit_right = get_limit_right(DEFAULT_EXTEND_RIGHT)
cweekly_time = weekly_time
if displayStyle == 'Right Anchored'
cweekly_time := get_limit_right(radistance)
cweekly_time
var weekly_line = line.new(x1=cweekly_time, x2=weekly_limit_right, y1=weekly_open, y2=weekly_open, color=WeeklyColor, width=DEFAULT_LINE_WIDTH, xloc=xloc.bar_time, style=linestyles)
var weekly_label = label.new(x=weekly_limit_right, y=weekly_open, text=wotext, style=DEFAULT_LABEL_STYLE, textcolor=WeeklyColor, size=DEFAULT_LABEL_SIZE, xloc=xloc.bar_time)
line.set_x1(weekly_line, cweekly_time)
line.set_x2(weekly_line, weekly_limit_right)
line.set_y1(weekly_line, weekly_open)
line.set_y2(weekly_line, weekly_open)
label.set_x(weekly_label, weekly_limit_right)
label.set_y(weekly_label, weekly_open)
label.set_text(weekly_label, wotext)
if mergebool
f_LevelMerge(pricearray, labelarray, weekly_open, weekly_label, WeeklyColor)
// the weekly open can be the daily open too (monday)
// only the weekly will be draw, in these case we update its label
// if is_weekly_open and can_show_daily
// label.set_text(weekly_label, "DO / WO ")
//////////////////////////////////////////////////////////////////////////////////
////////////////////////////////////////////////////////////////////////////////// WEEKLY HIGH WEEKLY HIGH WEEKLY HIGH
if is_weeklyrange_enabled
weeklyh_limit_right = get_limit_right(DEFAULT_EXTEND_RIGHT)
if displayStyle == 'Right Anchored'
weeklyh_time := get_limit_right(radistance)
weeklyh_time
var weeklyh_line = line.new(x1=weeklyh_time, x2=weeklyh_limit_right, y1=weeklyh_open, y2=weeklyh_open, color=WeeklyColor, width=DEFAULT_LINE_WIDTH, xloc=xloc.bar_time, style=linestyles)
var weeklyh_label = label.new(x=weeklyh_limit_right, y=weeklyh_open, text=pwhtext, style=DEFAULT_LABEL_STYLE, textcolor=WeeklyColor, size=DEFAULT_LABEL_SIZE, xloc=xloc.bar_time)
line.set_x1(weeklyh_line, weeklyh_time)
line.set_x2(weeklyh_line, weeklyh_limit_right)
line.set_y1(weeklyh_line, weeklyh_open)
line.set_y2(weeklyh_line, weeklyh_open)
label.set_x(weeklyh_label, weeklyh_limit_right)
label.set_y(weeklyh_label, weeklyh_open)
label.set_text(weeklyh_label, pwhtext)
if mergebool
f_LevelMerge(pricearray, labelarray, weeklyh_open, weeklyh_label, WeeklyColor)
//////////////////////////////////////////////////////////////////////////////////
////////////////////////////////////////////////////////////////////////////////// WEEKLY LOW WEEKLY LOW WEEKLY LOW
if is_weeklyrange_enabled
weeklyl_limit_right = get_limit_right(DEFAULT_EXTEND_RIGHT)
if displayStyle == 'Right Anchored'
weeklyl_time := get_limit_right(radistance)
weeklyl_time
var weeklyl_line = line.new(x1=weeklyl_time, x2=weeklyl_limit_right, y1=weekly_open, y2=weekly_open, color=WeeklyColor, width=DEFAULT_LINE_WIDTH, xloc=xloc.bar_time, style=linestyles)
var weeklyl_label = label.new(x=weeklyl_limit_right, y=weeklyl_open, text=pwltext, style=DEFAULT_LABEL_STYLE, textcolor=WeeklyColor, size=DEFAULT_LABEL_SIZE, xloc=xloc.bar_time)
line.set_x1(weeklyl_line, weeklyl_time)
line.set_x2(weeklyl_line, weeklyl_limit_right)
line.set_y1(weeklyl_line, weeklyl_open)
line.set_y2(weeklyl_line, weeklyl_open)
label.set_x(weeklyl_label, weeklyl_limit_right)
label.set_y(weeklyl_label, weeklyl_open)
label.set_text(weeklyl_label, pwltext)
if mergebool
f_LevelMerge(pricearray, labelarray, weeklyl_open, weeklyl_label, WeeklyColor)
//////////////////////////////////////////////////////////////////////////////////
//////////////////////////////////////////////////////////////////////////////// Weekly MID
if is_weekly_mid
weeklym_limit_right = get_limit_right(DEFAULT_EXTEND_RIGHT)
weeklym_time = weeklyh_time
weeklym_open = (weeklyl_open + weeklyh_open) / 2
if displayStyle == 'Right Anchored'
weeklym_time := get_limit_right(radistance)
weeklym_time
var weeklym_line = line.new(x1=weeklym_time, x2=weeklym_limit_right, y1=weeklym_open, y2=weeklym_open, color=WeeklyColor, width=DEFAULT_LINE_WIDTH, xloc=xloc.bar_time, style=linestyles)
var weeklym_label = label.new(x=weeklym_limit_right, y=weeklym_open, text=pwmtext, style=DEFAULT_LABEL_STYLE, textcolor=WeeklyColor, size=DEFAULT_LABEL_SIZE, xloc=xloc.bar_time)
line.set_x1(weeklym_line, weeklym_time)
line.set_x2(weeklym_line, weeklym_limit_right)
line.set_y1(weeklym_line, weeklym_open)
line.set_y2(weeklym_line, weeklym_open)
label.set_x(weeklym_label, weeklym_limit_right)
label.set_y(weeklym_label, weeklym_open)
label.set_text(weeklym_label, pwmtext)
if mergebool
f_LevelMerge(pricearray, labelarray, weeklym_open, weeklym_label, WeeklyColor)
////////////////////////////////////////////////////////////////////////////////// YEEEAARRLLYY LOW LOW LOW
if is_yearlyrange_enabled
yearlyl_limit_right = get_limit_right(DEFAULT_EXTEND_RIGHT)
if displayStyle == 'Right Anchored'
yearlyl_time := get_limit_right(radistance)
yearlyl_time
var yearlyl_line = line.new(x1=yearlyl_time, x2=yearlyl_limit_right, y1=yearlyl_open, y2=yearlyl_open, color=YearlyColor, width=DEFAULT_LINE_WIDTH, xloc=xloc.bar_time, style=linestyles)
var yearlyl_label = label.new(x=yearlyl_limit_right, y=yearlyl_open, text=cyltext, style=DEFAULT_LABEL_STYLE, textcolor=YearlyColor, size=DEFAULT_LABEL_SIZE, xloc=xloc.bar_time)
line.set_x1(yearlyl_line, yearlyl_time)
line.set_x2(yearlyl_line, yearlyl_limit_right)
line.set_y1(yearlyl_line, yearlyl_open)
line.set_y2(yearlyl_line, yearlyl_open)
label.set_x(yearlyl_label, yearlyl_limit_right)
label.set_y(yearlyl_label, yearlyl_open)
label.set_text(yearlyl_label, cyltext)
if mergebool
f_LevelMerge(pricearray, labelarray, yearlyl_open, yearlyl_label, YearlyColor)
//////////////////////////////////////////////////////////////////////////////////
////////////////////////////////////////////////////////////////////////////////// YEEEAARRLLYY HIGH HIGH HIGH
if is_yearlyrange_enabled
yearlyh_limit_right = get_limit_right(DEFAULT_EXTEND_RIGHT)
if displayStyle == 'Right Anchored'
yearlyh_time := get_limit_right(radistance)
yearlyh_time
var yearlyh_line = line.new(x1=yearlyh_time, x2=yearlyh_limit_right, y1=yearlyh_open, y2=yearlyh_open, color=YearlyColor, width=DEFAULT_LINE_WIDTH, xloc=xloc.bar_time, style=linestyles)
var yearlyh_label = label.new(x=yearlyh_limit_right, y=yearlyh_open, text=cyhtext, style=DEFAULT_LABEL_STYLE, textcolor=YearlyColor, size=DEFAULT_LABEL_SIZE, xloc=xloc.bar_time)
line.set_x1(yearlyh_line, yearlyh_time)
line.set_x2(yearlyh_line, yearlyh_limit_right)
line.set_y1(yearlyh_line, yearlyh_open)
line.set_y2(yearlyh_line, yearlyh_open)
label.set_x(yearlyh_label, yearlyh_limit_right)
label.set_y(yearlyh_label, yearlyh_open)
label.set_text(yearlyh_label, cyhtext)
if mergebool
f_LevelMerge(pricearray, labelarray, yearlyh_open, yearlyh_label, YearlyColor)
//////////////////////////////////////////////////////////////////////////////////
////////////////////////////////////////////////////////////////////////////////// YEEEAARRLLYY OPEN
if is_yearly_enabled
yearly_limit_right = get_limit_right(DEFAULT_EXTEND_RIGHT)
if displayStyle == 'Right Anchored'
yearly_time := get_limit_right(radistance)
yearly_time
var yearly_line = line.new(x1=yearly_time, x2=yearly_limit_right, y1=yearly_open, y2=yearly_open, color=YearlyColor, width=DEFAULT_LINE_WIDTH, xloc=xloc.bar_time, style=linestyles)
var yearly_label = label.new(x=yearly_limit_right, y=yearly_open, text=yotext, style=DEFAULT_LABEL_STYLE, textcolor=YearlyColor, size=DEFAULT_LABEL_SIZE, xloc=xloc.bar_time)
line.set_x1(yearly_line, yearly_time)
line.set_x2(yearly_line, yearly_limit_right)
line.set_y1(yearly_line, yearly_open)
line.set_y2(yearly_line, yearly_open)
label.set_x(yearly_label, yearly_limit_right)
label.set_y(yearly_label, yearly_open)
label.set_text(yearly_label, yotext)
if mergebool
f_LevelMerge(pricearray, labelarray, yearly_open, yearly_label, YearlyColor)
//////////////////////////////////////////////////////////////////////////////////
//////////////////////////////////////////////////////////////////////////////// yearly MID
if is_yearly_mid
yearlym_limit_right = get_limit_right(DEFAULT_EXTEND_RIGHT)
yearlym_time = yearlyh_time
yearlym_open = (yearlyl_open + yearlyh_open) / 2
if displayStyle == 'Right Anchored'
yearlym_time := get_limit_right(radistance)
yearlym_time
var yearlym_line = line.new(x1=yearlym_time, x2=yearlym_limit_right, y1=yearlym_open, y2=yearlym_open, color=YearlyColor, width=DEFAULT_LINE_WIDTH, xloc=xloc.bar_time, style=linestyles)
var yearlym_label = label.new(x=yearlym_limit_right, y=yearlym_open, text=cymtext, style=DEFAULT_LABEL_STYLE, textcolor=YearlyColor, size=DEFAULT_LABEL_SIZE, xloc=xloc.bar_time)
line.set_x1(yearlym_line, yearlym_time)
line.set_x2(yearlym_line, yearlym_limit_right)
line.set_y1(yearlym_line, yearlym_open)
line.set_y2(yearlym_line, yearlym_open)
label.set_x(yearlym_label, yearlym_limit_right)
label.set_y(yearlym_label, yearlym_open)
label.set_text(yearlym_label, cymtext)
if mergebool
f_LevelMerge(pricearray, labelarray, yearlym_open, yearlym_label, YearlyColor)
////////////////////////////////////////////////////////////////////////////////// QUATERLLYYYYY OPEN
if is_quarterly_enabled
quarterly_limit_right = get_limit_right(DEFAULT_EXTEND_RIGHT)
if displayStyle == 'Right Anchored'
quarterly_time := get_limit_right(radistance)
quarterly_time
var quarterly_line = line.new(x1=quarterly_time, x2=quarterly_limit_right, y1=quarterly_open, y2=quarterly_open, color=quarterlyColor, width=DEFAULT_LINE_WIDTH, xloc=xloc.bar_time, style=linestyles)
var quarterly_label = label.new(x=quarterly_limit_right, y=quarterly_open, text=qotext, style=DEFAULT_LABEL_STYLE, textcolor=quarterlyColor, size=DEFAULT_LABEL_SIZE, xloc=xloc.bar_time)
line.set_x1(quarterly_line, quarterly_time)
line.set_x2(quarterly_line, quarterly_limit_right)
line.set_y1(quarterly_line, quarterly_open)
line.set_y2(quarterly_line, quarterly_open)
label.set_x(quarterly_label, quarterly_limit_right)
label.set_y(quarterly_label, quarterly_open)
label.set_text(quarterly_label, qotext)
if mergebool
f_LevelMerge(pricearray, labelarray, quarterly_open, quarterly_label, quarterlyColor)
//////////////////////////////////////////////////////////////////////////////////
////////////////////////////////////////////////////////////////////////////////// QUATERLLYYYYY High
if is_quarterlyrange_enabled
quarterlyh_limit_right = get_limit_right(DEFAULT_EXTEND_RIGHT)
if displayStyle == 'Right Anchored'
quarterlyh_time := get_limit_right(radistance)
quarterlyh_time
var quarterlyh_line = line.new(x1=quarterlyh_time, x2=quarterlyh_limit_right, y1=quarterlyh_open, y2=quarterlyh_open, color=quarterlyColor, width=DEFAULT_LINE_WIDTH, xloc=xloc.bar_time, style=linestyles)
var quarterlyh_label = label.new(x=quarterlyh_limit_right, y=quarterlyh_open, text=pqhtext, style=DEFAULT_LABEL_STYLE, textcolor=quarterlyColor, size=DEFAULT_LABEL_SIZE, xloc=xloc.bar_time)
line.set_x1(quarterlyh_line, quarterlyh_time)
line.set_x2(quarterlyh_line, quarterlyh_limit_right)
line.set_y1(quarterlyh_line, quarterlyh_open)
line.set_y2(quarterlyh_line, quarterlyh_open)
label.set_x(quarterlyh_label, quarterlyh_limit_right)
label.set_y(quarterlyh_label, quarterlyh_open)
label.set_text(quarterlyh_label, pqhtext)
if mergebool
f_LevelMerge(pricearray, labelarray, quarterlyh_open, quarterlyh_label, quarterlyColor)
//////////////////////////////////////////////////////////////////////////////////
////////////////////////////////////////////////////////////////////////////////// QUATERLLYYYYY Low
if is_quarterlyrange_enabled
quarterlyl_limit_right = get_limit_right(DEFAULT_EXTEND_RIGHT)
if displayStyle == 'Right Anchored'
quarterlyl_time := get_limit_right(radistance)
quarterlyl_time
var quarterlyl_line = line.new(x1=quarterlyl_time, x2=quarterlyl_limit_right, y1=quarterlyl_open, y2=quarterlyl_open, color=quarterlyColor, width=DEFAULT_LINE_WIDTH, xloc=xloc.bar_time, style=linestyles)
var quarterlyl_label = label.new(x=quarterlyl_limit_right, y=quarterlyl_open, text=pqltext, style=DEFAULT_LABEL_STYLE, textcolor=quarterlyColor, size=DEFAULT_LABEL_SIZE, xloc=xloc.bar_time)
line.set_x1(quarterlyl_line, quarterlyl_time)
line.set_x2(quarterlyl_line, quarterlyl_limit_right)
line.set_y1(quarterlyl_line, quarterlyl_open)
line.set_y2(quarterlyl_line, quarterlyl_open)
label.set_x(quarterlyl_label, quarterlyl_limit_right)
label.set_y(quarterlyl_label, quarterlyl_open)
label.set_text(quarterlyl_label, pqltext)
if mergebool
f_LevelMerge(pricearray, labelarray, quarterlyl_open, quarterlyl_label, quarterlyColor)
//////////////////////////////////////////////////////////////////////////////////
//////////////////////////////////////////////////////////////////////////////// QUATERLLYYYYY MID
if is_quarterly_mid
quarterlym_limit_right = get_limit_right(DEFAULT_EXTEND_RIGHT)
quarterlym_time = quarterlyh_time
quarterlym_open = (quarterlyl_open + quarterlyh_open) / 2
if displayStyle == 'Right Anchored'
quarterlym_time := get_limit_right(radistance)
quarterlym_time
var quarterlym_line = line.new(x1=quarterlym_time, x2=quarterlym_limit_right, y1=quarterlym_open, y2=quarterlym_open, color=quarterlyColor, width=DEFAULT_LINE_WIDTH, xloc=xloc.bar_time, style=linestyles)
var quarterlym_label = label.new(x=quarterlym_limit_right, y=quarterlym_open, text=pqmtext, style=DEFAULT_LABEL_STYLE, textcolor=quarterlyColor, size=DEFAULT_LABEL_SIZE, xloc=xloc.bar_time)
line.set_x1(quarterlym_line, quarterlym_time)
line.set_x2(quarterlym_line, quarterlym_limit_right)
line.set_y1(quarterlym_line, quarterlym_open)
line.set_y2(quarterlym_line, quarterlym_open)
label.set_x(quarterlym_label, quarterlym_limit_right)
label.set_y(quarterlym_label, quarterlym_open)
label.set_text(quarterlym_label, pqmtext)
if mergebool
f_LevelMerge(pricearray, labelarray, quarterlym_open, quarterlym_label, quarterlyColor)
////////////////////////////////////////////////////////////////////////////////// Monthly LOW LOW LOW
if is_monthlyrange_enabled
monthlyl_limit_right = get_limit_right(DEFAULT_EXTEND_RIGHT)
if displayStyle == 'Right Anchored'
monthlyl_time := get_limit_right(radistance)
monthlyl_time
var monthlyl_line = line.new(x1=monthlyl_time, x2=monthlyl_limit_right, y1=monthlyl_open, y2=monthlyl_open, color=MonthlyColor, width=DEFAULT_LINE_WIDTH, xloc=xloc.bar_time, style=linestyles)
var monthlyl_label = label.new(x=monthlyl_limit_right, y=monthlyl_open, text=pmltext, style=DEFAULT_LABEL_STYLE, textcolor=MonthlyColor, size=DEFAULT_LABEL_SIZE, xloc=xloc.bar_time)
line.set_x1(monthlyl_line, monthlyl_time)
line.set_x2(monthlyl_line, monthlyl_limit_right)
line.set_y1(monthlyl_line, monthlyl_open)
line.set_y2(monthlyl_line, monthlyl_open)
label.set_x(monthlyl_label, monthlyl_limit_right)
label.set_y(monthlyl_label, monthlyl_open)
label.set_text(monthlyl_label, pmltext)
if mergebool
f_LevelMerge(pricearray, labelarray, monthlyl_open, monthlyl_label, MonthlyColor)
// the weekly open can be the daily open too (monday)
// only the weekly will be draw, in these case we update its label
//////////////////////////////////////////////////////////////////////////////////
////////////////////////////////////////////////////////////////////////////////// MONTHLY HIGH HIGH HIGH
if is_monthlyrange_enabled
monthlyh_limit_right = get_limit_right(DEFAULT_EXTEND_RIGHT)
if displayStyle == 'Right Anchored'
monthlyh_time := get_limit_right(radistance)
monthlyh_time
var monthlyh_line = line.new(x1=monthlyh_time, x2=monthlyh_limit_right, y1=monthlyh_open, y2=monthlyh_open, color=MonthlyColor, width=DEFAULT_LINE_WIDTH, xloc=xloc.bar_time, style=linestyles)
var monthlyh_label = label.new(x=monthlyh_limit_right, y=monthlyh_open, text=pmhtext, style=DEFAULT_LABEL_STYLE, textcolor=MonthlyColor, size=DEFAULT_LABEL_SIZE, xloc=xloc.bar_time)
line.set_x1(monthlyh_line, monthlyl_time)
line.set_x2(monthlyh_line, monthlyh_limit_right)
line.set_y1(monthlyh_line, monthlyh_open)
line.set_y2(monthlyh_line, monthlyh_open)
label.set_x(monthlyh_label, monthlyh_limit_right)
label.set_y(monthlyh_label, monthlyh_open)
label.set_text(monthlyh_label, pmhtext)
if mergebool
f_LevelMerge(pricearray, labelarray, monthlyh_open, monthlyh_label, MonthlyColor)
// the weekly open can be the daily open too (monday)
// only the weekly will be draw, in these case we update its label
//////////////////////////////////////////////////////////////////////////////// MONTHLY MID
if is_monthly_mid
monthlym_limit_right = get_limit_right(DEFAULT_EXTEND_RIGHT)
monthlym_time = monthlyh_time
monthlym_open = (monthlyl_open + monthlyh_open) / 2
if displayStyle == 'Right Anchored'
monthlym_time := get_limit_right(radistance)
monthlym_time
var monthlym_line = line.new(x1=monthlym_time, x2=monthlym_limit_right, y1=monthlym_open, y2=monthlym_open, color=MonthlyColor, width=DEFAULT_LINE_WIDTH, xloc=xloc.bar_time, style=linestyles)
var monthlym_label = label.new(x=monthlym_limit_right, y=monthlym_open, text=pmmtext, style=DEFAULT_LABEL_STYLE, textcolor=MonthlyColor, size=DEFAULT_LABEL_SIZE, xloc=xloc.bar_time)
line.set_x1(monthlym_line, monthlym_time)
line.set_x2(monthlym_line, monthlym_limit_right)
line.set_y1(monthlym_line, monthlym_open)
line.set_y2(monthlym_line, monthlym_open)
label.set_x(monthlym_label, monthlym_limit_right)
label.set_y(monthlym_label, monthlym_open)
label.set_text(monthlym_label, pmmtext)
if mergebool
f_LevelMerge(pricearray, labelarray, monthlym_open, monthlym_label, MonthlyColor)
//////////////////////////////////////////////////////////////////////////////////
if is_monthly_enabled
monthly_limit_right = get_limit_right(DEFAULT_EXTEND_RIGHT)
if displayStyle == 'Right Anchored'
monthly_time := get_limit_right(radistance)
monthly_time
var monthlyLine = line.new(x1=monthly_time, x2=monthly_limit_right, y1=monthly_open, y2=monthly_open, color=MonthlyColor, width=DEFAULT_LINE_WIDTH, xloc=xloc.bar_time, style=linestyles)
var monthlyLabel = label.new(x=monthly_limit_right, y=monthly_open, text=motext, style=DEFAULT_LABEL_STYLE, textcolor=MonthlyColor, size=DEFAULT_LABEL_SIZE, xloc=xloc.bar_time)
line.set_x1(monthlyLine, monthly_time)
line.set_x2(monthlyLine, monthly_limit_right)
line.set_y1(monthlyLine, monthly_open)
line.set_y2(monthlyLine, monthly_open)
label.set_x(monthlyLabel, monthly_limit_right)
label.set_y(monthlyLabel, monthly_open)
label.set_text(monthlyLabel, motext)
if mergebool
f_LevelMerge(pricearray, labelarray, monthly_open, monthlyLabel, MonthlyColor)
/////////////////////////////////////////////////////////////////////////////
// the monthly open can be the weekly open (monday 1st) and/or daily open too
// only the monthly will be draw, in these case we update its label
// if is_monthly_open
// if can_show_daily
// label.set_text(monthlyLabel, "DO / MO ")
// if is_weekly_open
// if can_show_weekly
// label.set_text(monthlyLabel, "WO / MO ")
// if can_show_daily and can_show_weekly
// label.set_text(monthlyLabel, "DO / WO / MO ")
// the start of the line is drew from the first week of the month
// if the first day of the weekly candle (monday) is the 2nd of the month
// we fix the start of the line position on the Prev weekly candle
if timeframe.isweekly and dayofweek(monthly_time) != dayofweek.monday
line.set_x1(monthlyLine, monthly_time - (weekly_time - weekly_time ))

Scalp Boost LONG✦ Overview
Scalp Boost LONG is a visual tool designed to highlight potential short-term upward impulses.
A signal is generated only when multiple market conditions align at the candle close, combining momentum dynamics, local probability shifts, and abnormal volume behavior.
The indicator does not repaint.
✦ Concept
The tool focuses on selective situations where the market shows signs of micro-breakout potential.
If all internal conditions are confirmed — a LONG event is displayed.
If not — the chart remains clean.
This builds a low-noise signal model, prioritizing quality over frequency.
✦ Signal Logic
The LONG signal requires confirmation of all core conditions:
• Local impulse dynamics
Identifies short-term acceleration suggesting a breakout from a compressed price structure.
• Probability beyond a statistical zone
Uses relative breakout probability instead of fixed levels, checking whether price exceeds expected local ranges.
• Abnormal volume activity
Highlights candles with monetary flow above a custom threshold, signaling increased market interest.
• Anti-overheat filter
Conditions avoiding exhausted or low-momentum phases where continuation is less likely.
Only when all filters are aligned a LONG marker appears.
✦ Visual Structure
The chart display is intentionally minimal:
• ROC Curve
Subdued line, showing short-term momentum without distraction.
• LONG Marker
Green triangle below the candle on confirmed events.
• Candle Highlight
Soft background highlight on the signal bar.
• Volume Marker
Small red dot at the bottom of candles with abnormal monetary flow.
All visual elements appear only on candle close.
✦ Alerts
A clean event structure is available for notifications:
LONG Signal
This allows receiving alerts during chart analysis or in automated workflows while keeping full control over decision-making.
✦ Notes & Guidelines
This tool:
is not a trading system,
does not provide targets or stops,
may trigger against the dominant trend,
should be combined with the user’s own methodology.
Signals are rare by design.
Do not interpret each event as a trend continuation — it highlights conditions, not outcomes.
✦ Suggested Use
-(Non-mandatory ideas for advanced users)
-identifying potential micro-breakouts,
-timing entries around volume spikes,
-adding context to scalping models,
-filtering impulsive moves from noise.
-suitable for a 5-minute timeframe
The indicator can be helpful as a confirmation layer, not a standalone decision tool.

Custom ORB (Adjust Time, Color, + Alerts)Set Opening Range Break Out for whatever time range you choose for current day only. 15 min, 30 min etc. You can add alerts on ORB High Low and change color of Lines.

Мой скриптinputs:
window(1),
type(0), // 0: close, 1: high low, 2: fractals up down, 3: new fractals
persistent(False),
exittype(1),
nbars(160),
adxthres(40),
nstop(3000);
vars:
currentSwingLow(0),
currentSwingHigh(0),
trailStructureValid(false),
downFractal(0),
upFractal(0),
breakStructureHigh(0),
breakStructureLow(0),
BoS_H(0),
BoS_L(0),
Regime(0),
Last_BoS_L(0),
Last_BoS_H(0),
PeakfilterX(false);
BoS(window,persistent,type,Bos_H,BoS_L,upFractal,downFractal,breakStructureHigh,breakStructureLow);
//BOS Regime
If BoS_H <> 0 then begin
Regime = 1; // Bullish
Last_BoS_H = BoS_H ;
end;
If BoS_L <> 0 Then begin
Regime = -1; // Bearish
Last_BoS_L = BoS_L ;
end;
//Entry Logic: if we are in BoS regime then wait for break swing to entry
if ADX(5) of data2 < adxthres then begin
if time>900 and Regime = 1 and EntriesToday(date)= 0 and Last_BoS_H upFractal then buy next bar at market;
end;
if time>900 and EntriesToday(date)= 0 and Regime = -1 and Last_BoS_L>downFractal then
begin
if close < downFractal then sellshort next bar at market;
end;
end;
// Exits: nbars or stoploss or at the end of the day
if marketposition <> 0 and barssinceentry >nbars then begin
sell next bar at market;
buytocover next bar at market;
end;
setstoploss(nstop);
setexitonclose;

ICT Asian & London Range + First Presented FVGIndicator: ICT Sessions + First Presented FVG
What it does: This tool automates the markup of key ICT (Inner Circle Trader) timeframes and entry signals. It allows you to trade on higher timeframes (like the 5m or 15m) while the script automatically "looks inside" the 1-minute chart to find specific setups for you.
Key Features:
Session Ranges (Asian & London)
Automatically highlights the Asian Session (8 PM - Midnight NY) and London Open (2 AM - 5 AM NY).
Draws a shaded box for the session's High and Low.
New: Extends the High and Low lines to 4:00 PM NY (end of the trading day) so you can use them as liquidity targets.
The "First Presented" FVG (Sniper Logic)
It detects the very first Fair Value Gap (FVG) that forms on the 1-minute chart immediately after a session starts.
It draws this 1-minute gap on your current chart, regardless of what timeframe you are viewing.
The FVG box automatically extends to the end of the trading day (4 PM NY), showing you where price might return to "mitigate" or react later in the day.

SPX EMAs - Bala//@version=5
indicator("SPX EMAs", overlay = true)
// Inputs
ema8 = ta.ema(close, 8)
ema21 = ta.ema(close, 21)
ema50 = ta.ema(close, 50)
ema200 = ta.ema(close, 200)
// Plot EMAs
plot(ema8, "EMA 8", color=color.new(color.green, 0), linewidth=2)
plot(ema21, "EMA 21", color=color.new(color.orange, 0), linewidth=2)
plot(ema50, "EMA 50", color=color.new(color.blue, 0), linewidth=2)
plot(ema200,"EMA 200",color=color.new(color.red, 0), linewidth=2)

Key Support and ResistanceKEY SUPPORT AND RESISTANCE - USER GUIDE
========================================
OVERVIEW
This indicator automatically identifies and displays key support and resistance levels based on swing highs and swing lows. It uses pivot point detection to mark significant price levels where the market has previously shown reactions, helping traders identify potential entry/exit points and key decision zones.
KEY FEATURES
• Automatic Level Detection: Identifies swing highs (resistance) and swing lows (support) using pivot point analysis
• Dynamic Line Management: Displays only recent levels within a specified lookback period to keep charts clean
• Auto-Extending Lines: Projects support/resistance levels forward to anticipate future price interactions
• Color-Coded Levels: Red lines for resistance, green lines for support for easy visual identification
========================================
PARAMETERS
========================================
Left Bars (Default: 10)
• Minimum: 5 bars
• Number of bars to the left of the pivot point
• Higher values = more significant levels but fewer signals
• Lower values = more sensitive detection but may include minor swings
Right Bars (Default: 10)
• Minimum: 5 bars
• Number of bars to the right of the pivot point
• Must be confirmed by price action before the level is drawn
• Balances between confirmation delay and signal accuracy
Show Last N Bars (Default: 200)
• Minimum: 10 bars
• Only displays support/resistance levels detected within the most recent N bars
• Keeps your chart clean by removing outdated levels
• Adjust based on your trading timeframe and style
Line Extension Length (Default: 48)
• Minimum: 1 bar
• How many bars forward the support/resistance lines extend
• Helps visualize potential future price interactions
• Longer extensions useful for swing trading, shorter for day trading
========================================
HOW TO USE
========================================
FOR SWING TRADERS
1. Use default settings (10/10) or increase to 15/15 for more significant levels
2. Set "Show Last N Bars" to 300-500 to capture longer-term levels
3. Look for price reactions when approaching these levels
4. Combine with volume analysis for confirmation
FOR DAY TRADERS
1. Consider reducing Left/Right Bars to 7-8 for more frequent signals
2. Set "Show Last N Bars" to 100-150 to focus on recent action
3. Reduce "Line Extension Length" to 20-30 bars
4. Watch for intraday bounces or breakouts at these levels
TRADING STRATEGIES
Bounce Trading (Mean Reversion)
• Enter long when price approaches green support lines
• Enter short when price approaches red resistance lines
• Use stop loss just beyond the support/resistance level
• Best in ranging or consolidating markets
Breakout Trading (Trend Following)
• Wait for price to break through resistance (bullish) or support (bearish)
• Confirm with increased volume
• Previous resistance becomes new support (and vice versa)
• Best in trending markets
Multi-Timeframe Analysis
• Check higher timeframe levels for major support/resistance zones
• Use lower timeframe levels for precise entry/exit timing
• Confluence of multiple timeframe levels creates strong zones
========================================
IMPORTANT NOTES
========================================
Line Confirmation Delay
• Lines appear with a delay equal to "Right Bars" parameter
• This delay ensures the pivot point is confirmed
• Real-time level detection requires price action confirmation
Chart Clarity
• Maximum 500 lines can be displayed (TradingView limitation)
• Adjust "Show Last N Bars" if chart becomes too cluttered
• Old lines automatically delete when outside the lookback period
False Signals
• Not all support/resistance levels will hold
• Use additional confirmation (volume, candlestick patterns, other indicators)
• Markets can break through levels, especially during high-impact news
BEST PRACTICES
1. Combine with Other Analysis: Use alongside trend indicators, volume, and price action patterns
2. Context Matters: Consider overall market trend and structure
3. Risk Management: Always use stop losses; don't rely solely on S/R levels
4. Market Conditions: More effective in liquid, actively traded markets
5. Backtesting: Test settings on your specific instrument and timeframe before live trading
TROUBLESHOOTING
Too Many Lines?
• Increase "Left Bars" and "Right Bars" values
• Decrease "Show Last N Bars" value
Too Few Lines?
• Decrease "Left Bars" and "Right Bars" values
• Increase "Show Last N Bars" value
Lines Not Appearing?
• Ensure sufficient price data is loaded on your chart
• Check that "Right Bars" have passed since the last swing point
• Verify indicator is properly loaded (refresh if needed)
TECHNICAL DETAILS
• Uses ta.pivothigh() and ta.pivotlow() functions for level detection
• Implements array-based line management for efficient rendering
• Automatic cleanup of outdated lines to maintain performance
• Overlay indicator - displays directly on price chart
Disclaimer: This indicator is for educational and informational purposes only. It does not constitute financial advice. Always conduct your own research and risk assessment before making trading decisions.
========================================
中文使用指南
========================================
概述
本指標自動識別並顯示基於波段高點和低點的關鍵支撐阻力位。使用樞軸點檢測標記市場先前反應的重要價格水平,幫助交易者識別潛在的進出場點和關鍵決策區域。
主要功能
• 自動水平檢測:使用樞軸點分析識別波段高點(阻力)和波段低點(支撐)
• 動態線條管理:僅顯示指定回看期內的近期水平,保持圖表清晰
• 自動延伸線條:將支撐阻力水平向前投影,預測未來價格互動
• 顏色編碼:紅線表示阻力,綠線表示支撐,便於視覺識別
========================================
參數說明
========================================
左側K棒數(預設:10)
• 最小值:5根K棒
• 樞軸點左側的K棒數量
• 數值越高 = 水平越重要但訊號越少
• 數值越低 = 檢測更敏感但可能包含次要波動
右側K棒數(預設:10)
• 最小值:5根K棒
• 樞軸點右側的K棒數量
• 必須經過價格行為確認後才繪製水平
• 在確認延遲和訊號準確性之間取得平衡
顯示最近N根K棒內的點(預設:200)
• 最小值:10根K棒
• 僅顯示最近N根K棒內檢測到的支撐阻力水平
• 透過移除過時水平保持圖表清晰
• 根據您的交易時間框架和風格調整
線條延伸長度(預設:48)
• 最小值:1根K棒
• 支撐阻力線向前延伸的K棒數
• 幫助視覺化潛在的未來價格互動
• 較長延伸適合波段交易,較短適合當沖交易
========================================
使用方法
========================================
波段交易者
1. 使用預設設定(10/10)或增加至15/15以獲得更重要的水平
2. 將「顯示最近N根K棒」設為300-500以捕捉長期水平
3. 觀察價格接近這些水平時的反應
4. 結合成交量分析進行確認
當沖交易者
1. 考慮將左右側K棒減少至7-8以獲得更頻繁的訊號
2. 將「顯示最近N根K棒」設為100-150以專注於近期行情
3. 將「線條延伸長度」減少至20-30根K棒
4. 觀察日內在這些水平的反彈或突破
交易策略
反彈交易(均值回歸)
• 當價格接近綠色支撐線時做多
• 當價格接近紅色阻力線時做空
• 在支撐阻力水平之外設置止損
• 在區間或盤整市場中效果最佳
突破交易(趨勢跟隨)
• 等待價格突破阻力(看漲)或支撐(看跌)
• 以增加的成交量確認
• 先前的阻力成為新的支撐(反之亦然)
• 在趨勢市場中效果最佳
多時間框架分析
• 檢查更高時間框架的主要支撐阻力區域
• 使用較低時間框架進行精確的進出場時機
• 多個時間框架水平的匯合創造強大區域
========================================
重要注意事項
========================================
線條確認延遲
• 線條出現時會有等於「右側K棒數」參數的延遲
• 此延遲確保樞軸點被確認
• 實時水平檢測需要價格行為確認
圖表清晰度
• 最多可顯示500條線(TradingView限制)
• 如果圖表變得太雜亂,請調整「顯示最近N根K棒」
• 超出回看期的舊線會自動刪除
假訊號
• 並非所有支撐阻力水平都會守住
• 使用額外確認(成交量、K棒型態、其他指標)
• 市場可能突破水平,特別是在重大新聞期間
最佳實踐
1. 結合其他分析:與趨勢指標、成交量和價格行為型態一起使用
2. 背景很重要:考慮整體市場趨勢和結構
3. 風險管理:始終使用止損;不要僅依賴支撐阻力水平
4. 市場條件:在流動性高、活躍交易的市場中更有效
5. 回測:在實盤交易前,在您的特定商品和時間框架上測試設定
故障排除
線條太多?
• 增加「左側K棒數」和「右側K棒數」數值
• 減少「顯示最近N根K棒」數值
線條太少?
• 減少「左側K棒數」和「右側K棒數」數值
• 增加「顯示最近N根K棒」數值
線條未出現?
• 確保圖表上載入了足夠的價格數據
• 檢查自上次波動點以來是否已過「右側K棒數」
• 驗證指標是否正確載入(如需要請刷新)
技術細節
• 使用 ta.pivothigh() 和 ta.pivotlow() 函數進行水平檢測
• 實施基於陣列的線條管理以實現高效渲染
• 自動清理過時線條以保持性能
• 疊加指標 - 直接顯示在價格圖表上
免責聲明:本指標僅供教育和資訊目的。不構成財務建議。在做出交易決策前,請務必進行自己的研究和風險評估。

Accumulation and Distribution Divergence with SignalsUse this indicator on the 1 minute chart for small cap stocks with news. They must be one of the leading gappers in the entire market for this to work best.

Smart Money Concepts by Rakesh Sharma🎯 SMART MONEY CONCEPTS - TRADE WITH INSTITUTIONS
Reveal where banks, hedge funds, and institutional traders enter the market. Trade alongside smart money, not against them!
✨ FEATURES:
- Order Blocks (OB) - Institutional buying/selling zones
- Fair Value Gaps (FVG) - Market inefficiencies to exploit
- Break of Structure (BOS) - Trend continuation signals
- Change of Character (ChoCh) - Early reversal detection
- Liquidity Sweeps - Stop hunt identification
- Premium/Discount Zones - Buy cheap, sell expensive
- Live Dashboard - Real-time market structure
🎯 HOW TO USE:
✓ BUY in Discount Zone at Bullish Order Blocks
✓ SELL in Premium Zone at Bearish Order Blocks
✓ Wait for ChoCh or BOS confirmation
✓ Follow institutional footprints for high-probability setups
📊 PERFECT FOR:
All markets - Nifty, Bank Nifty, Stocks, Forex, Crypto
All timeframes - 5m (scalping), 15m (intraday), Daily (swing)
⚡ TRADING EDGE:
Stop trading like retail. Start trading like institutions. See where smart money accumulates and distributes. Catch reversals early with ChoCh signals.
Created by: Rakesh Sharma | Version 1.0

CISD**CISD – Continuous Implied Structure Displacement (Body-Based Version)**
CISD displays structure levels derived from a simple sequence:
1. A valid pullback (based on body closes only)
2. Followed by a displacement (a body-based break in the opposite direction)
When these two conditions occur, the script prints a CISD level at the pullback’s reference price.
Each CISD level extends forward until price closes through it using body logic only.
---
### How this version works
**1. Pullback Detection (Body-Only)**
A pullback is recognized when a candle’s body meaningfully retraces the previous candle’s body.
Tiny candles are filtered out, reducing noise and improving level quality.
**2. CISD Formation**
After a valid pullback, if price breaks structure in the opposite direction using body highs/lows only:
- A **Bullish CISD** level is created from a bearish pullback
- A **Bearish CISD** level is created from a bullish pullback
**3. CISD Completion**
When a CISD level is violated by a full body close beyond the level, the CISD is marked completed and a new opposite CISD becomes eligible.
**4. Visual Output**
- Clean horizontal CISD levels
- Single active level per direction (unless extended manually)
- Labels marked “CISD” for clarity
---
### What this indicator is *not*
This tool does **not** generate trade signals or provide financial advice.
It is a visual mechanism for observing how price reacts to pullback-based structural shifts using body logic only.
---
### Intended Use
CISD can help users:
- Track transitions in short-term structure
- Identify when pullbacks lead to meaningful displacement
- Observe reaction points derived strictly from body behavior (ignoring wicks)
The logic is minimalistic and designed for clean, uncluttered structure observation.

5min ORB - HenryJ5min ORB, for ICT trading
Strategy Implementation: The main goal is to identify and visually mark the trading range established during the first 5 minutes of the regular trading session.
Time Definition: It measures the Highest High and Lowest Low recorded from the session open (minute 0) up to the close of the 5th minute.
Visual Marking: It draws two distinct horizontal line segments on the chart:
One line marks the High of the 5-minute Opening Range.
One line marks the Low of the 5-minute Opening Range.
Drawing Window: The lines are intentionally drawn starting from the 6th minute (after the range is fully established) and extend up to the 60th minute of the trading session. This ensures the lines are available to guide trades for the first hour after the opening volatility subsides.
Labeling: It includes a "5min ORB" text label placed near the high line, clearly identifying the range.
BY Henry J

TMT Support & Resistance - Hitesh NimjeTMT Support & Resistance - HiteshNimje Indicator
Overview
The TMT Support & Resistance indicator is a professional pivot point analysis tool that automatically calculates and displays key support and resistance levels across multiple timeframe perspectives. It offers various pivot point calculation methods and provides customizable visual elements for comprehensive technical analysis.
Key Features
Pivot Point Calculation Methods
1. Traditional Pivot Points
Standard pivot point calculation using Previous Period High, Low, and Close
Creates P, S1, S2, S3, R1, R2, R3 levels
Most widely used method for day trading and swing trading
2. Fibonacci Pivot Points
Incorporates Fibonacci retracement levels (38.2%, 61.8%)
Uses traditional pivot as base with Fibonacci extensions
Popular among traders following Fibonacci analysis
3. Woodie Pivot Points
Alternative calculation method with different weighting
Emphasizes opening price in calculations
Preferred by some intraday traders
4. Classic Pivot Points
Similar to traditional but with different level calculations
Balanced approach to support/resistance identification
Timeframe Options
* Auto: Automatically selects optimal timeframe based on chart timeframe
Intraday ≤15min → Daily
Intraday >15min → Weekly
Daily → Monthly
* Fixed Timeframes: Daily, Weekly, Monthly, Quarterly, Yearly
* Extended Periods: Biyearly, Triyearly, Quinquennially, Decennially
Level Management System
Support Levels (Blue Colored)
* TMT Support 1 (S1): First major support level
* TMT Support 2 (S2): Second support level
* TMT Support 3 (S3): Third support level
* TMT Support 4 (S4): Fourth support level (Traditional/Camarilla only)
* TMT Support 5 (S5): Fifth support level (Traditional/Camarilla only)
Resistance Levels (Black Colored)
* TMT Resistance 1 (R1): First major resistance level
* TMT Resistance 2 (R2): Second resistance level
* TMT Resistance 3 (R3): Third resistance level
* TMT Resistance 4 (R4): Fourth resistance level (Traditional/Camarilla only)
* TMT Resistance 5 (R5): Fifth resistance level (Traditional/Camarilla only)
Central Pivot (Orange Colored)
* Pivot Point (P): Central price level used for S/R calculations
Customization Options
Display Settings
* Show Labels: Toggle pivot level identification labels
* Show Prices: Display actual price values next to levels
* Labels Position: Choose between Left or Right positioning
* Line Width: Adjustable thickness (1-100 pixels) for all pivot lines
Data Source Options
* Use Daily-based Values:
ON: Uses official daily OHLC values for calculations
OFF: Uses intraday data with extended hours consideration
* Number of Pivots Back: Historical pivot display (1-200 levels)
Color Customization
* Individual color selection for each support/resistance level
* Default colors: Supports (Blue), Resistances (Black), Pivot (Orange)
* Full color picker integration for all levels
Technical Features
Smart Display Logic
* Intraday Charts: Automatically uses daily-based calculations when intraday data is insufficient
* Multi-timeframe Compatibility: Adapts to chart timeframe and pivot timeframe differences
* Extended Hours Handling: Incorporates extended trading hours when enabled on chart
Dynamic Level Management
* Real-time Updates: Levels update as new data becomes available
* Historical Tracking: Maintains configurable number of historical pivot periods
* Automatic Cleanup: Removes old pivot graphics when limit is exceeded
Visual Elements
* Time-based Lines: Lines extend across full time periods for clear visual reference
* Price Labels: Contextual information showing level names and prices
* Professional Styling: Clean, professional appearance suitable for any trading style
Use Cases
Day Trading Applications
* Session Management: Use daily pivots for intraday trading decisions
* Range Trading: Camarilla levels excellent for range-bound strategies
* Breakout Confirmation: Use pivot breaks as entry/exit signals
Swing Trading Applications
* Weekly/Monthly Pivots: Identify key levels for multi-day positions
* Trend Analysis: Track how price interacts with higher timeframe pivots
* Risk Management: Set stop-losses and take-profits at pivot levels
Long-term Trading Applications
* Quarterly/Yearly Pivots: Major institutional levels for position trading
* Support/Resistance Maps: Create comprehensive price level roadmap
* Market Structure Analysis: Understand price behavior around key levels
Benefits for Traders
Professional Analysis
* Multiple Methodologies: Choose pivot calculation that matches trading style
* Timeframe Flexibility: Analyze from multiple temporal perspectives
* Historical Context: See how price has historically responded to pivot levels
Risk Management
* Level Identification: Clear visual reference for stop-loss placement
* Position Sizing: Use pivot distances for risk/reward calculations
* Entry Timing: Identify optimal entry points near support/resistance
Market Understanding
* Psychological Levels: Understand where market participants react
* Volume Confirmation: Cross-reference pivot levels with volume data
* Trend Continuation: Identify pivot levels that may continue or reverse trends
Technical Specifications
* Pine Script Version: 6
* Overlay: True (displays on price chart)
* Performance: Optimized for up to 200 historical pivot periods
* Compatibility: All trading instruments and timeframes
* Data Source: OHLC-based pivot calculations with security function integration
Trading Strategy Integration
1. Support/Resistance Trading: Enter trades at S1/R1 with stops beyond S2/R2
2. Pivot Bounce Strategy: Trade bounces from established pivot levels
3. Range Trading: Use Camarilla pivots for tight range strategies
4. Breakout Strategy: Enter breakouts with confirmation from pivot breaks
5. Multiple Timeframe Analysis: Combine daily, weekly, and monthly pivots for comprehensive analysis
This indicator serves as a comprehensive support and resistance analysis tool, providing traders with institutional-quality pivot point analysis across multiple calculation methods and timeframes. It combines professional-grade pivot point calculations with intuitive customization options, making it suitable for traders of all experience levels and trading styles.
TRADING DISCLAIMER
RISK WARNING
Trading involves substantial risk of loss and is not suitable for all investors. Past performance is not indicative of future results. You should carefully consider whether trading is suitable for you in light of your circumstances, knowledge, and financial resources.
NO FINANCIAL ADVICE
This indicator is provided for educational and informational purposes only. It does not constitute:
* Financial advice or investment recommendations
* Buy/sell signals or trading signals
* Professional investment advice
* Legal, tax, or accounting guidance
LIMITATIONS AND DISCLAIMERS
Technical Analysis Limitations
* Pivot points are mathematical calculations based on historical price data
* No guarantee of accuracy of price levels or calculations
* Markets can and do behave irrationally for extended periods
* Past performance does not guarantee future results
* Technical analysis should be used in conjunction with fundamental analysis
Data and Calculation Disclaimers
* Calculations are based on available price data at the time of calculation
* Data quality and availability may affect accuracy
* Pivot levels may differ when calculated on different timeframes
* Gaps and irregular market conditions may cause level failures
* Extended hours trading may affect intraday pivot calculations
Market Risks
* Extreme market volatility can invalidate all technical levels
* News events, economic announcements, and market manipulation can cause gaps
* Liquidity issues may prevent execution at calculated levels
* Currency fluctuations, inflation, and interest rate changes affect all levels
* Black swan events and market crashes cannot be predicted by technical analysis
USER RESPONSIBILITIES
Due Diligence
* You are solely responsible for your trading decisions
* Conduct your own research before using this indicator
* Verify calculations with multiple sources before trading
* Consider multiple timeframes and confirm levels with other technical tools
* Never rely solely on one indicator for trading decisions
Risk Management
* Always use proper risk management and position sizing
* Set appropriate stop-losses for all positions
* Never risk more than you can afford to lose
* Consider the inherent risks of leverage and margin trading
* Diversify your portfolio and trading strategies
Professional Consultation
* Consult with qualified financial advisors before trading
* Consider your tax obligations and legal requirements
* Understand the regulations in your jurisdiction
* Seek professional advice for complex trading strategies
LIMITATION OF LIABILITY
Indemnification
The creator and distributor of this indicator shall not be liable for:
* Any trading losses, whether direct or indirect
* Inaccurate or delayed price data
* System failures or technical malfunctions
* Loss of data or profits
* Interruption of service or connectivity issues
No Warranty
This indicator is provided "as is" without warranties of any kind:
* No guarantee of accuracy or completeness
* No warranty of uninterrupted or error-free operation
* No warranty of merchantability or fitness for a particular purpose
* The software may contain bugs or errors
Maximum Liability
In no event shall the liability exceed the purchase price (if any) paid for this indicator. This limitation applies regardless of the theory of liability, whether contract, tort, negligence, or otherwise.
REGULATORY COMPLIANCE
Jurisdiction-Specific Risks
* Regulations vary by country and region
* Some jurisdictions prohibit or restrict certain trading strategies
* Tax implications differ based on your location and trading frequency
* Commodity futures and options trading may have additional requirements
* Currency trading may be regulated differently than stock trading
Professional Trading
* If you are a professional trader, ensure compliance with all applicable regulations
* Adhere to fiduciary duties and best execution requirements
* Maintain required records and reporting
* Follow market abuse regulations and insider trading laws
TECHNICAL SPECIFICATIONS
Data Sources
* Calculations based on TradingView data feeds
* Data accuracy depends on broker and exchange reporting
* Historical data may be subject to adjustments and corrections
* Real-time data may have delays depending on data providers
Software Limitations
* Internet connectivity required for proper operation
* Software updates may change calculations or functionality
* TradingView platform dependencies may affect performance
* Third-party integrations may introduce additional risks
MONEY MANAGEMENT RECOMMENDATIONS
Conservative Approach
* Risk only 1-2% of capital per trade
* Use position sizing based on volatility
* Maintain adequate cash reserves
* Avoid over-leveraging accounts
Portfolio Management
* Diversify across multiple strategies
* Don't put all capital into one approach
* Regularly review and adjust trading strategies
* Maintain detailed trading records
FINAL LEGAL NOTICES
Acceptance of Terms
* By using this indicator, you acknowledge that you have read and understood this disclaimer
* You agree to assume all risks associated with trading
* You confirm that you are legally permitted to trade in your jurisdiction
Updates and Changes
* This disclaimer may be updated without notice
* Continued use constitutes acceptance of any changes
* It is your responsibility to stay informed of updates
Governing Law
* This disclaimer shall be governed by the laws of the jurisdiction where the indicator was created
* Any disputes shall be resolved in the appropriate courts
* Severability clause: If any part of this disclaimer is invalid, the remainder remains enforceable
REMEMBER: THERE ARE NO GUARANTEES IN TRADING. THE MAJORITY OF RETAIL TRADERS LOSE MONEY. TRADE AT YOUR OWN RISK.
Contact Information:
* Creator: Hitesh_Nimje
* Phone: Contact@8087192915
* Source: Thought Magic Trading
© HiteshNimje - All Rights Reserved
This disclaimer should be prominently displayed whenever the indicator is shared, sold, or distributed to ensure users are fully aware of the risks and limitations involved in trading.


Ind-Suite: The Ultimate Strategic Dashboard [Gap/Dow/MA/SR]概要 Ind-Suiteは、トレードに必要な4つの重要な要素(窓、市場構造、移動平均線、水平線)を1つのインジケーターに統合した包括的なトレーディング・スイートです。 このツールの目的は、単一のサインに頼るのではなく、複数の根拠が重なる「コンフルエンス(Confluence)」を視覚的に発見することにあります。
機能モジュール 設定画面の「⚡ MODULE TOGGLES ⚡」から、各モジュールのON/OFFを瞬時に切り替えられます。
Module A: Gaps (窓)
未埋めの窓(Gap)をボックスで表示します。
価格が引き寄せられるターゲットとして機能します。一定期間経過した窓は自動的に非表示になります。
Module B: Dow Structure (ダウ理論と構造)
ZigZagラインによる波の描画と、トレンド状態の判定。
BOS (Break of Structure): トレンド継続のブレイクポイントにラベルを表示。
下落トレンド時は背景色が変化し、視覚的にトレンドを把握できます。
Module C: Safe Scaffold (足場と勢い)
EMA (9/20) & VWAP: トレンドフォローのための主要な移動平均線。
Bollinger Bands: ボラティリティの確認用(ON/OFF可能)。
Signal: EMAクロスとバンド幅拡大(スクイーズからのエクスパンション)を検知したロングサインを表示。
Module D: S/R Guardian (水平線)
過去のPivot点をベースに、意識されやすいサポート・レジスタンスラインを自動描画します。
強度に基づいてラインが統合され、重要度が高い価格帯を可視化します。
推奨される使い方 すべてのモジュールを常にONにする必要はありません。チャートが情報過多にならないよう、必要な機能だけを選択して表示してください。 例えば、「S/Rライン」での反発、「Dow Structure」でのBOS、「Gap」の埋め完了など、3つ以上の根拠が重なるポイントは、優位性の高いエントリーポイントとなります。
--------------
Overview Ind-Suite is a comprehensive trading suite that integrates four essential elements (Gaps, Market Structure, Moving Averages, and Support/Resistance) into a single indicator. The goal of this tool is not to rely on a single signal, but to visually identify "Confluence" where multiple factors align.
Feature Modules You can instantly toggle each module ON/OFF via the "⚡ MODULE TOGGLES ⚡" in the settings.
Module A: Gaps
Highlights unclosed gaps with boxes.
These act as price magnets/targets. Old gaps are automatically hidden after a set period.
Module B: Dow Structure (Trend & Market Structure)
Draws ZigZag waves and determines trend status based on pivot points.
BOS (Break of Structure): Labels are displayed at key breakout points confirming trend continuation.
Background color changes during downtrends for instant visual recognition.
Module C: Safe Scaffold (Momentum & MAs)
EMA (9/20) & VWAP: Key moving averages for trend following.
Bollinger Bands: For volatility analysis (Toggle available).
Signal: Displays Long signals upon EMA crossover combined with BBW expansion (volatility breakout).
Module D: S/R Guardian (Support & Resistance)
Automatically draws S/R zones based on historical pivot points.
Levels are merged based on proximity, visualizing significant price zones.
Recommended Usage It is not necessary to keep all modules ON at all times. Toggle features as needed to keep your chart clean. High-probability setups are often found where multiple factors converge (Confluence). For example: A bounce off an "S/R Line," confirmed by a "BOS" in Dow Structure, coinciding with a "Gap" fill.


