Candlestick analysis

Sree Daily RangeVery simple indicator to draw support and resistance levels given the price. It creates a given lebel at the level

SYXX - HTF Candle Overlay
This script, titled "HTF Candle Overlay by SYXX," is designed to visualize the full range and structure of a higher-timeframe (HTF) candle directly onto a lower-timeframe chart. It helps traders maintain context by showing where the current price action sits relative to a much larger candle's boundaries. Combined with LuxAlgo Volume Node Profile.
1. 🔍 Primary Feature: Higher Timeframe Candle Projection
Configurable Timeframe: The user sets the desired HTF using the Interval input, which defaults to 'D' (Daily). The indicator then tracks the High, Low, Open, and Close of that HTF bar.
Live and Historical Drawing: The script uses box.new to draw boxes representing the candle's full range (High to Low).
Historical Boxes (if changeHTF): When a new HTF candle closes, the completed box for the previous period is drawn.
Live Box (if barstate.islast): The indicator draws a live, dynamic box for the current, incomplete HTF candle, which expands with every new High or Low on the lower chart.
2. 🎨 Visualization & Customization
Color-Coded Bias: The boxes are colored based on the HTF candle's direction:
Bullish/Long (BgLong): Green color is used if the HTF candle closed higher than it opened (close > htfOpen).
Bearish/Short (BgShort): Red color is used if the HTF candle closed lower than it opened.
Box Styling: Users can customize the box's appearance, including border color and style, border thickness, and background opacity (BoxOpacity).
Midline: An optional MidLine is calculated as the average of the HTF High and Low, acting as a potential support/resistance reference point.
Range Display: The indicator can display the range of the box in pips (BoxRangePips) or the percentage of movement relative to the full range (BoxRangePercentage).
Time Labels: It plots time labels that show the start and end time of the completed HTF period (e.g., "07:00 - 11:00").
3. 🚨 Alert System (Placeholders)
The script includes placeholder inputs for standard trading alerts, though the internal logic for checking these conditions is currently commented out or set to false:
Alert: Break Above/Below Box: To signal a breakout of the HTF High or Low.
Alert: Price Re-Enters Box: To signal a pullback back into the range.

Smart Non-Overlapping S/R How to Interpret This Chart
The "Cluster" Effect: Look for areas where lines from different timeframes are close together (e.g., a Daily Support line is right next to a 4-Hour Support line). These "clusters" are very strong zones where price is highly likely to bounce.
Breakouts:
Bullish Breakout: If a candle closes above a Resistance line (e.g., "Daily Res"), that line often turns into new Support.
Bearish Breakout: If a candle closes below a Support line (e.g., "Daily Sup"), that line often turns into new Resistance.
Color Coding:
Orange (Daily): Major levels. Expect big reactions here.
Purple (4H): Medium trend levels. Good for swing trades.
Blue (1H): Minor levels. Good for day trading entries.

Clean Day End TradingThis script visualizes the complete Clean Box Breakout framework.
It automatically detects the intraday boundary window, builds a dynamic High/Low box, and locks levels at boundary close.
Features include:
• Dynamic boundary High/Low with optional historical day-1 & day-2 levels
• Automatic box visualization and real-time level updates
Ideal for traders who want clean, visual confirmation of the breakout model without running a strategy.

AI Kernel Regression StrategyHow to Use This Strategy
Paste the Code: Open the Pine Editor, paste the code, and click "Add to chart".
Look for Reversals:
BUY Signal: The price dipped below the green band (oversold) and snapped back up. The script identifies this as a high-probability bounce.
SELL Signal: The price spiked above the red band (overbought) and snapped back down.
Adjust the "Lookback Window":
In the settings (gear icon), if you change Lookback Window to a higher number (e.g., 15-20), the lines become smoother (better for trends).
If you lower it (e.g., 3-5), it becomes very reactive (better for scalping).
Important Note on "Repainting"
This script uses a technique called Regression. In live trading, it works perfectly (the signal appears when the candle closes). However, be aware that "AI" scripts like this are heavy on calculations. If you refresh your browser, the historical lines might shift slightly to fit the data better. Always wait for the candle to close before taking the trade to ensure the signal is locked in.

Daily High-Low-Open + LabelsSimple PDH/PDL/DO indicator. It is in horizontal line form and it includes labels. So you don't have to place them daily yourself. Updates on its own every single day.

Smoothed Heiken Ashi Candles9-SMA Trading Method (Buy and Sell Rules)
Sell Rules
A candle closes above.
Buy Rules
A candle closes below the 9-SMA.

TMT 1M HA Scalping INDICATOR - Hitesh Nimje📊 TMT 1 Minute HA Scalping Strategy - Hitesh Nimje
🎯 Strategy Overview
A 1-minute scalping strategy designed for high-frequency trading using Heikin Ashi-inspired crossover logic with multiple filters for precision entries.
🔧 Key Components
1. Moving Averages (Trend Detection)
LineTypePeriodColorPurposeFast SMASimple MA9🔵 BluePrimary signal lineSlow SMASimple MA21🔴 RedSecondary confirmationTrend SMASMA (1H)50⚫ BlackOverall market trend bias
2. Entry Signals (Crossover Logic)
🔥 BUY Signal: Fast SMA (9) crosses ABOVE Slow SMA (21)
🔥 SELL Signal: Fast SMA (9) crosses BELOW Slow SMA (21)
3. Entry Filters (4-Layer Confirmation)
✅ LONG Entry = Crossover + Trend Up + RSI Overbought + Bar Confirmed
✅ SHORT Entry = Crossunder + Trend Down + RSI Oversold + Bar Confirmed
longCond = sma_slope > 0 AND rsi >= 70 AND buySignal
shortCond = sma_slope < 0 AND rsi <= 30 AND sellSignal
FilterLongShortPurposeTrend Slopesma_slope > 0sma_slope < 0Market directionRSI FilterRSI >= 70RSI <= 30Momentum extremeCrossoverFast > SlowFast < SlowEntry triggerBar Statebarstate.isconfirmedbarstate.isconfirmedNo repaint
⚡ Risk Management
Stop Loss (Dynamic ATR-based)
Long SL = Lowest Low (7) - 1×ATR(14)
Short SL = Highest High (7) + 1×ATR(14)
Take Profit (1:1 Risk-Reward)
Long TP = Entry + (Entry - SL distance)
Short TP = Entry - (SL distance - Entry)
⏰ Trading Hours
📅 Active: 00:00 - 14:59 (3:00 PM cutoff)
🛑 Auto-close: All positions closed at 15:00
🎨 Visual Elements
📍 BUY Labels: 🟢 Green (below bar)
📍 SELL Labels: 🔴 Red (above bar)
📈 Fast SMA: 🔵 Blue line (9-period)
📉 Slow SMA: 🔴 Red line (21-period)
📊 Trend SMA: ⚫ Black line (50-period, 1H)
⚙️ Input Parameters
ParameterDefaultPurposeEnd of Day1500 (3 PM)Auto-close timeLot Size1Position size
🚀 How It Works (Step-by-Step)
1. Monitor Fast(9) vs Slow(21) SMA crossover
2. Check 1H Trend SMA slope (up/down bias)
3. Validate RSI extreme (70+/30-)
4. Wait for bar confirmation
5. Enter with ATR-based SL & 1:1 TP
6. Auto-exit at 3 PM or SL/TP hit
💡 Strategy Strengths
* ✅ Multi-timeframe trend filter
* ✅ RSI momentum confirmation
* ✅ Dynamic ATR stop losses
* ✅ No repaint signals
* ✅ End-of-day risk control
* ✅ 1:1 Risk-Reward consistency
Perfect for 1-minute scalping on volatile instruments! 🔥
© Hitesh Nimje | Thought Magic Trading
Contact: 8087192915
TRADING DISCLAIMER
RISK WARNING
Trading involves substantial risk of loss and is not suitable for all investors. Past performance is not indicative of future results. You should carefully consider whether trading is suitable for you in light of your circumstances, knowledge, and financial resources.
NO FINANCIAL ADVICE
This indicator is provided for educational and informational purposes only. It does not constitute:
* Financial advice or investment recommendations
* Buy/sell signals or trading signals
* Professional investment advice
* Legal, tax, or accounting guidance
LIMITATIONS AND DISCLAIMERS
Technical Analysis Limitations
* Pivot points are mathematical calculations based on historical price data
* No guarantee of accuracy of price levels or calculations
* Markets can and do behave irrationally for extended periods
* Past performance does not guarantee future results
* Technical analysis should be used in conjunction with fundamental analysis
Data and Calculation Disclaimers
* Calculations are based on available price data at the time of calculation
* Data quality and availability may affect accuracy
* Pivot levels may differ when calculated on different timeframes
* Gaps and irregular market conditions may cause level failures
* Extended hours trading may affect intraday pivot calculations
Market Risks
* Extreme market volatility can invalidate all technical levels
* News events, economic announcements, and market manipulation can cause gaps
* Liquidity issues may prevent execution at calculated levels
* Currency fluctuations, inflation, and interest rate changes affect all levels
* Black swan events and market crashes cannot be predicted by technical analysis
USER RESPONSIBILITIES
Due Diligence
* You are solely responsible for your trading decisions
* Conduct your own research before using this indicator
* Verify calculations with multiple sources before trading
* Consider multiple timeframes and confirm levels with other technical tools
* Never rely solely on one indicator for trading decisions
Risk Management
* Always use proper risk management and position sizing
* Set appropriate stop-losses for all positions
* Never risk more than you can afford to lose
* Consider the inherent risks of leverage and margin trading
* Diversify your portfolio and trading strategies
Professional Consultation
* Consult with qualified financial advisors before trading
* Consider your tax obligations and legal requirements
* Understand the regulations in your jurisdiction
* Seek professional advice for complex trading strategies
LIMITATION OF LIABILITY
Indemnification
The creator and distributor of this indicator shall not be liable for:
* Any trading losses, whether direct or indirect
* Inaccurate or delayed price data
* System failures or technical malfunctions
* Loss of data or profits
* Interruption of service or connectivity issues
No Warranty
This indicator is provided "as is" without warranties of any kind:
* No guarantee of accuracy or completeness
* No warranty of uninterrupted or error-free operation
* No warranty of merchantability or fitness for a particular purpose
* The software may contain bugs or errors
Maximum Liability
In no event shall the liability exceed the purchase price (if any) paid for this indicator. This limitation applies regardless of the theory of liability, whether contract, tort, negligence, or otherwise.
REGULATORY COMPLIANCE
Jurisdiction-Specific Risks
* Regulations vary by country and region
* Some jurisdictions prohibit or restrict certain trading strategies
* Tax implications differ based on your location and trading frequency
* Commodity futures and options trading may have additional requirements
* Currency trading may be regulated differently than stock trading
Professional Trading
* If you are a professional trader, ensure compliance with all applicable regulations
* Adhere to fiduciary duties and best execution requirements
* Maintain required records and reporting
* Follow market abuse regulations and insider trading laws
TECHNICAL SPECIFICATIONS
Data Sources
* Calculations based on TradingView data feeds
* Data accuracy depends on broker and exchange reporting
* Historical data may be subject to adjustments and corrections
* Real-time data may have delays depending on data providers
Software Limitations
* Internet connectivity required for proper operation
* Software updates may change calculations or functionality
* TradingView platform dependencies may affect performance
* Third-party integrations may introduce additional risks
MONEY MANAGEMENT RECOMMENDATIONS
Conservative Approach
* Risk only 1-2% of capital per trade
* Use position sizing based on volatility
* Maintain adequate cash reserves
* Avoid over-leveraging accounts
Portfolio Management
* Diversify across multiple strategies
* Don't put all capital into one approach
* Regularly review and adjust trading strategies
* Maintain detailed trading records
FINAL LEGAL NOTICES
Acceptance of Terms
* By using this indicator, you acknowledge that you have read and understood this disclaimer
* You agree to assume all risks associated with trading
* You confirm that you are legally permitted to trade in your jurisdiction
Updates and Changes
* This disclaimer may be updated without notice
* Continued use constitutes acceptance of any changes
* It is your responsibility to stay informed of updates
Governing Law
* This disclaimer shall be governed by the laws of the jurisdiction where the indicator was created
* Any disputes shall be resolved in the appropriate courts
* Severability clause: If any part of this disclaimer is invalid, the remainder remains enforceable
REMEMBER: THERE ARE NO GUARANTEES IN TRADING. THE MAJORITY OF RETAIL TRADERS LOSE MONEY. TRADE AT YOUR OWN RISK.
Contact Information:
* Creator: Hitesh_Nimje
* Phone: Contact@8087192915
* Source: Thought Magic Trading
© HiteshNimje - All Rights Reserved
This disclaimer should be prominently displayed whenever the indicator is shared, sold, or distributed to ensure users are fully aware of the risks and limitations involved in trading.

TMT Supply and Demand Zones - Hitesh Nimje📊 TMT Supply and Demand Zones - Hitesh Nimje
🎯 Overview
A professional-grade Supply & Demand zone indicator that automatically identifies and plots high-probability reversal zones across multiple timeframes. Perfect for institutional trading, smart money concepts, and price action analysis.
🔥 Key Features
✅ Multi-Timeframe Zone Detection
* 30m, 45m, 1H, 2H, 3H, 4H, Daily, Weekly zones (customizable)
* Lower timeframe zones (1m, 5m, 15m) available
* Forming zones (real-time detection of potential zones)
🎨 Full Customization
📦 Zone Settings
├── Zone Difference Scale (1.8 default) - Controls zone strength
└── Zone Extension (15 bars default)
🎭 Display Settings
├── Enable/Disable Supply & Demand independently
├── Background & Border colors for each zone type
└── Lower timeframe zone display
✍️ Text Settings
├── Separate Supply/Demand text colors
├── Text size (Auto/Tiny/Small/Normal/Large/Huge)
├── Horizontal & Vertical alignment options
└── High/Low price display option
⏰ Timeframe Options
├── Individual toggle for each timeframe
└── Smart filtering (prevents higher TF from showing lower TF zones)
🧠 Smart Zone Logic
Supply Zones form when:
* Red candle follows green/neutral candle
* Current candle is ≥1.8x larger than previous
* Price respects previous candle levels
Demand Zones form when:
* Green candle follows red/neutral candle
* Current candle is ≥1.8x larger than previous
* Price respects previous candle levels
⚡ Dynamic Zone Management
* Auto-extension to right (15 bars default)
* Auto-deletion when price breaks through
* Max 500 boxes for optimal performance
* Real-time updates on every bar
📈 How to Use
1. Basic Setup
✅ Enable desired timeframes (recommended: 30m/1H/4H/D)
✅ Keep "Zone Difference Scale" at 1.8
✅ Set Zone Extension to 15-20 bars
✅ Use white text on dark zones
2. Trading Strategy
🔴 SUPPLY ZONES (Sell Zones)
├── Price approaches from below
├── Rejection/wick at zone top
├── Sell on confirmation
🟢 DEMAND ZONES (Buy Zones)
├── Price approaches from above
├── Rejection/wick at zone bottom
├── Buy on confirmation
3. Best Combinations
💎 Pro Setup:
├── 4H + 1H zones (primary structure)
├── 30m zones (entries)
├── Daily zones (bias)
🎯 Scalping Setup:
├── 30m + 15m + 5m zones
⚙️ Input Recommendations
SettingRecommendedPurposeZone Scale1.8Strong zones onlyZone Extension15-25Good visibilitySupply ColorBlack (94% transparency)Clean lookDemand ColorBlue (94% transparency)Clear distinctionText SizeSmallReadableText ColorWhiteHigh contrast
🚀 Why This Indicator?
✅ Institutional-grade zone detection
✅ No repainting (confirmed bars only)
✅ Multi-timeframe confluence
✅ Full customization
✅ Performance optimized (500 max boxes)
✅ Clean, professional appearance
📱 Contact
Author: Hitesh Nimje
Phone: 8087192915
Source: Thought Magic Trading
"Trade the zones where smart money accumulates and distributes" 💰
TRADING DISCLAIMER
RISK WARNING
Trading involves substantial risk of loss and is not suitable for all investors. Past performance is not indicative of future results. You should carefully consider whether trading is suitable for you in light of your circumstances, knowledge, and financial resources.
NO FINANCIAL ADVICE
This indicator is provided for educational and informational purposes only. It does not constitute:
* Financial advice or investment recommendations
* Buy/sell signals or trading signals
* Professional investment advice
* Legal, tax, or accounting guidance
LIMITATIONS AND DISCLAIMERS
Technical Analysis Limitations
* Pivot points are mathematical calculations based on historical price data
* No guarantee of accuracy of price levels or calculations
* Markets can and do behave irrationally for extended periods
* Past performance does not guarantee future results
* Technical analysis should be used in conjunction with fundamental analysis
Data and Calculation Disclaimers
* Calculations are based on available price data at the time of calculation
* Data quality and availability may affect accuracy
* Pivot levels may differ when calculated on different timeframes
* Gaps and irregular market conditions may cause level failures
* Extended hours trading may affect intraday pivot calculations
Market Risks
* Extreme market volatility can invalidate all technical levels
* News events, economic announcements, and market manipulation can cause gaps
* Liquidity issues may prevent execution at calculated levels
* Currency fluctuations, inflation, and interest rate changes affect all levels
* Black swan events and market crashes cannot be predicted by technical analysis
USER RESPONSIBILITIES
Due Diligence
* You are solely responsible for your trading decisions
* Conduct your own research before using this indicator
* Verify calculations with multiple sources before trading
* Consider multiple timeframes and confirm levels with other technical tools
* Never rely solely on one indicator for trading decisions
Risk Management
* Always use proper risk management and position sizing
* Set appropriate stop-losses for all positions
* Never risk more than you can afford to lose
* Consider the inherent risks of leverage and margin trading
* Diversify your portfolio and trading strategies
Professional Consultation
* Consult with qualified financial advisors before trading
* Consider your tax obligations and legal requirements
* Understand the regulations in your jurisdiction
* Seek professional advice for complex trading strategies
LIMITATION OF LIABILITY
Indemnification
The creator and distributor of this indicator shall not be liable for:
* Any trading losses, whether direct or indirect
* Inaccurate or delayed price data
* System failures or technical malfunctions
* Loss of data or profits
* Interruption of service or connectivity issues
No Warranty
This indicator is provided "as is" without warranties of any kind:
* No guarantee of accuracy or completeness
* No warranty of uninterrupted or error-free operation
* No warranty of merchantability or fitness for a particular purpose
* The software may contain bugs or errors
Maximum Liability
In no event shall the liability exceed the purchase price (if any) paid for this indicator. This limitation applies regardless of the theory of liability, whether contract, tort, negligence, or otherwise.
REGULATORY COMPLIANCE
Jurisdiction-Specific Risks
* Regulations vary by country and region
* Some jurisdictions prohibit or restrict certain trading strategies
* Tax implications differ based on your location and trading frequency
* Commodity futures and options trading may have additional requirements
* Currency trading may be regulated differently than stock trading
Professional Trading
* If you are a professional trader, ensure compliance with all applicable regulations
* Adhere to fiduciary duties and best execution requirements
* Maintain required records and reporting
* Follow market abuse regulations and insider trading laws
TECHNICAL SPECIFICATIONS
Data Sources
* Calculations based on TradingView data feeds
* Data accuracy depends on broker and exchange reporting
* Historical data may be subject to adjustments and corrections
* Real-time data may have delays depending on data providers
Software Limitations
* Internet connectivity required for proper operation
* Software updates may change calculations or functionality
* TradingView platform dependencies may affect performance
* Third-party integrations may introduce additional risks
MONEY MANAGEMENT RECOMMENDATIONS
Conservative Approach
* Risk only 1-2% of capital per trade
* Use position sizing based on volatility
* Maintain adequate cash reserves
* Avoid over-leveraging accounts
Portfolio Management
* Diversify across multiple strategies
* Don't put all capital into one approach
* Regularly review and adjust trading strategies
* Maintain detailed trading records
FINAL LEGAL NOTICES
Acceptance of Terms
* By using this indicator, you acknowledge that you have read and understood this disclaimer
* You agree to assume all risks associated with trading
* You confirm that you are legally permitted to trade in your jurisdiction
Updates and Changes
* This disclaimer may be updated without notice
* Continued use constitutes acceptance of any changes
* It is your responsibility to stay informed of updates
Governing Law
* This disclaimer shall be governed by the laws of the jurisdiction where the indicator was created
* Any disputes shall be resolved in the appropriate courts
* Severability clause: If any part of this disclaimer is invalid, the remainder remains enforceable
REMEMBER: THERE ARE NO GUARANTEES IN TRADING. THE MAJORITY OF RETAIL TRADERS LOSE MONEY. TRADE AT YOUR OWN RISK.
Contact Information:
* Creator: Hitesh_Nimje
* Phone: Contact@8087192915
* Source: Thought Magic Trading
© HiteshNimje - All Rights Reserved
This disclaimer should be prominently displayed whenever the indicator is shared, sold, or distributed to ensure users are fully aware of the risks and limitations involved in trading.

TCT OBIF Detector█ OVERVIEW
The OBIF (Order Block Imbalance Fill) indicator automatically detects and visualizes high-probability trading zones by combining two powerful Smart Money Concepts: Order Blocks and Fair Value Gaps (FVGs).
An OBIF occurs when an Order Block forms immediately before a Fair Value Gap, creating a zone of institutional interest that price often revisits before continuing its move.
█ CONCEPTS
Order Block (OB)
An Order Block is the last opposing candle before a strong directional move. It represents an area where institutional traders likely placed orders.
- Bullish OB: Last bearish candle before an up-move
- Bearish OB: Last bullish candle before a down-move
Fair Value Gap (FVG)
An FVG is a price imbalance created when a candle's body completely gaps past the previous candle's range, leaving an unfilled area.
- Bullish FVG: Gap up where candle .low > candle .high
- Bearish FVG: Gap down where candle .high < candle .low
OBIF Zone
When an Order Block directly precedes an FVG, it creates an OBIF - a confluence zone with higher probability of acting as support/resistance.
█ HOW TO USE
1. Identify the Trend
Use OBIFs in the direction of the higher timeframe trend for best results.
2. Wait for Price to Return
OBIFs act as magnets - price often returns to fill the imbalance and test the order block.
3. Look for Confirmation
When price enters an OBIF zone, look for:
- Rejection wicks
- Engulfing patterns
- Break of structure on lower timeframes
4. Mitigation
Once price fully trades through the OBIF (touches the opposite edge), the zone is considered mitigated and loses its significance.
█ FEATURES
- Automatic Detection — Identifies OBIFs in real-time as they form
- Visual Zones — Clean, non-intrusive boxes that don't obscure price action
- Mitigation Tracking — Zones automatically update when price mitigates them
- Multi-Timeframe Friendly — Works on any timeframe from 1m to Monthly
- Customizable — Adjust colors, opacity, and display preferences
█ SETTINGS
- Lookback Window — How many candles back to search for the Order Block (default: 3)
- Show Bullish/Bearish — Toggle visibility of each type
- Show Mitigated — Display zones that have been mitigated (shown in gray)
- Fill Opacity — Adjust zone transparency (higher = more see-through)
- Border Width — Thickness of zone borders
█ BEST PRACTICES
✓ Use on higher timeframes (1H+) for more reliable zones
✓ Combine with market structure analysis
✓ Look for OBIFs at key support/resistance levels
✓ Use lower timeframe confirmation for entries
✗ Don't trade every OBIF blindly
✗ Avoid OBIFs against the dominant trend
█ CREDITS
The Composite Trader (TCT) methodologies.

CharisGold FX Dashboard v2.8 (Signals + Alerts)this strategy is a trend line follower using EMA LOW (2 3 6 9) for scalping EMA LOW(25 34 89 110 355 and 480 )for trend direction

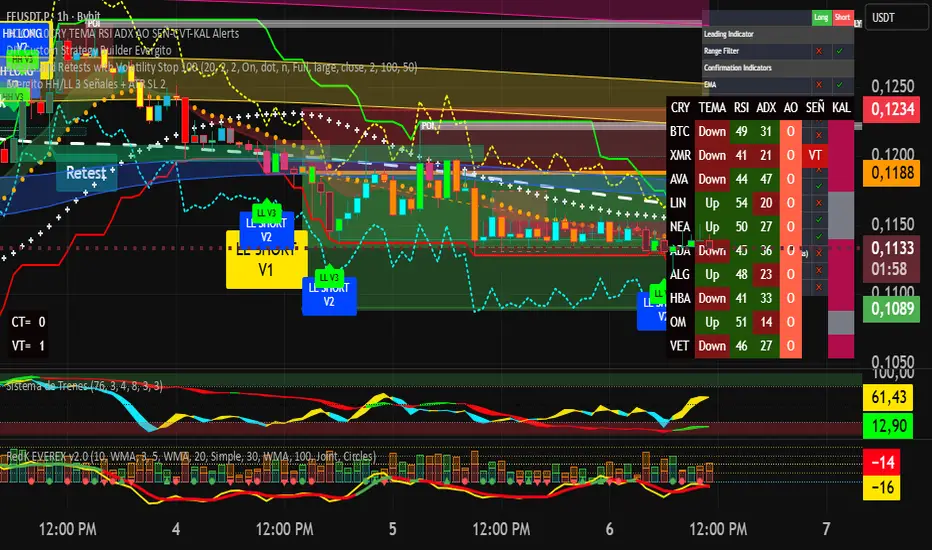
Evergito HH/LL 3 Señales + ATR SL 2How to trade with the Evergito HH/LL 3 Signals + ATR SL indicator? Brief and direct explanation: General system logic: The indicator looks for actual breakouts of the high/low of the last 20 bars (HH/LL) and combines them with the position relative to the 200 SMA to filter the underlying trend. You have 3 types of signals that you can activate/deactivate separately: Signal
When it appears
What it means in practice
Entry type
V1
HH breakout + the close crosses above the 200 SMA (or the opposite in a short position)
Very safe entry confirmed. The price has just validated the long/flat trend → safer and with a better ratio
The most reliable (the original)
V2
HH breakout but the price was already above the 200 SMA (or already below in a short position)
Entry in an already established trend. Fewer “surprises”, more continuity
Ideal for strong trends
V3
Only the breakout of the HH or LL, without looking at the 200 SMA
Aggressive entry/scalping on explosive breakouts. More signals, more noise.
For times of high volatility.
How to enter the market (simple rule): Wait for any of the 3 labels (V1, V2, or V3) to appear, depending on which ones you have activated.
Enter at the close of that candle (or at the open of the next one if you are conservative).
Automatic Stop Loss → the blue (long) or yellow (short) line that represents the ATR x2.
Take Profit → you decide, but the indicator already gives you the visual reference for the risk (ATR x2), so 1:2 or 1:3 is usually very convenient.
Practical example: You see a large green label “HH LONG V1” → you go long at the close of that candle. Stop right at the blue line (ATR x2 below the price).
Typical target: 2x or 3x the risk (very common to reach it in a trend).
Recommended use: Most traders leave only V1 activated → fewer signals but very high quality.
Those who trade intraday or crypto usually combine V1 + V2.
V3 only for news events or very volatile openings.
In summary:
Label = immediate entry
Blue/yellow line = automatic stop
And enjoy the move.
Evergito HH/LL 3 Señales + ATR SLHow to trade with the Evergito HH/LL 3 Signals + ATR SL indicator? Brief and direct explanation: General system logic: The indicator looks for actual breakouts of the high/low of the last 20 bars (HH/LL) and combines them with the position relative to the 200 SMA to filter the underlying trend. You have 3 types of signals that you can activate/deactivate separately: Signal
When it appears
What it means in practice
Entry type
V1
HH breakout + the close crosses above the 200 SMA (or the opposite in a short position)
Very safe entry confirmed. The price has just validated the long/flat trend → safer and with a better ratio
The most reliable (the original)
V2
HH breakout but the price was already above the 200 SMA (or already below in a short position)
Entry in an already established trend. Fewer “surprises”, more continuity
Ideal for strong trends
V3
Only the breakout of the HH or LL, without looking at the 200 SMA
Aggressive entry/scalping on explosive breakouts. More signals, more noise.
For times of high volatility.
How to enter the market (simple rule): Wait for any of the 3 labels (V1, V2, or V3) to appear, depending on which ones you have activated.
Enter at the close of that candle (or at the open of the next one if you are conservative).
Automatic Stop Loss → the blue (long) or yellow (short) line that represents the ATR x2.
Take Profit → you decide, but the indicator already gives you the visual reference for the risk (ATR x2), so 1:2 or 1:3 is usually very convenient.
Practical example: You see a large green label “HH LONG V1” → you go long at the close of that candle. Stop right at the blue line (ATR x2 below the price).
Typical target: 2x or 3x the risk (very common to reach it in a trend).
Recommended use: Most traders leave only V1 activated → fewer signals but very high quality.
Those who trade intraday or crypto usually combine V1 + V2.
V3 only for news events or very volatile openings.
In summary:
Label = immediate entry
Blue/yellow line = automatic stop
And enjoy the move.


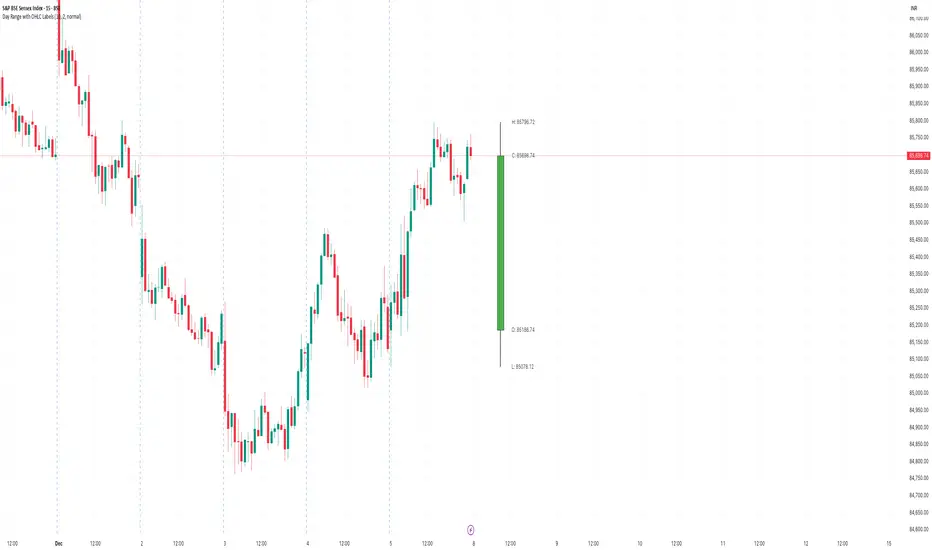
Day Range with OHLC LabelsThis indicator creates a synthetic daily candlestick that appears to the right of the chart, visually separated from real price bars.
It helps traders quickly view each day’s High, Low, Open, and Close without zooming, scrolling, or switching to higher timeframes.
What This Tool Does
✔ Draws a floating daily candle to the right of the current chart
✔ Displays the true Daily Open, High, Low, and Close
✔ Shows a center-aligned wick representing the full high-low range
✔ Shows a box-style candle body positioned using real OHLC values
✔ Labels the values (O, H, L, C) with large, clear fonts
✔ Automatically updates at each new day
✔ Works on any timeframe
✔ Helps intraday traders track daily structure visually
Why This Indicator Is Useful
This script is ideal for intraday traders who want instant awareness of the current day’s range.
Instead of guessing or drawing manual lines, you get a clean daily candlestick rendered off to the right side, avoiding chart clutter.
Great for:
Range traders
Breakout traders
Liquidity zone analysis
High/Low reference tracking
Traders who prefer non-intrusive visuals
Customization
Adjustable offset: position the candle further right
Configurable colors for wick + body
Large-font labels for easy reading
Automatically clears and redraws cleanly each day
Summary
This tool creates a clear, minimalistic, right-side daily candlestick complete with OHLC labels and centralized wick.
It’s designed to improve chart clarity and support quick decision-making without blocking price candles.
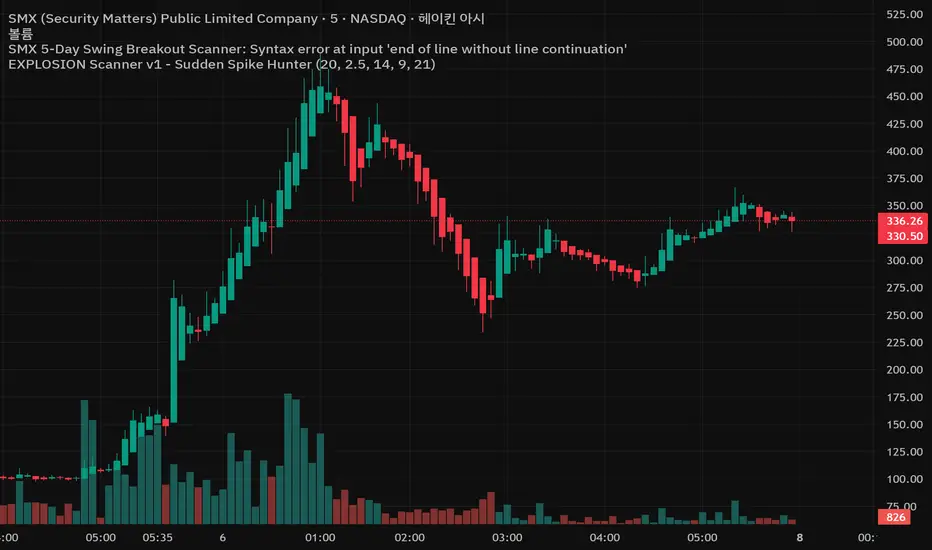
EXPLOSION Scanner v1 - Sudden Spike Hunter//@version=5
indicator("EXPLOSION ENTRY v1 - 5Day Swing Breakout Scanner", overlay=true)
// ===============================
// 입력값
// ===============================
lenBB = input.int(20, "BB Length")
multBB = input.float(2.0, "BB StdDev")
lenVolMA = input.int(20, "Volume MA Length")
volMult = input.float(1.8, "Volume Explosion Mult")
lenATR = input.int(14, "ATR Length")
atrThresh= input.float(3.0, "ATR % Threshold")
needBull = input.int(4, "최근 5봉 중 최소 양봉 개수", minval=1, maxval=5)
// ===============================
// Bollinger Band
// ===============================
basis = ta.sma(close, lenBB)
dev = ta.stdev(close, lenBB)
upper = basis + dev * multBB
lower = basis - dev * multBB
plot(upper, "BB Upper", display=display.none)
plot(basis, "BB Basis", display=display.none)
plot(lower, "BB Lower", display=display.none)
// ===============================
// Volume Explosion
// ===============================
volMA = ta.sma(volume, lenVolMA)
volCond = volume > volMA * volMult
// ===============================
// 5-Day Candle Strength (최근 5봉 양봉 개수)
// ===============================
bullCount = (close > open ? 1 : 0) +
(close > open ? 1 : 0) +
(close > open ? 1 : 0) +
(close > open ? 1 : 0) +
(close > open ? 1 : 0)
candleCond = bullCount >= needBull
// ===============================
// ATR Volatility Filter
// ===============================
atrValue = ta.atr(lenATR)
atrRate = atrValue / close * 100.0
volatilityCond = atrRate > atrThresh
// ===============================
// Trend Filter (기본 추세)
// ===============================
trendCond = close > basis
// ===============================
// 최종 매수 조건
// ===============================
buyCond = trendCond and volCond and candleCond and volatilityCond
// ===============================
// BUY 신호 표시
// ===============================
plotshape(
buyCond,
title = "BUY Signal",
style = shape.triangleup,
location = location.belowbar,
size = size.small,
text = "BUY",
textcolor = color.white
)
// ===============================
// 알림(Alert)
// ===============================
alertcondition(
buyCond,
title = "EXPLOSION BUY",
message = "EXPLOSION ENTRY v1 : BUY SIGNAL 발생"
)
ZY Target TerminatorThe indicator follows trends and generates short and long signals. Furthermore, when it generates a signal, it displays the maximum profit margins for the last three signals it generated in the same direction. It also clearly indicates the number of candles for which no signal has been generated for the pair. Avoid trading pairs whose profit margins do not align with your trading strategy.

TMT ICT SMC - Hitesh NimjeTMT ICT SMC - Smart Money Concepts
Overview
T
he TMT ICT SMC indicator is a comprehensive, all-in-one toolkit designed for traders utilizing Smart Money Concepts (SMC) and Inner Circle Trader (ICT) methodologies. Developed by Hitesh Nimje (Thought Magic Trading), this script automates the complex task of market structure mapping, order block identification, and liquidity analysis, providing a clear, institutional-grade view of price action.
Whether you are a scalper looking for internal structure shifts or a swing trader analyzing major trend reversals, this tool adapts to your timeframe with precision.
Key Features
1. Market Structure Mapping (Internal & Swing)
* Real-Time Structure: Automatically detects and labels BOS (Break of Structure) and CHoCH (Change of Character).
* Dual-Layer Analysis:
I nternal Structure: Captures short-term momentum and minor shifts for entry refinement.
Swing Structure: Identifies the overarching trend and major pivot points.
* Strong vs. Weak Highs/Lows: visualizes significant swing points to help you identify safe invalidation levels.
* Trend Coloring: Optional feature to color candles based on the active market structure trend.
2. Advanced Order Blocks (OB)
* Auto-Detection: Plots both Internal and Swing Order Blocks automatically.
* Smart Filtering: Includes an ATR or Cumulative Mean Range filter to remove noise and only display significant institutional footprint zones.
* Mitigation Tracking: Choose how order blocks are mitigated (Close vs. High/Low) to keep your chart clean.
3. Liquidity & Gaps
* Fair Value Gaps (FVG): Automatically highlights bullish and bearish imbalances. Includes MTF (Multi-Timeframe) capabilities to see higher timeframe gaps on lower timeframe charts.
* Equal Highs/Lows (EQH/EQL): Marks potential liquidity pools where price often reverses or targets.
4. Multi-Timeframe Levels
* Plots Daily, Weekly, and Monthly High/Low levels directly on your chart to help identify macro support and resistance without switching timeframes.
5. Premium & Discount Zones
* Automatically plots the Fibonacci range of the current price leg to show Premium (expensive), Discount (cheap), and Equilibrium zones, aiding in high-probability entry placement.
Customization
* Style: Switch between a "Colored" vibrant theme or a "Monochrome" minimal theme.
* Control: Every feature can be toggled on/off. Adjust lookback periods, sensitivity thresholds, and colors to match your personal trading style.
* Modes: Choose between "Historical" (for backtesting) and "Present" (for optimized real-time performance).
How to Use
* Trend Confirmation: Use the Swing Structure labels to determine the higher timeframe bias.
* Entry Trigger: Wait for a CHoCH on the Internal Structure within a higher timeframe Order Block or FVG.
* Targeting: Use the Equal Highs/Lows (Liquidity) or opposing Order Blocks as take-profit zones.
Credits
* Author: Hitesh Nimje
* Source: Thought Magic Trading (TMT)
TRADING DISCLAIMER
RISK WARNING
Trading involves substantial risk of loss and is not suitable for all investors. Past performance is not indicative of future results. You should carefully consider whether trading is suitable for you in light of your circumstances, knowledge, and financial resources.
NO FINANCIAL ADVICE
This indicator is provided for educational and informational purposes only. It does not constitute:
* Financial advice or investment recommendations
* Buy/sell signals or trading signals
* Professional investment advice
* Legal, tax, or accounting guidance
LIMITATIONS AND DISCLAIMERS
Technical Analysis Limitations
* Pivot points are mathematical calculations based on historical price data
* No guarantee of accuracy of price levels or calculations
* Markets can and do behave irrationally for extended periods
* Past performance does not guarantee future results
* Technical analysis should be used in conjunction with fundamental analysis
Data and Calculation Disclaimers
* Calculations are based on available price data at the time of calculation
* Data quality and availability may affect accuracy
* Pivot levels may differ when calculated on different timeframes
* Gaps and irregular market conditions may cause level failures
* Extended hours trading may affect intraday pivot calculations
Market Risks
* Extreme market volatility can invalidate all technical levels
* News events, economic announcements, and market manipulation can cause gaps
* Liquidity issues may prevent execution at calculated levels
* Currency fluctuations, inflation, and interest rate changes affect all levels
* Black swan events and market crashes cannot be predicted by technical analysis
USER RESPONSIBILITIES
Due Diligence
* You are solely responsible for your trading decisions
* Conduct your own research before using this indicator
* Verify calculations with multiple sources before trading
* Consider multiple timeframes and confirm levels with other technical tools
* Never rely solely on one indicator for trading decisions
Risk Management
* Always use proper risk management and position sizing
* Set appropriate stop-losses for all positions
* Never risk more than you can afford to lose
* Consider the inherent risks of leverage and margin trading
* Diversify your portfolio and trading strategies
Professional Consultation
* Consult with qualified financial advisors before trading
* Consider your tax obligations and legal requirements
* Understand the regulations in your jurisdiction
* Seek professional advice for complex trading strategies
LIMITATION OF LIABILITY
Indemnification
The creator and distributor of this indicator shall not be liable for:
* Any trading losses, whether direct or indirect
* Inaccurate or delayed price data
* System failures or technical malfunctions
* Loss of data or profits
* Interruption of service or connectivity issues
No Warranty
This indicator is provided "as is" without warranties of any kind:
* No guarantee of accuracy or completeness
* No warranty of uninterrupted or error-free operation
* No warranty of merchantability or fitness for a particular purpose
* The software may contain bugs or errors
Maximum Liability
In no event shall the liability exceed the purchase price (if any) paid for this indicator. This limitation applies regardless of the theory of liability, whether contract, tort, negligence, or otherwise.
REGULATORY COMPLIANCE
Jurisdiction-Specific Risks
* Regulations vary by country and region
* Some jurisdictions prohibit or restrict certain trading strategies
* Tax implications differ based on your location and trading frequency
* Commodity futures and options trading may have additional requirements
* Currency trading may be regulated differently than stock trading
Professional Trading
* If you are a professional trader, ensure compliance with all applicable regulations
* Adhere to fiduciary duties and best execution requirements
* Maintain required records and reporting
* Follow market abuse regulations and insider trading laws
TECHNICAL SPECIFICATIONS
Data Sources
* Calculations based on TradingView data feeds
* Data accuracy depends on broker and exchange reporting
* Historical data may be subject to adjustments and corrections
* Real-time data may have delays depending on data providers
Software Limitations
* Internet connectivity required for proper operation
* Software updates may change calculations or functionality
* TradingView platform dependencies may affect performance
* Third-party integrations may introduce additional risks
MONEY MANAGEMENT RECOMMENDATIONS
Conservative Approach
* Risk only 1-2% of capital per trade
* Use position sizing based on volatility
* Maintain adequate cash reserves
* Avoid over-leveraging accounts
Portfolio Management
* Diversify across multiple strategies
* Don't put all capital into one approach
* Regularly review and adjust trading strategies
* Maintain detailed trading records
FINAL LEGAL NOTICES
Acceptance of Terms
* By using this indicator, you acknowledge that you have read and understood this disclaimer
* You agree to assume all risks associated with trading
* You confirm that you are legally permitted to trade in your jurisdiction
Updates and Changes
* This disclaimer may be updated without notice
* Continued use constitutes acceptance of any changes
* It is your responsibility to stay informed of updates
Governing Law
* This disclaimer shall be governed by the laws of the jurisdiction where the indicator was created
* Any disputes shall be resolved in the appropriate courts
* Severability clause: If any part of this disclaimer is invalid, the remainder remains enforceable
REMEMBER: THERE ARE NO GUARANTEES IN TRADING. THE MAJORITY OF RETAIL TRADERS LOSE MONEY. TRADE AT YOUR OWN RISK.
Contact Information:
* Creator: Hitesh_Nimje
* Phone: Contact@8087192915
* Source: Thought Magic Trading
© HiteshNimje - All Rights Reserved
This disclaimer should be prominently displayed whenever the indicator is shared, sold, or distributed to ensure users are fully aware of the risks and limitations involved in trading.

Multi-Timeframe QuartilesThis indicator helps you identify the position of price in comparison with distance to key reference levels on multiple timeframes. Statistically, when the price is opening in the lower quartile of a timeframe, there is a higher chance for that previous low to be taken, depending on the market structure already formed

Buy & Sell Arrows - MACD + Best_Solve WPRMACD + Best_Solve Williams %R – Aggressive Trend-Reversal Catcher
(Allow Signals Even in Overbought/Oversold Zones)
This indicator combines the classic MACD histogram with Best_Solve’s popular custom Williams %R (a 0–100 momentum oscillator that behaves more like a fast Stochastic) to deliver clean, high-conviction entry signals on daily (and higher) timeframes.
Core Logic – Only TWO conditions are required
BUY (large green arrow below bar)
MACD histogram is green (bullish momentum)
Williams %R fast line is crossing above OR already above its EMA
SELL (large red arrow above bar)
MACD histogram is red (bearish momentum)
Williams %R fast line is crossing below OR already below its EMA
Unlike most oscillators, this version deliberately removes the traditional “do not buy when overbought / do not sell when oversold” filters. This allows the script to catch powerful trend reversals and explosive moves immediately — even on violent earnings gaps or panic sell-offs (example: META’s -11 % drop on Oct 30 2025 triggered an instant sell even though %R was deeply oversold).
Built-in Clean-Signal Logic
No consecutive buys or sells — each new signal must be preceded by the opposite direction.
This keeps the chart extremely clean and prevents whipsaw clusters during strong trends.
Best Use Cases
Daily and 4H swing trading on stocks, indices, crypto, forex
Excellent for catching sharp reversals after earnings, news events, or overextended moves
Works especially well on high-beta names and growth stocks
Visuals
Large green/red arrows with “BUY” / “SELL” text (your favorite style)
Subtle transparent MACD histogram overlaid on price for instant momentum context
Ready-to-use alerts (“Buy Alert” / “Sell Alert”)
Set it, alert it, trade it — one of the cleanest and most responsive daily reversal systems you’ll find.
Enjoy the edge!

NEXFEL – Quantum Adaptive MACD System v2.0# NEXFEL – Quantum Adaptive MACD System v2.0
## 📌 Overview
The **NEXFEL – Quantum Adaptive MACD System v2.0** is an advanced, fully integrated decision-support tool built upon an enhanced adaptive MACD engine.
Unlike traditional MACD implementations that rely on fixed parameters, this system uses **R² correlation** to dynamically adjust sensitivity based on current market behavior.
This indicator **does not simply merge tools**; it unifies:
- Adaptive MACD calculation
- Multi-timeframe sentiment (1H + 4H)
- Market regime detection
- Volume confirmation
- Confidence scoring (0–100%)
- ATR stop-loss visualization
- Session filtering
- Daily trade limit control
into a **single coherent trading framework**.
This publication replaces my previous “Adaptive MACD Flow PRO”, as this version is a complete rewrite with new logic, improved structure, and expanded analytical capabilities.
---
## ⚙️ How It Works
### **1. Adaptive MACD Core (R²-Based)**
The MACD sensitivity is adjusted using R² correlation:
- High R² → smoother & more stable response
- Low R² → more reactive & faster response
This adaptation allows the oscillator to naturally adjust to different volatility environments.
---
### **2. Multi-Timeframe Sentiment**
The system analyzes:
- **1H EMAs (10/30)**
- **4H EMAs (20/50)**
A directional sentiment score is generated, allowing signals only when the local timeframe aligns with the higher timeframe structure.
---
### **3. Market Regime Detection**
The indicator identifies whether the market is:
- **TRENDING**
- **RANGING**
- **NEUTRAL**
Signals are validated or filtered depending on the active regime.
---
### **4. Confidence Scoring System (0–100%)**
The signal quality is measured by weighting:
- Momentum
- Volume confirmation
- Market regime compatibility
- Multi-timeframe alignment
- Local trend direction
- Short-term momentum
Only **high-confidence** conditions produce the safest BUY/SELL signals.
---
### **5. ATR Stop-Loss Visualization**
Dynamic stop levels are displayed using:
- ATR × multiplier
A visual reference for risk management without executing trades.
---
### **6. Daily Trade Limit Control**
To prevent overtrading, the system tracks daily signals and restricts new ones once a limit is reached.
---
### **7. Multi-Language Interface**
The panel can display:
- **English**
- **Portuguese**
depending on user selection.
(TradingView requires English as the primary language, which is why it appears first in this description.)
---
## 👤 Who This Script Is For
- Traders seeking a more reliable and adaptive MACD
- Scalpers who prefer high-confirmation entries
- Swing traders analyzing market regimes
- Users needing a clean, objective analytical panel
---
## ⚠️ Important
This indicator does **not** execute trades and does not guarantee results.
It is a **decision-support system**, not a trading bot.
# 📝 Author’s Notes
This version is a complete redesign of my previous indicator.
All components were rebuilt, expanded, and optimized to offer a more structured and reliable trading system.

VWAP + EMA9/21/50 + Ichimoku + RSI (M5) - Strict + TPSL//@version=5
indicator("VWAP + EMA9/21/50 + Ichimoku + RSI (M5) - Strict + TPSL", overlay=true, shorttitle="VWAP_EMA_ICH_RSI_TPSL")
// === Inputs ===
emaFastLen = input.int(9, "EMA Fast (9)")
emaMidLen = input.int(21, "EMA Mid (21)")
emaSlowLen = input.int(50, "EMA Slow (50)")
// Ichimoku inputs
tenkanLen = input.int(9, "Tenkan Sen Length")
kijunLen = input.int(26, "Kijun Sen Length")
senkouBLen = input.int(52, "Senkou B Length")
displacement = input.int(26, "Displacement")
// RSI
rsiLen = input.int(14, "RSI Length")
rsiThreshold = input.int(50, "RSI Threshold")
// VWAP option
useSessionVWAP = input.bool(true, "Use Session VWAP (true) / Daily VWAP (false)")
// Volume filter
useVolumeFilter = input.bool(true, "Enable Volume Filter")
volAvgLen = input.int(20, "Volume Avg Length")
volMultiplier = input.float(1.2, "Min Volume > avg *", step=0.1)
// Higher timeframe trend check
useHTF = input.bool(true, "Enable Higher-Timeframe Trend Check")
htfTF = input.string("60", "HTF timeframe (e.g. 60, 240, D)")
// Alerts / webhook
alertOn = input.bool(true, "Enable Alerts")
useWebhook = input.bool(true, "Send webhook on alerts")
webhookURL = input.string("", "Webhook URL (leave blank to set in alert)")
// TP/SL & Trailing inputs
useTP = input.bool(true, "Enable Take Profit (TP)")
tpTypeRR = input.bool(true, "TP as Risk-Reward ratio (true) / Fixed points (false)")
tpRR = input.float(1.5, "TP RR (e.g. 1.5)", step=0.1)
fixedTPpts = input.float(40.0, "Fixed TP (ticks/pips) if not RR")
useSL = input.bool(true, "Enable Stop Loss (SL)")
slTypeATR = input.bool(true, "SL as ATR-based (true) / Fixed points (false)")
atrLen = input.int(14, "ATR Length")
atrMult = input.float(1.5, "ATR Multiplier for SL", step=0.1)
fixedSLpts = input.float(20.0, "Fixed SL (ticks/pips) if not ATR")
useTrailing = input.bool(true, "Enable Trailing Stop")
trailType = input.string("ATR", "Trailing type: ATR or EMA", options= ) // "ATR" or "EMA"
trailATRmult = input.float(1.0, "Trailing ATR Multiplier", step=0.1)
trailEMAlen = input.int(9, "Trailing EMA Length (if EMA chosen)")
trailLockInPts = input.float(5.0, "Trail lock-in (min profit before trail active, pts)")
// Other
showArrows = input.bool(true, "Show Entry Arrows")
// === Calculations ===
ema9 = ta.ema(close, emaFastLen)
ema21 = ta.ema(close, emaMidLen)
ema50 = ta.ema(close, emaSlowLen)
// VWAP
vwapVal = ta.vwap
// Ichimoku
highestHighTenkan = ta.highest(high, tenkanLen)
lowestLowTenkan = ta.lowest(low, tenkanLen)
tenkan = (highestHighTenkan + lowestLowTenkan) / 2
highestHighKijun = ta.highest(high, kijunLen)
lowestLowKijun = ta.lowest(low, kijunLen)
kijun = (highestHighKijun + lowestLowKijun) / 2
highestHighSenkouB = ta.highest(high, senkouBLen)
lowestLowSenkouB = ta.lowest(low, senkouBLen)
senkouB = (highestHighSenkouB + lowestLowSenkouB) / 2
senkouA = (tenkan + kijun) / 2
// RSI
rsi = ta.rsi(close, rsiLen)
// Volume
volAvg = ta.sma(volume, volAvgLen)
volOk = not useVolumeFilter or (volume > volAvg * volMultiplier)
// Higher timeframe trend values
htf_close = request.security(syminfo.tickerid, htfTF, close)
htf_ema50 = request.security(syminfo.tickerid, htfTF, ta.ema(close, emaSlowLen))
htf_rsi = request.security(syminfo.tickerid, htfTF, ta.rsi(close, rsiLen))
htf_bull = htf_close > htf_ema50
htf_bear = htf_close < htf_ema50
htf_ok = not useHTF or (htf_bull and close > ema50) or (htf_bear and close < ema50)
// Trend filters (on current timeframe)
priceAboveVWAP = close > vwapVal
priceAboveEMA50 = close > ema50
priceAboveCloud = close > senkouA and close > senkouB
bullTrend = priceAboveVWAP and priceAboveEMA50 and priceAboveCloud
bearTrend = not priceAboveVWAP and not priceAboveEMA50 and not priceAboveCloud
// Pullback detection (price near EMA21 within tolerance)
tolPerc = input.float(0.35, "Pullback tolerance (%)", step=0.05) / 100.0
nearEMA21 = math.abs(close - ema21) <= ema21 * tolPerc
// Entry conditions
emaCrossUp = ta.crossover(ema9, ema21)
emaCrossDown = ta.crossunder(ema9, ema21)
longConditionBasic = bullTrend and (nearEMA21 or close >= vwapVal) and emaCrossUp and rsi > rsiThreshold
shortConditionBasic = bearTrend and (nearEMA21 or close <= vwapVal) and emaCrossDown and rsi < rsiThreshold
longCondition = longConditionBasic and volOk and htf_ok and (not useHTF or htf_bull) and (rsi > rsiThreshold)
shortCondition = shortConditionBasic and volOk and htf_ok and (not useHTF or htf_bear) and (rsi < rsiThreshold)
// More strict: require Tenkan > Kijun for bull and Tenkan < Kijun for bear
ichimokuAlign = (tenkan > kijun) ? 1 : (tenkan < kijun ? -1 : 0)
longCondition := longCondition and (ichimokuAlign == 1)
shortCondition := shortCondition and (ichimokuAlign == -1)
// ATR for SL / trailing
atr = ta.atr(atrLen)
// --- Trade management state variables ---
var float activeLongEntry = na
var float activeShortEntry = na
var float activeLongSL = na
var float activeShortSL = na
var float activeLongTP = na
var float activeShortTP = na
var float activeLongTrail = na
var float activeShortTrail = na
// Function to convert fixed points to price (assumes chart in points as price units)
fixedToPriceLong(p) => p
fixedToPriceShort(p) => p
// On signal, set entry, SL and TP
if longCondition
activeLongEntry := close
// SL
if useSL
if slTypeATR
activeLongSL := close - atr * atrMult
else
activeLongSL := close - fixedToPriceLong(fixedSLpts)
else
activeLongSL := na
// TP
if useTP
if tpTypeRR and useSL and not na(activeLongSL)
risk = activeLongEntry - activeLongSL
activeLongTP := activeLongEntry + risk * tpRR
else
activeLongTP := activeLongEntry + fixedToPriceLong(fixedTPpts)
else
activeLongTP := na
// reset short
activeShortEntry := na
activeShortSL := na
activeShortTP := na
// init trailing
activeLongTrail := activeLongSL
if shortCondition
activeShortEntry := close
if useSL
if slTypeATR
activeShortSL := close + atr * atrMult
else
activeShortSL := close + fixedToPriceShort(fixedSLpts)
else
activeShortSL := na
if useTP
if tpTypeRR and useSL and not na(activeShortSL)
riskS = activeShortSL - activeShortEntry
activeShortTP := activeShortEntry - riskS * tpRR
else
activeShortTP := activeShortEntry - fixedToPriceShort(fixedTPpts)
else
activeShortTP := na
// reset long
activeLongEntry := na
activeLongSL := na
activeLongTP := na
// init trailing
activeShortTrail := activeShortSL
// Trailing logic (update only when in profit beyond 'lock-in')
if not na(activeLongEntry) and useTrailing
// current unrealized profit in points
currProfitPts = close - activeLongEntry
if currProfitPts >= trailLockInPts
// declare candidate before use to avoid undeclared identifier errors
float candidate = na
if trailType == "ATR"
candidate := close - atr * trailATRmult
else
candidate := close - ta.ema(close, trailEMAlen)
// move trail stop up but never below initial SL
activeLongTrail := math.max(nz(activeLongTrail, activeLongSL), candidate)
// ensure trail never goes below initial SL if SL exists
if useSL and not na(activeLongSL)
activeLongTrail := math.max(activeLongTrail, activeLongSL)
// update SL to trailing
activeLongSL := activeLongTrail
if not na(activeShortEntry) and useTrailing
currProfitPtsS = activeShortEntry - close
if currProfitPtsS >= trailLockInPts
// declare candidateS before use
float candidateS = na
if trailType == "ATR"
candidateS := close + atr * trailATRmult
else
candidateS := close + ta.ema(close, trailEMAlen)
activeShortTrail := math.min(nz(activeShortTrail, activeShortSL), candidateS)
if useSL and not na(activeShortSL)
activeShortTrail := math.min(activeShortTrail, activeShortSL)
activeShortSL := activeShortTrail
// Detect TP/SL hits (for plotting & alerts)
longTPHit = not na(activeLongTP) and close >= activeLongTP
longSLHit = not na(activeLongSL) and close <= activeLongSL
shortTPHit = not na(activeShortTP) and close <= activeShortTP
shortSLHit = not na(activeShortSL) and close >= activeShortSL
if longTPHit or longSLHit
// reset long state after hit
activeLongEntry := na
activeLongSL := na
activeLongTP := na
activeLongTrail := na
if shortTPHit or shortSLHit
activeShortEntry := na
activeShortSL := na
activeShortTP := na
activeShortTrail := na
// Plot EMAs
p_ema9 = plot(ema9, title="EMA9", linewidth=1)
plot(ema21, title="EMA21", linewidth=1)
plot(ema50, title="EMA50", linewidth=2)
// Plot VWAP
plot(vwapVal, title="VWAP", linewidth=2, style=plot.style_line)
// Plot Ichimoku lines (Tenkan & Kijun)
plot(tenkan, title="Tenkan", linewidth=1)
plot(kijun, title="Kijun", linewidth=1)
// Plot cloud (senkouA & senkouB shifted forward)
plot(senkouA, title="Senkou A", offset=displacement, transp=60)
plot(senkouB, title="Senkou B", offset=displacement, transp=60)
fill(plot(senkouA, offset=displacement), plot(senkouB, offset=displacement), color = senkouA > senkouB ? color.new(color.green, 80) : color.new(color.red, 80))
// Plot active trade lines
plotshape(not na(activeLongEntry), title="Active Long", location=location.belowbar, color=color.new(color.green, 0), style=shape.circle, size=size.tiny)
plotshape(not na(activeShortEntry), title="Active Short", location=location.abovebar, color=color.new(color.red, 0), style=shape.circle, size=size.tiny)
plot(activeLongSL, title="Long SL", color=color.red, linewidth=2)
plot(activeLongTP, title="Long TP", color=color.green, linewidth=2)
plot(activeShortSL, title="Short SL", color=color.red, linewidth=2)
plot(activeShortTP, title="Short TP", color=color.green, linewidth=2)
// Arrows / labels
if showArrows
if longCondition
label.new(bar_index, low, "BUY", style=label.style_label_up, color=color.green, textcolor=color.white, size=size.small)
if shortCondition
label.new(bar_index, high, "SELL", style=label.style_label_down, color=color.red, textcolor=color.white, size=size.small)
// Alerts
// alertcondition must be declared in global scope so TradingView can create alerts from them
alertcondition(longCondition, "VWAP+EMA+Ichimoku+RSI — BUY (STRICT)", "BUY signal from VWAP+EMA+Ichimoku+RSI (STRICT)")
alertcondition(shortCondition, "VWAP+EMA+Ichimoku+RSI — SELL (STRICT)", "SELL signal from VWAP+EMA+Ichimoku+RSI (STRICT)")
// Runtime alerts (still use alert() to trigger immediate alerts; webhook is added in TradingView Alert dialog)
if alertOn
if longCondition
alert("VWAP+EMA+Ichimoku+RSI — BUY (STRICT)", alert.freq_once_per_bar_close)
if shortCondition
alert("VWAP+EMA+Ichimoku+RSI — SELL (STRICT)", alert.freq_once_per_bar_close)
// Alerts for TP/SL hits
if longTPHit
alert("LONG TP HIT", alert.freq_once_per_bar_close)
if longSLHit
alert("LONG SL HIT", alert.freq_once_per_bar_close)
if shortTPHit
alert("SHORT TP HIT", alert.freq_once_per_bar_close)
if shortSLHit
alert("SHORT SL HIT", alert.freq_once_per_bar_close)
// Info table
var table info = table.new(position.top_right, 1, 8)
if barstate.islast
table.cell(info, 0, 0, text = 'Trend: ' + (bullTrend ? 'Bull' : bearTrend ? 'Bear' : 'Neutral'))
table.cell(info, 0, 1, text = 'EMA9/21/50: ' + str.tostring(ema9, format.mintick) + ' / ' + str.tostring(ema21, format.mintick) + ' / ' + str.tostring(ema50, format.mintick))
table.cell(info, 0, 2, text = 'VWAP: ' + str.tostring(vwapVal, format.mintick))
table.cell(info, 0, 3, text = 'RSI: ' + str.tostring(rsi, format.mintick))
table.cell(info, 0, 4, text = 'Vol OK: ' + (volOk ? 'Yes' : 'No'))
table.cell(info, 0, 5, text = 'HTF: ' + htfTF + ' ' + (htf_bull ? 'Bull' : htf_bear ? 'Bear' : 'Neutral'))
table.cell(info, 0, 6, text = 'ActiveLong: ' + (not na(activeLongEntry) ? 'Yes' : 'No'))
table.cell(info, 0, 7, text = 'ActiveShort: ' + (not na(activeShortEntry) ? 'Yes' : 'No'))
// End of script
