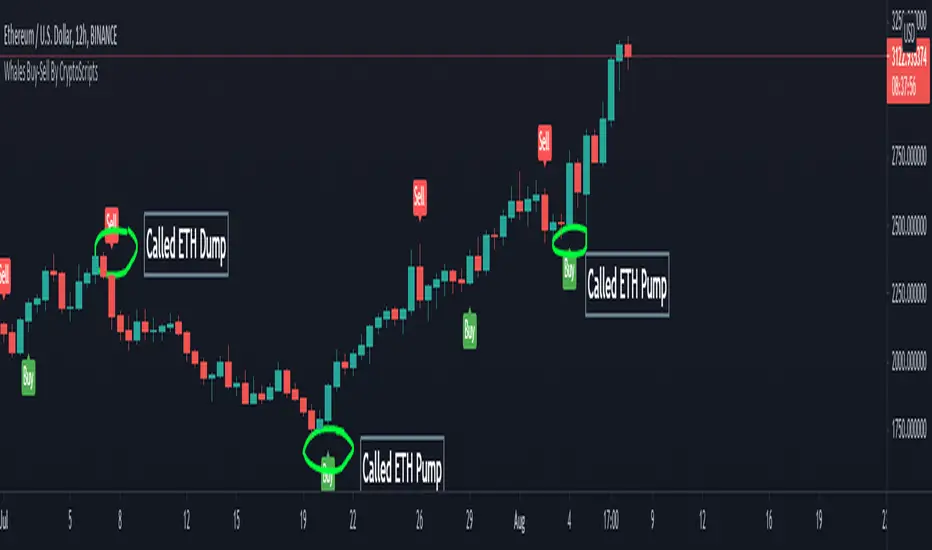
Whales Buy-Sell By CryptoScriptsThe Whales Buy-Sell indicator is very unique because it uses a combination of the smoothing range, average ranges, and hi-band/low-bands combined with various moving averages to nail whenever the overall trend is changing. This is extremely important during periods of high volatility and large moves. It helps to keep someone in a trade longer and get out fast if the trend is changing. The big caveat I can stress is waiting until the candle closes so that you know the signal is confirmed! Use the Bar Replay feature to further understand the intricacies of how the indicator produces signals. I find it is better on larger timeframes (1h and higher) because it's measuring larger trends. It can still be used on smaller timeframes but may not be as accurate. The big shortcoming is that is doesn't do well in choppy environments (i.e barely any price movement up or down) and you may get a lot of back and forth buy/sell signals so PLEASE keep that in mind. Experiment with various tickers/timeframes and see what works best for you :)
This indicator is a trend analysis indicator. Trend analysis is a technique used in technical analysis that attempts to predict future stock price movements based on recently observed trend data. Trend analysis is based on the idea that what has happened in the past gives traders an idea of what will happen in the future, but that is NOT always the case! Past performance is NOT indicative of future returns. There are three main types of trends: short-, intermediate- and long-term. Trend analysis tries to predict a trend, such as a bull market run, and then ride that trend until data suggests a trend reversal, such as a bull-to-bear market.
Alerts
You can set alerts for either a 'Buy Signal' or 'Sell Signal'. I recommend setting alerts for the candle close so that you know the signal is confirmed! If the "Add Alerts" option is greyed out for the indicator, just refresh your tradingview page and you should be able to see it :)
PM me to obtain access and please let me know if you have any questions!
Mata Wang Kripto
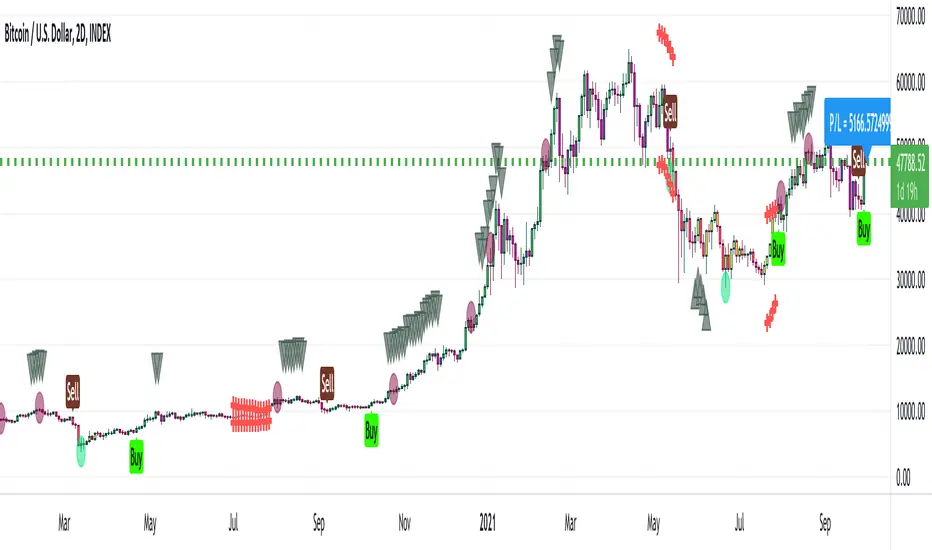
[Joy] Aladdin Long Trading Strategy 1.0.0 AlphaAladdin's Long trading strategy is to test out Aladdin for long trades only
This strategy is mainly used to test whether Aladdin is suitable for a coin/stocks/futures or for any trading. The profitability, average drawdown, average profits, etc are used by me to decide whether to use it for trading.
What is Aladdin and what does it do?
Using the volume and gradual flow of non-interrupted data (wicks and body of the candles), it tries to detect the macro condition of the market so that one may know in which direction the market is flowing.
* Bearish / Sell sign: On the candle's close, I open a short position
* Bullish sign: On the candle's close, I open a long position
* I take at least 50% profit when the indicator indicates to do so. One can configure that value as desired from the configuration depending on one's risk/money management. I might even convert some portion of the position into stable coins.
FAQ
Q: Does it use some EMA /MA/etc.? Does it use any indicator with tweaked settings?
Answer: No.
Q: What does it mostly depend on?
Answer: Volume and gradual flow of non-interrupted data. The logic depends purely on volume , price bars and the wicks.
Q: Does it work with all coins, stocks, futures, instruments?
Answer: I prefer to use the exchange with the best possible data. Then backtest out to find the best possible timeframe, stop loss and target all derived from this script data.
Q: Can you make it free or make it open source?
Answer: There is no free lunch in this world. I will never reveal or share the source code!
Q: Do you provide ongoing support for the indicator?
Answer: Yes, as long as I can, I will continue updating the indicator
Q: Are the bullish /buy & the bearish/sell markers automatic?
Answer: I have no control over the markers. It is driven purely by logic from the script.
Q: Is this financial advice?
Answer: This is not financial advice. I do not guarantee any profit or loss. I am not responsible for any of your losses or profits. My indicators do not assure profit or loss. It also does not auto-open or auto-close a trade.
Assumptions:
Only long trades are opened and closed. No short trades.
Starting Capital: $20,000
Order Size: 20% of Capital
Data used: Whatever data is available from 2011 till today on Trading view
Findings:
INDEX: BTCUSD 83% profitability using 2day tf
54 closed trades
Profit factor: 16
Sortino Ratio: 5.2
Average Winning Trade: 30%
Average Losing Trade: 9.12%
Largest Winning Trade: 1218%
Largest Losing Trade: 20.25%
Below are the profitability rate for the timeframe and the coins listed as found by running the trading strategy over the following as of today (Aug 1st 2021 12:40 pm Sydney Time).
⚜️ INDEX:BTCUSD 83% using 2day tf
⚜️INDEX:ETHUSD 80% using 1day tf
⚜️FTTUSD 81% using 2day tf
⚜️SRMUSD 71% using 1day tf
⚜️ADAUSDT 81% using 2day tf
⚜️ALGOUSD > 90% using 2day tf
⚜️ALTPERP 81% using 2day tf
⚜️AVAXUSDT 75% using 1day tf
⚜️BANDUSD > 90% using 2day tf
⚜️BCHUSD 82% using 2day tf
⚜️BNBUSD 79% using 1day tf
⚜️BNBUSD 85% using 2day tf
⚜️CHZUSD 71% using 1day tf
⚜️COMPUSD 81% using 1day tf
⚜️DOGEUSD 77% using 1day tf
⚜️EXCHPERP 83% using 1day tf
⚜️FILUSD > 90% using 1day tf
⚜️FTMUSD 70% using 2day tf
⚜️HTUSDT 75% using 2day tf
⚜️KINUSD >90% using 2day tf
⚜️LINKPERP 85% using 2day tf
⚜️LTCUSD 80% using 2day tf
⚜️MATICUSD 77% using 2day tf
⚜️NEOUSD 80% using 1day tf
⚜️NEXOUSD > 90% using 1day tf
⚜️OKBUSD 71% using 1day tf
⚜️OMGUSD 75% using 1day tf
⚜️RSRUSD 87% using 1day tf
⚜️RUNEUSD > 90% using 1day tf
⚜️SHITPERP > 90% using 1day tf
⚜️SOLUSD 84% using 1day tf
⚜️SUSHIUSD 71% using 1day tf
⚜️THETAUSD > 90% using 2day tf
⚜️UNIPERP 83% using 1day tf
⚜️VERTPERP > 90% using 1day tf
⚜️XAUUSD 63% using 2day tf
⚜️XTZUSD 83% using 2day tf
⚜️ZECUSD 72% using 2day tf
Disclaimer:
No one knows what will happen in the future. DYOR and decide on your own conditions. Do realize that neither I nor my indicator can guarantee any profit or loss. And there is no assurance that any trade will ever result in any profit. It is not financial advice.

RSVP Extractor By CryptoScriptsThis indicator has the same alerts as the VP Extractor except I overlaid the RSI on top of it (yellow line) to help take advantage when the RSI is overbought/oversold while also being able to see what the VP extractor is saying :)
It highlights yellow any time the RSI is below 30 (potential buy signal) and highlights orange anytime the RSI is above 70 (potential sell signal). You can also adjust the settings so that it'll highlight yellow when RSI is below 25 or 20 etc. so you can pick whatever value you want and the colors will adjust accordingly :) You can also set alerts for RSI overbought/oversold!
Please see the VP Extractor Alerts below! Those are still the same as before but since I now have RSI then you can be more confident in your signals if RSI is flashing a yellow shaded area (oversold) and the VP extractor is flashing a rocket symbol (buy), then both together would be a very strong buy signal. Using the RSI signals with the VP Extractor signals below will make you VERY successful with this indicator :)
The VP Extractor signals is a combination of the Volume Extractor and Price Extractor. There was a lot of coding involved in this one and it involves a Volume / Price Oscillator derived from various volume /price metrics combined with Bollinger Bands and Overbought/Oversold levels. This indicator is unique because it not only measures the standard deviations whenever the oscillator crosses outside the BBs but it does so at ranges that are most advantageous for the trader to identify KEY buy/sell levels (as shown above). I'll break down each signal below and how to best take advantage of them so you can get the best entries and capture the most profit per trade.
*This indicator works best on the Binance or Bybit exchange for crypto but also works for stocks and forex. It's best used on small-medium timeframes such as the 15min, 1h, 4h, 8hr, or 12h. It tends to give more false signals on the 1D timeframes and higher.
Red Alarm - this signal indicates that the volume and/or price oscillators are overbought and/or crossing outside of the bollinger bands . This is a STRONG sell signal but should still be combined with support/resistance levels and confirmed with other indicators.
Red Diamond - this signal indicates that the volume and price oscillators are crossing outside of the bollinger bands above the 20 level but is not yet overbought. This is a potential sell signal but should still be combined with support/resistance levels and confirmed with other indicators.
Red Shaded Area - this indicates the volume and price oscillators are overbought. This is a potential sell signal but should still be combined with support/resistance levels and confirmed with other indicators.
Rocket - this signal indicates that the volume and/or price oscillators are oversold and/or crossing outside of the bollinger bands . This is a STRONG buy signal but should still be combined with support/resistance levels and confirmed with other indicators.
Green Diamond - this signal indicates that the volume and price oscillators are crossing outside of the bollinger bands below the 20 level but is not yet oversold. This is a potential buy signal but should still be combined with support/resistance levels and confirmed with other indicators.
Green Shaded Area - this indicates the volume and price oscillators are oversold. This is a potential buy signal but should still be combined with support/resistance levels and confirmed with other indicators.
Input Options
Show 80 Levels - This checkbox will create a red zone and green zone for the 60-80 levels on the indicator. This is useful if the volume and price oscillators reaches one of these levels, you can be sure it's going to reverse soon and can have more confidence if it crosses outside of the BBs in addition to that.
VEO Length - This changes the height of the oscillator and will change how your signals flash (more or less often). Use this if you find you're getting too many signals or not enough. I find this is best at 21 but feel free to test out what works for you depending on your timeframe.
Moving Average Volume Source - This is currently set to None but you can change it to Exponential, Hull, or Simple moving average . I found that None works best but feel free to test out the different options.
Moving Average Length - Changing this length will do nothing to your chart if None is selected for the Moving Average Volume Source, therefore you will most likely keep this setting default at 9.
Alerts
I've set alerts on this indicator for each icon (Red Alarm, Red Diamond, Overbought, Rocket, Green Diamond, Oversold). I HIGHLY recommend setting the alerts for Candle Close so that you can be sure the signal is confirmed.
You may notice that the indicator can give multiple signals back-to-back or be overbought/oversold for multiple candles. When this happens, it's best to look at other indicators such as the RSI , MFI Pro, etc to nail the best entry and have confluence with your decision. With that said, having multiple signals back-to-back can also be an indication that the move is close to happening.
This indicator is a strong indicator by itself but works best when combined with my other indicators just as the Whales Buy-Sell and the MFI Pro as well as the RSI , and MACD i.e taking a trade when all indicators are showing overbought, "Buy", "Sell", etc. Measuring volume and price action is an extremely important aspect of trading and one I believe should not be overlooked. I hope I made everything as clear as possible and please let me know if I didn't.
PM me to obtain access and please let me know if you have any questions! :D

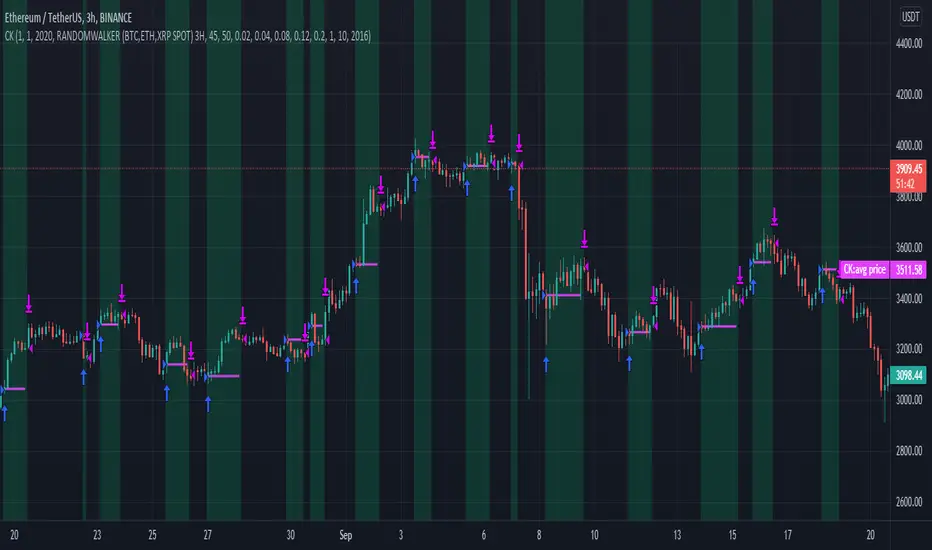
[Joy] Aladdin (1.0.0 Alpha)Explanation of the markers in the indicator
* Bearish / Sell sign: On the candle's close, I open a short position
* Bullish sign: On the candle's close, I open a long position
* Red circle: On the candle's close, I take at least 50% unrealized profit into a realized profit of any running long leverage position. I might even convert some portion of the position into stable coins.
* Green circle: On the candle's close, I take at least 50% unrealized profit into a realized profit of any running short leverage position. I might even convert some portion of the position into stable coins.
* Down Arrows: When the down arrow finishes and the candle close, I put a tighter stop loss of any running long leverage position. It sometimes indicates the local top.
* Up Arrows: When the up arrow finishes and the candle close, I put a tighter stop loss of any running short leverage position. It sometimes indicates the local bottom.
* Purple candle: Weakly bullish.
* Green candle: Strongly bullish
* Red candle: Strongly bearish
* Yellow candle: Weakly bearish
FAQ
Q: Does it use some EMA /MA/etc.? Does it use any indicator with tweaked settings?
Answer: No.
Q: What does it mostly depend on?
Answer: Volume and gradual flow of non-interrupted data. The logic depends purely on volume, price bars and the wicks.
Q: Does it work with all coins, stocks, futures, instruments?
Answer: I prefer to use the exchange with the best possible data. Then backtest out to find the best possible timeframe, stop loss and target all derived from this script data.
Q: Can you make it free or make it open source?
Answer: There is no free lunch in this world. I will never reveal or share the source code!
Q: Do you provide ongoing support for the indicator?
Answer: Yes, as long as I can, I will continue updating the indicator
Q: Are the bullish /buy & the bearish /sell markers automatic?
Answer: I have no control over the markers. It is driven purely by logic from the script.
Q: Is this financial advice?
Answer: This is not financial advice. I do not guarantee any profit or loss. I am not responsible for any of your losses or profits. My indicators do not assure profit or loss. It also does not auto-open or auto-close a trade.
Note:
The Aladdin has been derived from the Super Algorithm Indicator. I have depreciated the Super Algorithm Indicator I have automatically migrated every user to Aladdin, who had Super Algorithm Indicator. One should not use the SA indicator. One should start using this indicator instead.
Version 1
A derived version of Super Algorithm Indicator with optimized code (uses arrays, removes few warnings in the code, makes code more reusable) so that I can add further features in the future. A few new coding features in the pine script encouraged me to go for this version. Since the codebase has been revamped, it made sense for me to make it a new indicator. have also changed a small parameter that is configurable at the moment. Previously it was valued at 26. Now I am putting value at 21.
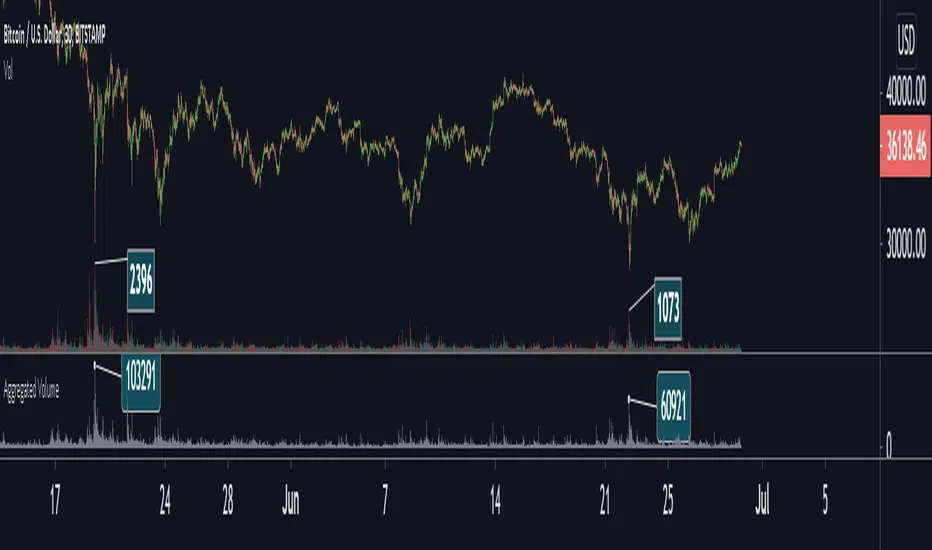
Aggregated Volume Colored (Bitcoin, ETH, Altcoins, everything)BITSTAMP:BTCUSD
This indicator aggregates trading volume data of up to 10 symbols and can display the individual data by color.
It is useful for assets which are traded on multiple exchanges, like cryptocurrencies, commodities, forex and derivatives showing you what is happening across the market and on the individual exchanges to give you beter insights.
You can change the symbols from which the indicator gathers data in the settings under inputs, just like the colors, and you can add a moving average.
By default trading volume is aggregated from the following symbols:
Binance, BTC /USDT
Binance, BTC /BUSD
Bingbon, BTC /USD
Huobi, BTC /USDT
OkeX, BTC /USDT
Coinbase, BTC /USD
Bitfinex, BTC /USD
Gemini, BTC /USD
Kraken, XBT/USD
Bitstamp, BTC /USD

Compare Crypto Bollinger Bands//This is not financial advice, I am not a financial advisor.
//What are volatility tokens?
//Volatility tokens are ERC-20 tokens that aim to track the implied volatility of crypto markets.
//Volatility tokens get their exposure to an asset’s implied volatility using FTX MOVE contracts.
//There are currently two volatility tokens: BVOL and IBVOL.
//BVOL targets tracking the daily returns of being 1x long the implied volatility of BTC
//IBVOL targets tracking the daily returns of being 1x short the implied volatility of BTC.
/////////////////////////////////////////////////////////////////
CAN USE ON ANY CRYPTO CHART AS BINANCE:BTCUSD is still the most dominant crypto, positive volatility for BTC is positive for all.
/////////////////////////////////////////////////////////////////
//The Code.
//The blue line (ChartLine) is the current chart plotted on in Bollinger
//The red line (BVOLLine) plots the implied volatility of BTC
//The green line (IBVOLLine) plot the inverse implied volatility of BTC
//The orange line (TOTALLine) plots how well the crypto market is performing on the Bolling scale. The higher the number the better.
//There are 2 horizontal lines, 0.40 at the bottom & 0.60 at the top
/////////To Buy
//1. The blue line (ChartLine) must be higher than the green line (IBVOLLine)
//2. The green line (IBVOLLine) must be higher than the red line (BVOLLine)
//3. The red line (BVOLLine) must be less than 0.40 // This also acts as a trendsetter
//4. The orange line (TOTALLine) MUST be greater than the red line. This means that the crypto market is positive.
//5.IF THE BLUE LINE (ChartLine) IS GREATER THAN THE ORANGE LINE (TOTALLine) IT MEANS YOUR CRYPTO IS OUTPERFOMING THE MARKET {good for short term explosive bars}
//6. If the orange line (TOTALLine) is higher than your current chart, say BTCUSD. And BTC is going up to. It just means BTC is going up slowly. it's fine as long as they are moving in the same position.
//5. I use this on the 4hr, 1D, 1W timeframes
///////To Exit
//1.If the blue line (ChartLine) crosses under the green line (IBVOLLine) exit{ works best on 4hr,1D, 1W to avoid fakes}
//2.If the red line crosses over the green line when long. {close positions, or watch positions} It means negative volatility is wining

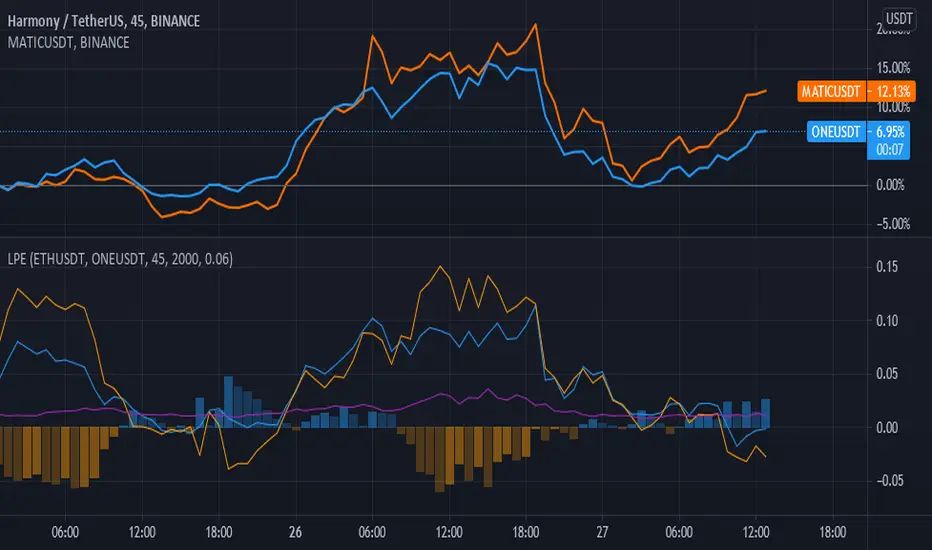
Liquidity Pair Impermanent Asset LossWith limited tracking of impermanent loss for liquidity pairs across all chains, I wanted a very simple display of live dollar value loss in an asset pair. This should allow you to set alerts based on how much you are down and take action if needed. The output column is by default set to show your losses in USD. For those that need it, I also setup an option to track the output in something other than USDT, e.g., GBP or ETH, etc..
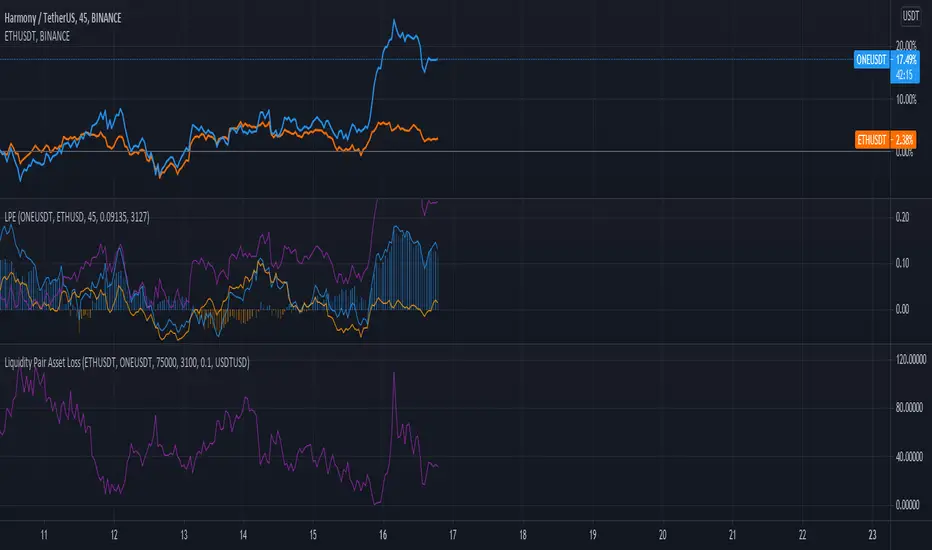
Liquidity Pair EvalWhile there are many tools for generating your impermanent loss in liquidity pools, depending on your choice of chain, I was mostly concerned about monitoring the creep between the pairs. This V0.1 attempt should give us a general comparison of the selected asset returns given your time period and also display the percent loss assuming the initial purchase price values are input correctly.
This is a work in progress and I am open to suggestions to make this even better.
GMMAs v2.0 CRYPTO [badshah_e_alam]Hello Traders ,
The GMMAs v2.0 CRYPTO strategy stands for gap modified moving averages designed for cryptos. This is a non Repainting Indicator.
This strategy version is a advanced and modified to one of my previously published indicator named as "gap modified moving average".
I am using my Modified Moving Average indicator for a while. I always wanted to add some more information to moving
averages and made some modification to Moving averages.
The additional Information I have added to the Moving Average helps it to act more quickly based on the price of that
particular asset.
How is strategy gives signals?
when the GMMA'w cross over or cross under the GMMA'y than a trade is taken depending on the filter status.
Info about the settings :
The default setting is for 11m ETHUSD , it works with other cryptos and other timeframe as well . For other timeframes it need to be fine tuned and need little change.
The first category is for the selection of Moving average to be modified and the source to be used for that moving average .
I have added seven moving averages to choose between. SMA works good for me , you can choose and play with other MAs.
following are the option to choose MAs
1.EMA
2.SMA
3.HMA
4.RMA
5.WMA
6.VWMA
7.SWMA
Next option in setting is GMMA'y and GMMA'w :
these two settings define the length and lookback period of the MA you have choosed above.
The length is similar to the length of the moving average chosen to be modified.
The lookback option will look for that number of bars for the modification.
GMMA'w is more sensitive than the GMMA'y. So make sure that the setting input of the GMMA'y is significantly larger than the
GMMA'w.
FILTER:
I have added TradingView inbuilt SUPERTREND as a filter in the strategy, it works very good in filtering out false trades
you can enable/disable it in the settings.
EXIT strategy:
The exit Strategy is based on ATR, Take profit and SL are decided by the ATR in the SL/TP setting option. You can change the RR ratio in the setting.
The backtest settings are as follow:
Initial capital:10k
Initial Commission = 0.000
Initial Pyramiding = 0
Reference :
Thanks to pinecoders and Tradingview community.
my previous gap modified moving average version is :https://in.tradingview.com/script/e3WestBa-Gap-Modified-Moving-Average/
watermark added from:
color gradient framework picked from :https://in.tradingview.com/script/hqH4YIFa-Color-Gradient-Framework-PineCoders/
DISCLAIMER
Any and all liability for risks resulting from investment transactions or other asset dispositions carried out by the user based on information received or a market analysis is expressly excluded by me.
All the information made available here is generally provided to serve as an example only, without obligation and without specific recommendations for action. It does not constitute and cannot replace investment advice. We therefore recommend that you contact your personal financial advisor before carrying out specific transactions and investments.
Do your own research and Risk management before taking any trade.

Chaikin Money Flow + MACD + ATRHere I present you on of Trade Pro's Trading Idea: Chaikin Money Flow + MACD + ATR.
This strategy is not as profitable as it can be seen in one of his videos. In the forex market, the strategy could reach a maximum of 35% profitability.
I have, as some of my followers have requested, created an overview of the current position, risk and leverage settings in the form of a table.
Furthermore, one can again swap between short and long positions.
It is now possible to select or deselect individual indicators.
I have chosen the ATR alone as a take profit stop loss, as in his strategy.
A position is only triggered as soon as all prerequisites have been fulfilled and a command is executed. This prevents false triggering by bots and repainting.
-----------------------------------------------------------------------------------
How does the strategy work?
ENTRY
Long
The MACD indicator must be above the zero line.
Then the K line must cross the D line.
Finally, when this happens, the Money Flow Index must be above the zero line.
Short
Contrary to the premise of long positions.
EXIT
ATR Exit
The value of ATR at the time of buying is multiplied by the value entered in "Profit factor ATR" and "Stop factor ATR". As soon as the price reaches this value, it is closed.
Important
The script must be optimized for each coin or currency pair.
I will publish a guide to the strategy shortly. There I will explain how the table works and how to set the strategy correctly.
The results of the strategy are without commissions and leverage.
If you have any questions or feedback, please let me know in the comments.

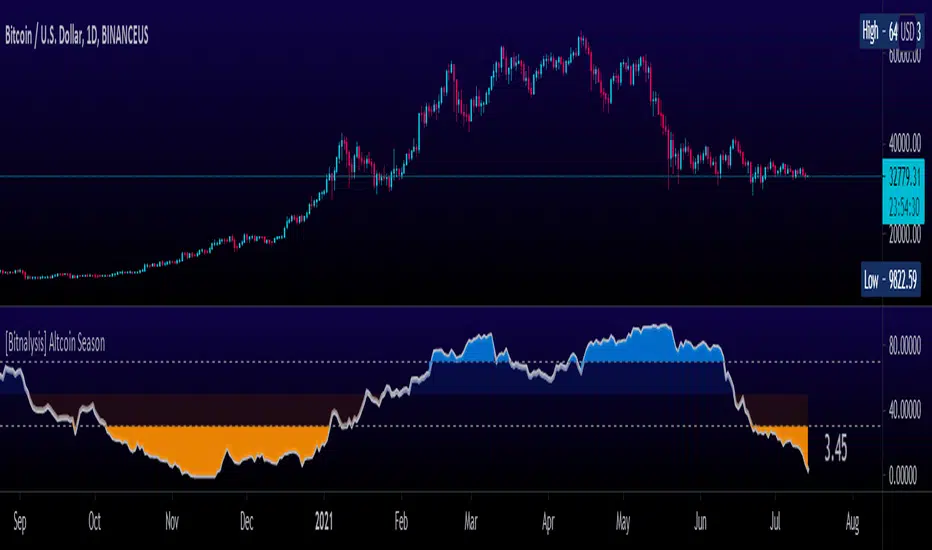
[Bitnalysis] Altcoin Season IndicatorThe Altcoin Season Indicator compares performance of Bitcoin with the performance of the top altcoins over a specified period. The indicator weights the results, giving greater weight to the first specified altcoins. By default, the larger market cap altcoins, such as ETH, BNB, ADA, etc., are included first and therefore given greater weight in the algorithm. To remove the weighting from the formula and consider the performance of all listed altcoins equally, set the weighting setting to "0".
The output shows to what extent altcoins are outperforming Bitcoin; the higher the number, the more altcoins are outperforming Bitcoin. This indicator helps traders predict when "altcoin season" is about to begin or end.
MacroCorrelation (Bitcoin Real Value)The best minds in the financial world think about how to determine the real value of an asset.
I constantly say that it is necessary to buy an asset only at the moment when its market price is below or equal to its fundamental value. Let's see what is the difference between these two concepts.
Fundamental value
Imagine that we decided to grow and sell, for example, strawberries. For this, we purchased the necessary equipment, tools, fertilizers, seeds, and more. Let's say that we needed $ 3000 for this purpose.
To facilitate the task, in our calculation we will not take into account all types of possible costs (electricity cost, workers' wages, necessary tax deductions, etc.).
If we had to take a loan to meet the initial needs, for example, at 10% per annum , then each borrowed $ 1000 in a year would cost us $ 1100. That is, $ 3000 would cost us $ 3300 per year.
Let's agree that our initial funds were completely enough to buy everything we needed, and we didn't need to take out a loan at a certain percentage. In this case, we exclude from the calculation the cost of the capital required to start your own business.
Suppose we managed to harvest 100 kg of strawberries. This means that the real value (fundamental value) of 1 kg of our strawberries is $ 30.
Market price
Things are a little different with the market price. The market price is determined by the volume of supply and demand for a particular product or service at a particular point in time.
By demand, we mean the intention to purchase a product or service (secured by the ability to pay a set price for it). A need that exceeds solvency is not a demand.
By offer, we mean the willingness to provide ownership (use) of the object of demand for a certain fee.
Simply put, the market price is the price at which the buyer is willing to buy (and the seller to sell) the volume of goods we need.
In our case, the price at which we sell 1 kg of our strawberries will depend on how much people really need our strawberries.
If we are the only sellers of strawberries in a certain territory and, at the same time, buyers really want to taste fresh strawberries, its market price can be as high as the last buyer is able to pay. If not, everything will depend on how high quality our product will be for its price. At the same time, the price constantly varies over a certain period of time ( seasonality and other factors). For example, if in winter we could sell 1 kg of our strawberries for $ 90, then in summer for $ 50. Strawberry prices range from $ 50 to $ 90.
Magic formula
We now understand what is the difference between fundamental value and market price. If the first is made up exclusively of a set of real metrics, the second is a variable factor that depends primarily on “human factors” (what is the maximum price the buyer is willing to pay, what is the minimum price the seller is willing to set at a particular moment in time).
You should try to buy an asset only at the moment when its market price is below or equal to its fundamental value.
However, how can you independently determine the fundamental value of an asset?
Unfortunately, there is no universal answer to this question, just as there is no universal “magic formula” in nature (my sincere respect, Joel Greenblatt) that could determine the fundamental value of any asset on the planet. The point is precisely in the criterion of universality. If we consider each asset (or at least the market) separately, we can well determine its fundamental value.
Even those things that seem free to us in everyday life (just their cost are negligible) have a fundamental value.
Three factors to assess the fundamental value of Bitcoin
Let's try to take a separate asset, for example Bitcoin , and do with it everything that we did earlier with our “strawberry business”.
When assessing the real (fundamental) value of Bitcoin , we will take into account 3 main factors.
1. The maximum possible and current supply in the Bitcoin market
The reward for mining a Bitcoin block is halved every 210,000 blocks. This fact is called halving (halving). When all blocks are mined, the total amount of existing bitcoins will be 21 million coins.
Accordingly, the maximum supply in the Bitcoin network will not exceed 21 million coins.
In reality, things are even better, since this volume also includes a certain amount of lost coins. By lost, we mean all those coins whose “private keys” the last owner no longer has access to. For example, at the time of the appearance of Bitcoin in 2009, its real value was doubtful and not obvious to most of its owners, many of whom did not pay due attention to understanding the safe storage of an asset, periodically losing access to hundreds and thousands of coins.
As a result, we understand that the total supply in the Bitcoin market will be significantly less than 21 million coins.
To evaluate the proposal, it is not enough to understand how much of the asset exists, because a certain amount of it, as we have already understood, can either be lost or be blocked for a long time. It is also important to take into account the criterion of “supply in time”. That is, the current total “liquidity” of the network.
2. Bitcoin network hashrate
The main indicator of the viability and stability of the Bitcoin network is the hash rate (computing power). Stable hashrate = network security.
3. The real value of the US dollar
When analyzing the Bitcoin / Dollar pair, in addition to the real value of Bitcoin , it is also necessary to take into account the real value of the US Dollar .
It is believed that assets such as stocks or cryptocurrencies are extremely volatile (the price can change over a wide range within a relatively short period of time). At the same time, to reduce volatility , experts advise using the so-called “currency baskets”.
A currency basket is a certain percentage of foreign currencies in which the investor's capital can be distributed. The ratio of currency units in the basket is used to reduce the potential risk of currency fluctuations.
The main problem is that, due to inflation , the purchasing power of the currencies themselves drops significantly over time.
With the $ 100 we earned in 1913, already in the 1920s we could have purchased 50% fewer goods and services than before. In the 1980s, it was 90% less, and in the 2010s it was already 98% less.
This fact must also be taken into account when assessing the real value of Bitcoin , since everything is relative, and in the Bitcoin / Dollar pair, we determine the value of Bitcoin , expressed in US dollars.
The real value of Bitcoin
After assessing the relationship of the factors described above and drawing up a mathematical formula, we can proceed to the analysis of the results. In order to cut off unnecessary noise when constructing the function, we will use the graph for 1 month.
Analyzing the resulting chart, first of all, the following is striking: the fundamental value of Bitcoin grows over time. This is due to the gradual expansion of the "user base" of the network, as well as the growth of its popularity among investors of completely different classes.
I propose to compare the graph obtained earlier with the graph of Internet users (in% of the number of adult US citizens ). Similar, don't they?
The more the number of Internet users, the higher its influence and economic potential. The more the number of users of the Bitcoin network, the higher its economic potential and fundamental value.
However, understanding the fundamental value alone is not enough. We, as investors, first of all need to understand when to buy any asset.
To do this, compare the chart of the market price of Bitcoin with the chart of its fundamental value obtained earlier.
Now that we have a complete picture of what is happening and understand both the fundamental value of the asset and its market price, the fact of the numerical prevalence of the price over the fundamental value for 116 out of 133 months becomes quite clear. Periods of Bitcoin being below its fundamental value are extremely rare and only take ~ 13% of the trading time.
For about 87% of all trading time, Bitcoin's market price is above its fundamental value. Those rare periods when traders are willing to sell bitcoin below its fundamental value are an incredible gift for a long-term investor.
Bull and Bear Markets
If you buy Bitcoin (like any other asset) below its fundamental value, this is an absolutely incredible idea in terms of potential profitability, who in their right mind would sell their assets below this mark ?!
It's all about the emotionality of people. Saying “I will not do stupid things when the time is right” is easier than actually maintaining composure. Especially when it comes to money. Your money. And sometimes even dreams.
The classical market theory usually divides the market into two main phases: A bull market is a period of time during which the price rises systematically (accordingly, the demands and expectations of traders gradually grow). A bear market is a period of time during which the price gradually falls (accordingly, traders' requests and expectations gradually fall).
There is also the concept of “correction”: A correction is a temporary change in the price of an asset, contrary to the main trend.
For the current day, there is not a single clear criterion that separates the concept of a bear / bull market from the concept of a correction. However, we can say with confidence that the market change (from bullish to bearish or from bearish to bullish ) is interconnected with the fundamental factors of the market. Corrections, on the other hand, have significantly less connection with fundamental indicators.
and are rather related to the “physiology of the market” (nothing can only rise in price every unit of time for a significantly long time, nothing can only fall in price every unit of time for a significantly long time).
In this case, the most rational would be to define a bear market as a delay in updating the absolute historical highs of the price with a preliminary touch of the fundamental value.
Buying below the fundamental value is always a smarter idea than buying above the fundamental value, since, in most cases, it is the touch of the fundamental value that globally separates a bear and a bull market.
Fun fact: If we were to buy Bitcoin every time it touched the fundamental value, the average buy price as of July 2021 would be $ 1,506.65, which is 87% less than the current fundamental value of Bitcoin .
Conclusions
1. The total amount of Bitcoins , as well as the speed of their production (mining) over time, are programmatically limited, which limits the volume of the maximum possible supply
2. Bitcoin is transported, which means that the volume of supply for the current minute will also depend on the actual volume of assets available for sale
3. The viability of the network is based on the amount of computer power supporting it (network hash rate)
4. When analyzing the Bitcoin / Dollar pair, in addition to the real value of Bitcoin , it is also necessary to take into account the real value of the US Dollar
5. Price ≠ fundamental value
6. Buying below the fundamental is always a smarter idea than buying above the fundamental.
7. Don't believe the headlines of financial news and the public words of financiers
8. Selling strawberries can make a fortune too

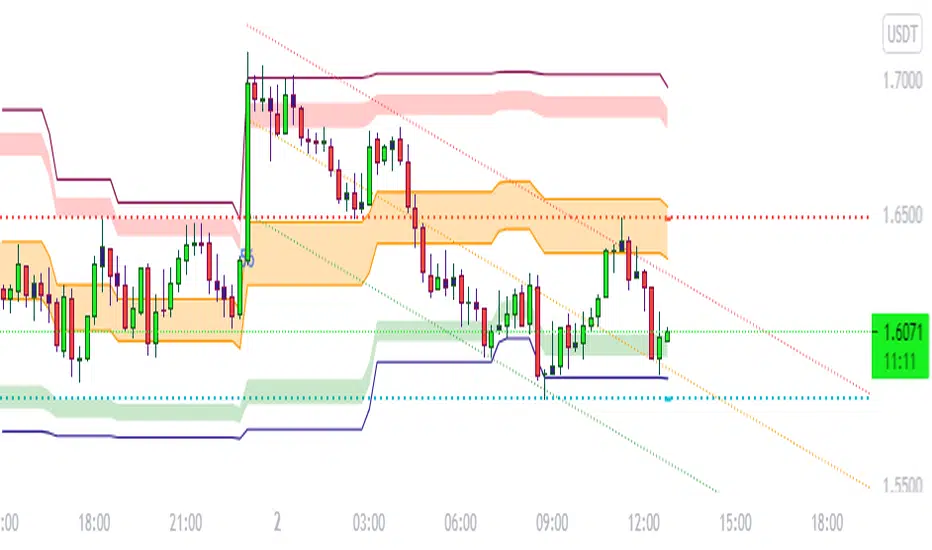
Value Area OscillatorThis is an oscillator version of the Value Area Indicator. The Value Area Indicator employs a custom, volatility-weighted moving average formula, which produces a moving average that becomes more reactive during volatile periods. The indicator then provides fibonacci channels above and below the main MA line. The fibonacci channels are sized based on the "golden ratio." This indicator may be helpful to show when the particular cryptocurrency or other instrument is oversold or overbought. If you are looking to add to your position, this indicator can help determine the best times to do so.

Value Area IndicatorThe Value Area Indicator employs a custom, volatility-weighted moving average formula, which produces a moving average that becomes more reactive during volatile periods. The indicator then provides fibonacci channels above and below the main MA line. The fibonacci channels are sized based on the "golden ratio." This indicator may be helpful to show when the particular cryptocurrency or other instrument is oversold or overbought. If you are looking to add to your position, this indicator can help determine the best times to do so.

Quantum Cryptocurrency Strength Indicator (CCSI)Exciting new markets require exciting new indicators and with the plethora of cryptocurrencies now available and increasingly being offered through mainstream brokers, at Quantum Trading we thought it was time for us to step in and develop something unique to help traders and investors trading the new kids on the block.
Cryptocurrencies like their more established cousins in forex, are in a constant state of flux moving from overbought to oversold and back again, but at a much faster pace, and generally associated with volatility. The challenge of course is picking those phases of price action where these conditions have been met and so offering the trader two opportunities. Either to take a position ahead of any reversal and so get in early before the trend develops, or alternatively to wait until the trend is underway and then jump in. You can think of this as a train in the station. Do you board early before it leaves, or jump aboard once it is underway? Both approaches have advantages and disadvantages, but the choice is yours.
So, our development team set to work to deliver the perfect indicator to deliver this information for you visually and quickly, and we are proud to announce the Cryptocurrency Strength Indicator or the CCSI for short. And if you thought this looks similar to its hugely popular currency strength indicator for forex then you would be right.
This indicator is of course a little different, though the principles of how to use it can be considered the same. So how does it work? Well, first of all, here we are dealing with a cryptocurrency pair, rather than isolating out the currency itself, as every cryptocurrency is quoted against the USD in some way. In these markets we are seeing the movement of the cryptocurrency against the US dollar and in developing the indicator we have chosen to display this against Tether. In other words, USDT.
The indicator displays seven of the most popular cryptocurrencies against the USDT, but what we have also included in the design is the option to deselect these and select others of your choice, so you have complete control of those cryptocurrencies you wish to trade. In addition, we understand that alerts are a hugely popular function of the TradingView platform, so we have added these in these also. And of course, as you would expect we have included the option to isolate out those of interest. So how do we use the indicator?
First, as you might expect, the cryptocurrency market tends to move ‘en mass’ – in other words generally either moving higher or lower together. You can think of this as an equivalent to the currency matrix in forex, where currencies of one denomination, such as the yen will all move in the same direction if the yen is being bought or sold universally. It is the same here. On occasion, on the faster timeframes, one does see divergence, but as a general rule, they will all tend to move together which is great as it gives you the confidence you are trading in the direction of the entire market. What is important however is the direction of the USDT. This will ALWAYS be in the opposite direction which is why we isolate it out from the others, to reveal precisely how this is moving. Remember, what drives a strong trend is when one currency is rising and another falling in forex and it is exactly the same here. When the USDT is rising strongly and the cryptocurrencies are falling, then a strong trend is underway. Equally, if the USDT is falling strongly then you will see a strong trend in your chosen cryptocurrency.
Next, we look for overbought and oversold opportunities in precisely the same way as for the currency strength indicator. Cryptocurrencies are in a constant state of flux moving from oversold to overbought and back again in all timeframes so there are always plenty of opportunities to employ this tactic and get in early at the start of a new trend. The angle of inclination of the line reveals the strength of the move, but equally, if the cryptocurrencies are moving sideways along with the USDT then we have to wait and be patient. But the beauty of this market is that it genuinely trades twenty-four hours a day, and seven days a week. Trend trading is another great tactic and as soon as the move is underway you can jump on the moving train and join a current trend and with cryptocurrencies, you don’t normally have to wait long as the price action is constant.
However, don’t just think of the Cryptocurrency Strength Indicator as a tool for simply getting you in. It will also help you to stay in and get out at the right time. After all if it’s good enough to get you in then it’s good enough to keep you in also. But remember, when the lines are moving sideways along with the USDT, then it’s a question of being patient and waiting. In other words, it helps to keep you out too.
The indicator works in all timeframes on the TradingView platform from seconds and upwards, so all trading approaches and tactics are catered for with this indicator. It can be used with any instrument whether through a conventional broker or for trading binary options which are extremely popular, and of course cryptocurrency futures too.

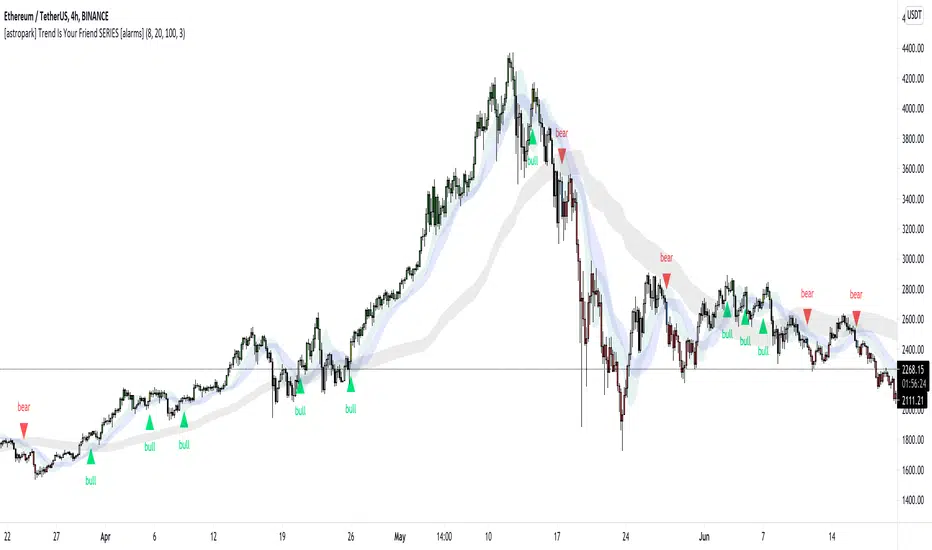
[astropark] Trend Is Your Friend SERIES [alarms]Dear Followers,
today I'm glad to present you an indicator which is a mix of three indicators of mine: Trend Is Your Friend Series !
As you may easily understand from the name, this indicator incorporates all 3 Trend is You Friend indicators I made in past.
This way you can control all of them just with one indicator.
Of course this comes with some useful integration features:
a bull green triangle appears when all trends are bullish (you can set an alert for this)
a bear purple triangle appears when all trends are bearish (you can set an alert for this)
bar coloring reflects the bullish/bearish integration too
you have an option to enable/disable all trends buy/sell signals
you have an option to hide trend clouds borders (chart will be way cleaner this way)
you can still customize each trend indicator settings and set alerts on each trend individually
you can enable/disable heikin ashi analysis
As per Trend is Your Friend V1/V2/V3, this indicator is for higher timeframe trading, from 4h and above is suggested.
This indicator is pretty good for both Swing and Scalping , you can run it over a bot or use it on Renko chart!
If you are a scalper, you will love suggested entries for fast profit. You can run it on 1h timeframe in this case (below is not suggested, there is "no-trend" below 1h!). If you are used to scalp trading, be sure to close each trade whenever you feel happy (a proper trailing stop strategy is suggested for example).
As I always say, all tools are great if you use them correctly: this is not the "Holy Grail", so always use proper money and risk management strategies.
For your reference, here you can see original basic indicators that were integrated here:
V1 backtesting strategy
V2 backtesting strategy
V3 backtesting strategy
This is a premium indicator , so send me a private message in order to get access to this script.
BULLSEYE BORDERS (Combined Price Action Follower)Developed for Crypto Currency Market! Use for 15 minutes period or more! Under 15 minutes, results are unpredictible.
This script had been orginized with Donchian Lines based on support and resistance levels.
Rules:
If the price is under top line, you will be ready for short position, and over the bottom line, long position.
When the price passes the red and green area you can take action and enter the trade!
Orange area refers the squeezed or floating position, so you can either stop or wait for price action!
If you see boring candles frequently, check out the last high and low levels.
If the price close to the last high, take long position. If not, short position.
Use ALMA , if you want to put and alert on script. It is identical to price line.
Thanks to @millerrh for 'Breakout Trend Follower'. Just used the last low and high features to complete the script. Combined with 'Boring Candles' from ©Prasad Raut, Modified on 20190811 (Updated to %30 full candle)
Trend Tip: You can use the script with Linear Channel so you can also see the trend. (not always)
CryptoKillerCryptoKiller is a trend following trading system. It provides entry and exit points, a money management system and a trade management system.
The entry points (fuchsia line) are determined by CryptoKiller Oscillator (see other published script to understand how the oscillator works).
The trade management system provides the exit points in profit and in loss. This script works with multiple take profits (green lines), the initial position is liquidated little by little as the trend reaches the profit targets. Trade management also provides trailing stop exits to save the remaining profits.
Stop loss (red line) take into account the recent past of the chart to be determined, while take profits are fixed and have been calculated based on historical volatility.
The money management system is very simple, it plans to enter a position with a fixed percentage with respect to equity.
CryptoKiller, during an operation, also draws supports and resistances on the chart - determined by the oscillator (orange lines) these supports and resistances are used as a filter to understand where there is the greatest probability of trend development (some entry points provided by the oscillator will therefore not be considered by CryptoKiller as entry points, as in disagreement with the traced supports / resistances).
We know that an error appears in the backtest calculation, where the script is said to suffer from a bias, so the backtest calculation may not be accurate. Actually this happens in high times like H4 or daily, but CryptoKiller is not designed for these timeframes. it is a short-term strategy.
For more information read the author's instructions to contact us, we will send a PDF file with a more complete explanation of the strategy accompanied by screenshots.
Access to this script is granted along with access to CryptoKiller Oscillator.
Aggregated VolumeBITSTAMP:BTCUSD
This indicator aggregates trading volume data of assets which are traded on multiple exchanges (like cryptocurrencies, commodities, forex and derivatives) to give you better insights on the markets.
You can change the markets from which the indicator gathers data in the settings under inputs.
By default, data is aggregated from the following markets:
Binance, BTC /USDT
Binance, BTC /BUSD
Bitfinex, BTC /USD
Coinbase, BTC /USD
Bingbon, BTC /USD
Bitstamp , BTC /USD
Kraken, XBT/USD
Gemini, BTC /USD
OkeX, BTC /USDT
Huobi, BTC /USDT
InvictusHello,
I introduce my strategy that provide signals for entering in the market and signal for exit.
This indicator attempts to show a trader when is the best time to open a long or short position. The calculations are partially based on volatility, SMA, EMA and predefined values depending on used timeframe.
We collect data from comparing the current price, calculating the average move of the market, top, bottom and close of the latest bars. The middle line is an adaptive moving average, which is the base of the signals and we also use it as a Trend Line to determine if we are in long or short "condition". The basic idea of this indicator is to show the best place to open a Long or Short position and when to close it.
It is very simple - there are 2 type of signals - LONG (in green) and SHORT (in red). You can close your position when a TP (Take profit) shows up or based on your calculations.
You can chose from several options which strategy you want (there is a "Strategy" select in the settings). The strategies that are proving better according to our tests are marked with a diamond.
Don't forget to always trade with caution, trading is dangerous don't trade more than you can afford to lose.
Please contact me via personal message if you want to test the strategy or for more information.
Thank you.

Cryptocurrency Super-Cycle IndicatorThe Cryptocurrency Super-Cycle Indicator employs a custom volume-weighted algorithm to confirm the overall, long-term trend. This works well on the 4H timeframe, but can be used on any timeframe. The indicator also plots a modified Network Value to Transactions (NVT) Ratio to identify overbought and oversold areas where price could soon reverse.

mark strategy2 divergence bot v0.5 for xbtusdHi first of all thanks for read this.
This is my second strategy for make trading, I optimized it for xbtusd with 30 min charts.
You can personalize some setting for reach a better result then me, these are the setting:
this script is only for long trade, so bearish divergence don't work
1)ema1
U can change this value for use another ema and use a faster or slower trend
2)ema2
U can change this value for use another ema and use a faster or slower trend
3)pivot right
U can change this value for watch a number of bar on your right
4)pivot left
U can change this value for watch a number of bar on your left
5)high range
U can change this value for watch a max number of bar
6)low range
U can change this value for watch a min number of bar
7)bullish
U can change this value for enable signal with bullish divergence
8)hidden bullish
U can change this value for enable signal with hidden bullish divergence
9)bearish
U can change this value for enable signal with bearish divergence
10)hidden bearish
U can change this value for enable signal with hidden bearish divergence
11)profit 1 %
U can change this value for the first take profit target
12)profit 2 %
U can change this value for the second take profit target
13)qty target 1 %
U can change this value for close a % of your trade at target 1
14)loss %
U can change this value for close the trade at a % of loss
Have nice day and send me a message if u will earn with my strategy.
If u want my code send me a message
for info send me a message

Average EnvelopeA script to calculate a support / resistance level which acts as either a bounce level or a flip level. This is rather a macro play guide than a day trade tool.
The average is calculated by taking into account monthly/weekly/daily highs and average them out.
The script also paints fib levels based on the values of the upper and the lower band.
While this was designed with a cryptocurrency market in mind (no 'close' values per-se) it holds with traditional markets as well.
