MZ SRSI Strategy V1.0Strategy Introduction
This strategy starts from selection of 1st Moving Average from one of following:
SMA
EMA
DEMA
TEMA
LRC
WMA
MF
VAMA
TMA
HMA
JMA
Kijun v2
EDSMA
McGinley
Then it calculates the RSI of selected 1st Moving Average
In the end it calculates Moving Average of previously calculated RSI and for this purpose 2nd Moving Average is also selected from above list.
Cross of RSI and its Moving Average generates Strategy Alerts
Only long trades are enabled currently
Default Settings
I've set the default selection to the perfect options for 1D and 4h timeframes. You can modify both MAs selection and their length according to your selected timeframe.
Following default settings are used:
Heiken Ashi Candles are selected by default as source
1st Moving Average selection is set to LRC (Linear Regression Curve)
Length of 1st Moving Average is set to 50
RSI length is set to 2 because it is supposed to be fast
2nd Moving Average of RSI is set to TMA (Triangular Moving Average)
Length of 1st Moving Average is set to 5
Start date is set to 2011
Backtesting can also be done selecting %age of equity
Suggestions for Usage
Mostly winning trades have no prominent drawdown so losing trades can be abolished with Stoploss. Would soon add Stoploss, MTF and Takeprofit options in next version. Also if you want an alerts version of it then just comment below and would publish it later. I’ve found this strategy useful on 1D and 4h timeframes with described default settings.
Mata Wang Kripto

NSDT Fracking CryptoThis indicator is part of our Fracking series of indicators and is specifically designed for scalping Crypto. It looks for a particular price action pattern/sequence then displays levels and a label on the chart to show a potential entry, target, and stop based on that analysis. Basically enter long through the green zones and short through the red zones. The target levels are not guaranteed to be hit, but are a good guide with high potential. Pivot Point levels were added for additional confirmation of potential key levels.
Trading is risking and you can lose money. Trade at your own discretion and risk. This indicator is only providing potential scalping zones based on recent price action.

Double SupertrendThis strategy is based on a custom indicator that was created based on the Supertrend indicator. At its core, there are always 2 super trend indicators with different factors to reduce market noise (false signals).
The strategy/indicator has some parameters to improve the signals and filters.
TECHNICAL ANALYSIS
☑ Show Indicators
This option will enable/disable the Supertrend indicators on the chart.
☑ Length
The length will be used on the Supertrend Indicator to calculate its values.
☑ Dev Fast
The fast deviation or factor from one of the super trend indicators. This will be the leading indicator for entry signals, as well as for the exit signals.
☑ Dev Slow
The slow deviation or factor from one of the super trend indicators. This will be the confirmation indicator for entry and exit signals.
☑ Exit Type
It's possible to select from 4 options for the exit signals. Exit signals always take profit target.
☑ ⥹ Reversals
This option will make the strategy/indicator calculate the exit signals based on the difference between the given period's highest and lowest candle value (see Period on this list). It's displayed on the chart with the cross. As it's possible to verify in the image below, there are multiple exit spots for every entry.
☑ ⥹ ATR
Using ATR as a base indicator for exit signals will make the strategy/indicator place limit/stop orders. Candle High + ATR for longs, Candle Low - ATR for shorts. The strategy will show the ATR level for take profit and stick with it until the next signal. This way, the take profit value remains based on the candle of the entry signal.
☑ ⥹ Fast Supertrend
With this option selected, the exit signals will be based on the Fast Supertsignal value, mirrored to make a profit.
☑ ⥹ Slow Supertrend
With this option selected, the exit signals will be based on the Slow Supertsignal value, which is mirrored to take profit.
☑ Period
This will represent the number of candles used on the exit signals when Reversals is selected as Exit Type. It's also used to calculate the gradient used on the Fills and Supertrend signals.
☑ Multiplier
It's used on the take profit when the ATR option is selected on the Exit Type.
STRATEGY
☑ Use The Strategy
This will enable/disable the strategy to show the trades calculations.
☑ Show Use Long/Short Entries
Option to make the strategy show/use Long or Short signals. Available only if Use The Strategy is enabled
☑ Show Use Exit Long/Short
Option to make the strategy show/use Exit Long or Short signals (valid when Reversals option is selected on the Exit Type). Available only if Use The Strategy is enabled
☑ Show Use Add Long/Short
Option to make the strategy show/use Add Long or Short signals. With this option enabled, the strategy will place multiple trades in the same direction, almost the same concept as a pyramiding parameter. It's based on the Fast Supersignal when the candle fails to cross and reverses. Available only if Use The Strategy is enabled
☑ Trades Date Start/End
The date range that the strategy will check the market data and make the trades
HOW TO USE
It's very straightforward. A long signal will appear as a green arrow with a text Long below it. A short signal will appear as a red arrow with a text Short above it. It's ideal to wait for the candle to finish to validate the signal.
The exit signals are optional but give a good idea of the configuration used when backtesting. Each market and timeframe will have its own configuration for the best results. On average, sticking to ATR as an exit signal will have less risk than the other options.
☑ Entry Signals
Follow the arrows with Long/Short texts on them. Wait for the signal candle to close to validate the entry.
☑ Exit Signals
Use them to close your position or to trail stop your orders and maximize profits. Select the exit type suitable for each timeframe and market
☑ Add Entries
It's possible to increase the position following the add margin/contracts based on the Add signals. Not mandatory, but may work as reentries or late entries using the same signal.
☑ What about Stop Loss?
The stop-loss levels were not included as a separated signal because it's already in the chart. There are some possible ideas for the stop loss:
☑⥹ Candle High/Low (2nd recommend option)
When it's a Long signal from the entry signal candle, the stop loss can be the Low value of the same candle. Very tight stop loss in some cases, depending on the candle range
☑⥹ Local Top/Bottom
Selecting the local top/bottom as stop loss will give the strategy more room for false breakouts or reversals, keeping the trade open and minimizing noises. Increases the risk
☑⥹ Fast Supertrend (1st recommend option)
The fast supertrend can be used as stop-loss as well. making it a moving level and working close to trail stop management
☑⥹ Fixed Percentage
It's possible to use a fixed risk percentage for the trades, making the risk easier to control and project. Since the market volatility is not fixed, this may affect the accuracy of the trades
☑⥹ Based on the ATR (3rd recommend option)
When the exit type option ATR is selected, it will display the take profit level for that entry. Just mirror that value and put it as stop-loss, or multiply that amount by 1.5 to have more room for market noise.
EXAMPLE CONFIGURATIONS
Here are some configuration ideas for some markets (all of them are from crypto, especially futures markets)
BTCUSDT 15min - Default configuration
BTCUSDT 1h - Length 10 | Dev Fast 3 | Dev Slow 4 | Exit Type ATR | Period 50 | Multiplier 1
BTCUSDT 4h - Length 10 | Dev Fast 2 | Dev Slow 4 | Exit Type ATR | Period 50 | Multiplier 1
ETHUSDT 15min - Length 20 | Dev Fast 1 | Dev Slow 3 | Exit Type Fast Supertrend | Period 50 | Multiplier 1
IOTAUSDT 15min - Length 10 | Dev Fast 1 | Dev Slow 2 | Exit Type Slow Supertrend | Period 50 | Multiplier 1
OMGUSDT 15min - Length 10 | Dev Fast 1 | Dev Slow 4 | Exit Type Slow Supertrend | Period 50 | Multiplier 1
VETUSDT 15min - Length 10 | Dev Fast 3 | Dev Slow 4 | Exit Type Slow Supertrend | Period 50 | Multiplier 1
HOW TO FIND OTHER CONFIGURATIONS
Here are some steps to find suitable configurations
select a market and time frame
enable the Use This Strategy option on the strategy
open the strategy tester panel and select the performance summary
open the strategy configuration and go to properties
change the balance to the same price of the symbol (example: BTCUSDT 60.000, use 60.000 as balance)
go back to the inputs tab and keep changing the parameters until you see the net profit be positive and bigger than the absolute value of the drawdown
in case you can't find a suitable configuration, try other timeframes
Since the tester reflects what happened in the past candles, it's not guaranteed to give the same results. However, this indicator/Strategy can be used with other indicators as a leading signal or confirmation signal.

Dominion - Bitcoin Altcoin Dominance [mutantdog]A simple and easy reference tool displaying a plot of the market cap dominance values for several significant cryptocurrencies.
The most widely used of these is bitcoin dominance (the top indicator shown above) which calculates the total market cap of bitcoin in relation to the total cryptocurrency market cap, displayed as a percentage. This is commonly used by traders to assess the strength of bitcoin in relation to the broader crypto market; increasing values being indicative of larger bitcoin moves and decreasing values often indicative of potential altcoin cycles. Likewise, ethereum dominance (the bottom indicator shown above) is frequently used as a means to indicate the strength of ethereum in relation to the broader crypto market.
Included options for marketcap dominance values are:
Bitcoin : CRYPTOCAP:BTC.D
Ethereum : CRYPTOCAP:ETH.D
Total DeFi (a composite of multiple top defi tokens): CRYPTOCAP:TOTALDEFI.D
Stablecoins (shows the combined dominance values for usdt and usdc): CRYPTOCAP:USDT.D + CRYPTOCAP:USDC.D
Flippening (shows the difference between bitcoin and ethereum dominance values): CRYPTOCAP:BTC.D - CRYPTOCAP:ETH.D
When used in combination with each other, these can provide a good overview of the general flow of capital within the crypto market.
Additional functionality:
up to three optional moving averages with a choice of SMA, EMA, WMA and RMA for each.
multi timeframe selector
alert condition presets for various moving average crosses.
Please be aware that, while useful as reference, dominance calculations are known to repaint frequently. As such the use of this indicator and its alerts should require caution.

Profit Maxima: a crypto strategyThis strategy is designed for those who are looking for long-term positions with low risk and high profitability.
How does it work?
In short, the basis of this strategy is the frequent modeling of the price using regression equations and the estimation of the range of price movements.
The price modeling process starts from the first bars and will be repeated on each bar. This process is performed in each candle based on the data available up to that candle, and data for subsequent bars is not used.
There is also no fixed price model, but it will change from one candle to the next; Therefore, the more candles there are, the larger the statistical population and therefore the quality of the price model increases.
I have also used the concept of scarcity. Bitcoin is the first scarce digital object in the world. Once something becomes scarce enough, it can be used as money. This scarcity gradually increases and affects the price. The entire crypto market also follows Bitcoin.
However, always remember that past results in no way guarantee future performance.
Why this strategy generates a small number of trades?
Preston Pysh believed Bitcoin cycles happen in three phases: the Bull Run, the Correction, and the Reversion to the Mean. He estimates there are about 200,000 blocks per cycle and there are about 144 blocks per day.
Therefore, each cycle of Bitcoin lasts about four years. The entire crypto market follows bitcoin. On the other hand, cryptocurrency is a new phenomenon. They have a limited price history.
This strategy is designed to open a long position at the lowest possible price. In addition, due to the concept of scarcity and its continued impact on prices, trading in the “short” direction is avoided.
The combination of these factors leads to generate a small number of trades. However, you can test it on several different charts to make sure it works properly.
Default settings
{ default_qty_type } = strategy.percent_of_equity
{ default_qty_value } = 3.3
{ commission_value } = 0.1
{ pyramiding } = 3
{ close_entries_rule } = "ANY"
In a simple word, buy (Entry) and sell (take-profit) orders are each done at three different levels. At each level, 3.3% of equity is used (9.9% in total)
0.1% commission is considered for each transaction.
“close_entries_rule” determines the order in which orders are closed. The default is FIFO (first in, first out), but in this strategy, orders are executed in “first in, last out” order. In this way, the lowest buy (Entry) order corresponds to the lowest sell (take profit) order.
Choose the best chart
Charts have a significant impact on the performance of the strategy. As mentioned, the more historical bars there are, the larger the statistical population and therefore the quality of the price model increases.
You can use the Chart Quality panel to choose the appropriate chart:
The ‘Historical Bars’ field shows the number of candles in the chart. Choose the chart of an exchange that has the most historical bars.
The ‘Recommended Chart’ field shows the suggested chart for some symbols.
The “Predictability” field indicates to what extent price movements can be predicted using the model; the higher the “predictability”, the more credible the results of the strategy. "Predictability" indicates that the results of the strategy are reliable or not.
The image below shows the recommended chart for 20 different symbols:
How to use
You don't need automated trading platforms to use it. It can be used by placing simple buy and sell (take-profit) orders manually.
The green and red lines indicate the 'Entry' and 'Profit' levels respectively. If there is no order (buy / sell) active on one of these levels, it will be displayed in gray. The corresponding values are displayed in the Entry & Profit Limits table.
After choosing the appropriate chart, you can use this table to place your orders manually.
Note that trading in the "short" direction is not recommended at all.
Samples

WaveTecs StrategyWelcome to the Backtesting version of "WaveTecs Strategy", the indicator itself is an invite-only script called "WaveTecs Indicator" on TradingView.
WaveTecs Strategy
WaveTecs is a Strategy that combines Wave Trend Oscillator and verifies wave momentum by using RSI and Stochastic Oscillator Values.
What is Wave Trend?
One of the most effective indicators in identifying swings is the Wave Trend indicator. Wave Trend plots waves using highs and lows between an upper band and a lower band. It looks for the opening and closing of a new wave trend movement as well as overbought and oversold areas.
How does this modified strategy work?
By using RSI and Stochastic values we are able to verify Wave inflection points to determine if there is a suitable amount of momentum to ride the swing and make profitable trades. Positions are taken or closed based on the rising or falling momentum.
Each value input can be adjusted to best suit the type of market you are trading in. By using the strategy we can optimize these value inputs to yield greater net profits. I have found the RSI and Stochastic values hugely impact entries and exits regarding trades.
For Long conditions:
- RSI & Stochastic needs to be increasing and moving out of oversold conditions to show positive momentum.
- Falling momentum results in a sell signal. I have found RSI less than 65 to be sufficient in most markets however this can be adjusted at any time to yield different results depending on your comfort level.
For Short conditions:
- RSI & Stochastic needs to be decreasing and moving out of overbought conditions to show negative momentum.
Generally, Wave Trend Strategies only take trades that are outside of the bands. This strategy allows trades inside and outside of the bands, which can be selected under the input section title "Aggressive Trading". Trading in this mode is more frequent as signals are often. Due to volatility in crypto markets, I have defaulted the source for Wave Trend waves to be Open/High/Low/Close Average which yielded great results. High/Low/Close average works very well for all other securities, and can easily be adjusted through the drop-down menu inside the inputs.
Works for all types of markets. Parameters can be adjusted but not required as indicator values are standard in the industry.
The default parameters are set to those typically used in the markets currently. However, I have found that if you adjust you to adjust the parameters based on your asset and time frame desired you will yield different results.
----------------
For example:
----------------
ETHUSDT - 4 HR, results are shown below
Wave Trend Parameters:
Aggressive Trading: Yes
Channel Length: 12
Average Length: 24
Overbought Top: 90
Overbought Bottom: 75
Oversold Bottom: -90
Oversold Top: -55
Source: hlc3
Strategy Type:
Trade Direction: Long Only
Stochastic Inputs:
Stoch Length: 18
Smoother %K: 5
Moving Average %K: 4
%K Lower Limit: 21
%K Upper Limit: 80
%K Crossunder Sell: 80
Relative Strength Index Inputs:
RSI Lower Limit: 30
RSI Upper Limit: 70
RSI Sell Value: 68
==================
WaveTecs Features
==================
Profitable Trading Strategy;
Aggressive Trading feature for more trades, with earlier entries and exits;
Customizable inputs to fine-tune your trades;
Buy & Sell Alerts (Indicator Only);
Overlay indicator only to show alerts, WaveTecs Strategy needed to see Wave Trend;
Bot Integration through webhooks;
Two different strategy modes: Long Trades Only or Long & Short Trades
Adding new features & updates whenever possible.
Add both WaveTecs Indicator and WaveTecs Strategy to your chart. WaveTecs Indicator only plots Buy & Sell Alerts, whereas WaveTecs Strategy lets you see what the strategy is doing.

[BTCUSD] Folow Trend & Autotrade Binance FutureCommission = 4 USD per order >>> check in the Performance Summary
Slippage = 2 ticks
- I see from Kodify (tradingview.com/pine-wizards)
Risk: 1% per trade >>> check at the "List of trades"
* Auto trade BINANCE FUTURE by Webhook + Pro, Pro+, Premium Tradingview user.
1. H3 timeframe: Supertrend indicator.
- Long when the closes candle is above Green line.
- Short when the closes candle is below Red line.
2. H1 timeframe: Keltner channels indicator.
* Keltner channels setting:
+ Length = 50
+ Multiplier = 1
+ Use Exponential MA: true
+ Band style: Average true range.
- Long when the close candle crossover the Keltner Upper
- Short when the close candle crossunder the Keltner Lower
3. Entry rule:
Open Buy: Supertrend & Keltner channels are Long. Buy when closes candle crossunder Basis line and closed above Lower Keltner
Open Sell: Supertrend & Keltner channels are Short. Sell when closes candle crossover Basis line and closed below Upper Keltner
4. Stoploss is moving the trend.
Stoploss = Height of Keltner * 1.2.
5. Not repainting
6. Overview result backtesting:
a. Longterm: Every 2 years
2018 to 31/12/2020
2017 to 31/12/2019
2016 to 31/12/2018
2015 to 31/12/2017
2014 to 31/12/2016
2013 to 31/12/2015
2012 to 31/12/2014
b. Midterm: every year.
2020-2021
2019-2020
2018-2019
2017-2018
2016-2017
2015-2016
2014-2015
2013-2014
2012-2013
c. Shorterm:
2020 to today 13/11/2021

Reversal zone finderThis script would find potential reversal price zones according to RSI over bought or sell condition and big reversal candle.
It works better in range markets and lower time frames like 5M and especially in Support/Resistance zones.
Suit for scalping in forex or crypto markets.
* Use it as a trade assistant not a trade signal!

The Oracle v3 [Redbeard]Welcome,
as the name already says, this indicator will help you to find very early long and short signals for cryptocurrencies and stocks (Didnt test Forex yet).
In the comment section below, i will post some chart examples, in which you will see, how successful the indicator works, when you follow some rules.
1. What does the indicator contain:
This one indicator contains 5 different indicators, which 4 of them are being used as "confirmation signals".
Main Line: The green/red line is a modified RSI , so trendlines are easier to draw.
Stochastic: A regular stochastic indicator.
Multi Divergences: The red/orange and green/olive colored tags with numbers in it, display divergences.
MFI: The vertical blue/purple lines, are being displayed using a MFI calculation. They simply display potential tops/bottoms.
Long/Short Tags: The yellow and blue colored tags with the text "Long/Short" in it, are being displayed by another "secret" indicator.
White vertical line: This is only a offset, so everyone who uses this indicator, knows in which area he should look for trendlines .
2. How to use the indicator:
Its very simple: Trendlines
The only thing you have to do by yourself, is to look for trendline on the "green/red" Main line and to draw them.
If the Main Line closes above a resistance trendline or closes below a support trendline AND has 1-2 additional confirmation signals, then you might have a good early entry.
The most important thing are the stop losses, because like any other indicator, it wont work to 100%. But this i will explain in the discord
3. On which timeframes does it work?
It works on any timeframe.
4. Who should use it?
People who are willing to learn, how to use the indicator.
People with some basic expirience (what is a divergence, what is a trendline)
5. Do i need more indicators?
In best case yes.
Im using 2 additional indicators, which you can use too.
6. Is there any backtest or are there any "proofs" of how good the indicators worked in the past?
Yes.
I will share some examples from the past in the comment section.

SSR - Stablecoin Supply Ratio - Bitcoin - CryptocurrencyThe Stablecoin Supply Ratio (SSR) is the ratio between Bitcoin supply and the supply of stablecoins, denominated in BTC.
When the SSR is low, the current stablecoin supply has more "buying power" to purchase BTC. It serves as a proxy for the supply/demand mechanics between BTC and USD.

BTC Dominance TrendThis simple script applies the DMI/ADX (trend) indicator to the Bitcoin Dominance Index (BTC.D) to check whether BTC is increasing its dominance or not on that day. It is meant to be applied to altcoins on medium intervals. I put it together to test the following hypothesis: On days when BTC dominance is on the rise, altcoins are harder to take off, because Bitcoin is draining the lifeblood out of them, so caution is needed when opening trades.
Olive background means BTC dominance is rising on that day, purple that it is decreasing. White background means it is not moving significantly in any direction.
You can change the resolution (i.e. apply the DMI/ADX to a different BTC.D interval), just make sure to lower the threshold as well. I hope you find a good use for it! Beware if you try to incorporate it in your strategy, it uses higher timeframe data and hence is prone to repainting.

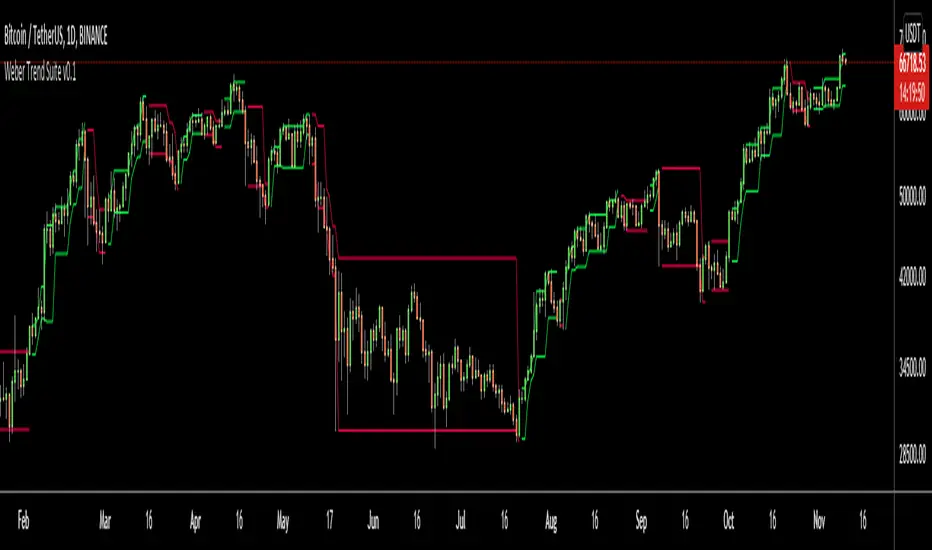
Weber Trend SuiteThe Weber Trend Suite (WTS) supports trend trading over longer timeframes.
Identification of the trend direction
Automatic identification of support and resistance level
Multi-Timeframe
Designed as a decision making framework for trading trending growth assets such as tech stocks and cryptocurrencies
The support and resistance lines are derived from the high, low and direction (bearish/bullish) from the latest outside bar at a time. The timeframe on which outside bars are detected can be chosen freely by the user. The importance of an outside bars tends to increase with the timeframe. Outside bars can play an important role in price action trading by providing support and resistance levels as well as the currently predominant trend direction. So this indicator enables a trader to automatically display the high, low and direction of the current outside bar from two different (usually higher) timeframes and therefore gives rationally and automatically derived support and resistance levels as well as the predominant trend direction from the chosen timeframes. The adjustable crossing EMA with its volatility noise filter gives further guidance on the current trend direction and strength.
The WTS can help traders and investors following a rule based system by providing a measure of trend strength and consistency as well as specific support and resistance levels.
WhaleCrew Long/Short Ratio (Bitfinex)Shows the long/short ratio (amount of longs per short) on ANY Bitfinex pair (BTCUSD, ETHUSD, ADAUSD, ...).

supertrend strategyHI,
today I have finished to study another strategy, this time I have done a supertrend with a positive backtest untill 2015 in ETH / BTC pair.
It is very simple to understand and there are only 4 parameters:
The first 2 parameters are about supertrend u can change it as u want.
The last 2 parameters are about trailing stop and target profit, personally I use target 9.6% and trail 8%.
That's all, this is a very simple and profittable strategy.
My personal setting are 4,7,8,9.6
For info write me in private
Please press like, comment or follow :)

Cava Signals Backtesting/VisualizerPLEASE READ THE DESCRIPTION CAREFULLY
Trying this again, as it seems I keep violating the rules unintentionally. Moderator, please forgive me as I try to make this right.
This backtesting/visualizer script was created for me to get a visual idea of the Cava Signals indicator throughout its development time and continuous optimization.
This script is to be used on the 30-minute timeframe on supported markets, and whether I can only publish strategies on regular candles, the indicator is meant to trigger on heikin ashi candles.I understand backtesting on non-regular candles produces unrealistic results, but I emphasize that this script is more for visualization purposes rather than accurate $ amounts from the trades. The signals are used along with a dedicated bot configuration, so part of the strategy is not managed by the script, but by the bot's config.
Some behind the scenes on what we are looking at:
a combination of ema and sma crosses on different time frames (5m, 15m, 30m, 60m and 90m) - we call this the wave trend
a combination of stochastic rsi on different time frames (10m, 30m)
a combination of schaff trend cycles on different time frames (5m, 20m and 30m)
a combination of money flow index on different time frames (10m and 30m)
volume information for each supported market/pair
and a couple of other info particular to each pair
With the above combination of data points, we try to optimize our strategy for an entry, for dca'ing down in case the coin goes down as well as dca'ing up to maximize profit when a coin is going up, take profit levels when we recognize a good time to do so, and of course, a closing level. I would like to emphasize the *visualization* purpose of this script in recognizing lows, highs, and market structure to identify the important levels to signal - this script is NOT to be used for accurate backtesting, but for an idea of the overall performance of when signals are triggered.
Let me try to explain the workflow and icons you see on the chart:
The colored circles on the bottom of the chart are all buy signals; each color corresponds to a particular buy signal, we have a combination of 9 possible situations that would trigger a buy signal. Some would trigger a buy signal only in combination with other buy signals or other indicators within the script. we also display a green upwards arrow below bars when a buy signal is triggered.
The colored arrows pointing down on the top of the chart are close signals. We have a combination of 5 closing criteria each color corresponds to one, just like the buy signals do. We only close a trade in profit. If not in profit, we will look to DCA down.
DCA signals are shown by the green flag above bars. they are signals to DCA up or down depending on the trade being negative or positive. DCA'ing up or down is also managed by the bot's configuration for limits on when to accept the signal.
Take Profit levels are shown by the green diamond above bars and work in conjunction with the bot's config on when to take the signal if at all and other take profit levels. Usually, when we hit the first take profit level we move our stop loss to entry via the bot's take profit safety feature. You can see this call with the close entry named TPS .
The black bars you may see on the chart is to illustrate when the market is extended based on a particular strategy. During this period we will not trigger a buy signal unless there is a huge spike in positive volume .
The green number below the bars is the total positive delta volume on the buy candles.
On the table on the right upper corner, we show some information on the market and performance of the backtesting - for visualization purposes only!
Currently, the script is tailored to work with the following markets/pairs:
Binance Spot: ADA, ALGO, ATOM, AVAX, BNB, BTC , DOT, ETH, LINK, LUNA, MATIC, SOL, VET, XRP, XTZ
Binance Futures: BTC , ETH, ADA, ALGO, ATOM, BNB, COMP, DOT, ENJ , LINK, OCEAN, OMG, SOL, VET, XMR, XRP, XTZ, AVAX, AAVE, DOGE, LTC, LUNA, MKR , NEAR, ONT, RUNE, SUSHI, LTC, XLM , COMP, ONT, THETA, FTM , EGLD , WAVES, ONE, HTN , CHZ , HOT, MANA, CRV , RVN, BAT, ANKR, 1INCH, ALICE, ATA , AXS , CHR , COTI, NKN , RAY, REN, SRM , SXP , TLM
ByBit Inverse Perpetual: BTCUSD , ETHUSD
ByBit Futures: AAVE, ADA, ALGO, AVAX, AXS , BNB, BTC , DOT, ETH, LINK, LTC, MATIC, SOL, SUSHI, UNI , XEM, XRP, XTZ
The chosen pairs are subject to change based on the best-performing assets we are constantly analyzing.
I hope this helps to understand the script, its purpose and ideas. I hope this satisfies the community rules - it was not my intention to break them - if there's anything on the above or the script that still violates the guidelines, please let me know and accept my apologies in advance.
If anyone would like to know more, let me know in the comment section.
Thank you!

[Crypto] DinhChienFX [2 orders]1. Supertrend indicator at Daily timeframe:
- Long trend: the close of candle is above the Green line of Supertrend Indicator.
- Short trend: the close of candle is below the Red line of Supertrend Indicator.
2. Keltner Channels:
- Only buy is above Upper Keltner.
- Only sell is below Lower Keltner.
3. ADX indicator:
- BUY when the ADX indicator crosses 46 + Supertrend is GREEN + Candle's close above Upper Keltner.
- SELL when the ADX indicator crosses 46 + Supertrend is RED + Candle's close below Upper Keltner.
4. Order 2: just active when the Order 1 is opening.
- At the fibonacci retracement 63% ~ Risk/reward 1/1.7
5. Not repaint:
6. Stoploss and Take Profit: risk/reward 1/1.05
- Stoploss = The height of Keltner Channels from lower to upper.
- Take profit = The height of Keltner Channels from lower to upper x 1.05
7. Alert for webhook:
* Historical data with 1 Entry.
- 2013 - 2016:
- 2016 - 2019:
- 2019 to 20/10/2021
---------
Every year:
2013-2014:
2014-2015:
2015-2016:
2016-2017:
2017-2018:
2018-2019:
2019-2020:
2020-2021:
2021-20/10/2021:

Rolling VWAP - Vhunt Scalper botBINANCE:ADAUSDTPERP
Modified VWAP to use scalping in lower timeframe.
Use 1minute TF for best results but can also use up to 30min.
This indicator is made for crypto but may also work for other assets.
The bands serve as support and resistance and used for opening quick profit position if conditions below are met:
Indicators:
Blue - modified rolling vwap
Orange - Band1
Green - Band2
Opening position Conditions:
Long:
Band2 < Band1
Price < Band2
Short:
Band2 > Band1
Price > Band2

AI Crypto Signals BTCUSD 15m Ultimate ScriptBYBIT:BTCUSD
Hello everyone! Sky First Capital in partnership with AI Crypto Signals is proud to introduce the AI Crypto Signals 15M BTCUSD Ultimate Script . This script works well on the 15M, 30M, 45M and 1HR chart using traditional candles. This means no false data or inaccurate entry/exit points such as with the ones using HA candles.
The script is based upon an initial strategy developed by user Bunghole here on TradingView, but we have optimized it, back-tested it with ideal settings, and added alerts that you can use to connect with your trading bot such as Alertatron, Cornix, etc. This script uses BB (Bollinger Bands) and RSI (Relative Strength Index) as indicators for signals.
Back-testing data for the 15M chart from 7/1/2021 to 10/15/2021 showed a 51.19% profit.
Back-testing data for the 1HR chart from 7/1/2021 to 10/15/2021 showed a 191% profit.
This script does not repaint.
Ideal use is to enter and exit at the close of the candle and take-profit/stop-loss once per candle.
This script has Entry/Exit/Take-Profit/Stop-Loss alerts.
We offer consulting and training services if you need help on using this script or getting it configured with an automated trading system.
We offer a 24 hour free trial of the script, send us a message to request access.

Six Factors Ichimoku 1.0This strategy has the purpose to help dummies to get experienced when trade with Crypocurrencies, using the Ichimoku indicator
The following script shows an strategy based on Ichimoku indicator. Taking into account the theoretical concepts of the Ichimoku Kinko Hyo, are defined six (6) factors to open position and two (2) factors to close it. According to the author of the book, in which is based the script, it is stablished that the proper combination of the six factors when the timeframe is set in 1D and the assest Cryptocurrencies (not applicable to stable Coins), has demonstrated in the Backtesting good results.
Althoug is not the purpose, the Ichimoku indicator is composed by six components (Tenkan Line, Kijun Line, Senkou Span A, Senkou Span B and Kumo Cloud) and the relative position of the current price of the assest compared with ichimoku components define these factor.
Factors to open position
Factor one. The current price is over the Ichimoku Cloud
Factor two. When Senkou Span A is greater thant Senkou Span B, proyected 22 periods forward.
Factor three. Senkou Span A, has a positive slope, during the previous periods.
Factor four.The Tenkan Line (quick line) is above the Kijun Line (slow line) during the previous periods.
Factor five. The Chikou Span Line is above the Kumo
Factor six. The slope of the sma (200) is positive.
The long entry is recomended when the following expresion is matched
F1 and F2 and F4 and F5 and (F3 or F6)
Factors to close position
Factor one. Tenkan line has a downward trajectory for previous periods. If the price change during this periods the counter reset and start again trying to prevent exit from quick variations.
Factor two. Current price is below Kijun line
The time to close position is recommended when the following expresión occurs
F1 and F2
Some of the features of the script are the following:
Initial amount of investment stablished on 100€, but can be modified by the user.
User can easily modified the period for backtesting purposes.
"Show factors" give the user and easy interface to know the current status of the strategy`s factors. The factors appears color red (false) and color green (true)
It is possible to cancel Factor F5, which is interesting after the assests has dumped strongly. The color black means that F5 is canceled.
Change the output criteria by F1 or F2 (not recommended) but available for learning purposes.
Auxiliary lines that help to idenfify strong resistances that could compromise the strategy
Enjoy it !!!
Miguel A. Calatayud

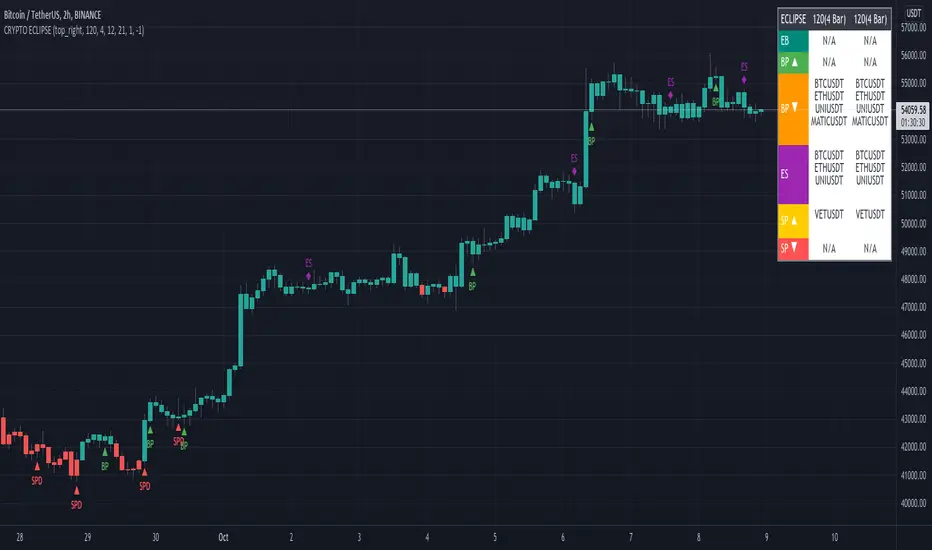
CRYPTO ECLIPSEWelcome to CRYPTO ECLIPSE!
If you see the market as a game between buyers and sellers, CRYPTO ECLIPSE is the EASY MODE.
Don't believe in any word I wrote, but please don't doubt about it until you TEST IT. Just go ahead and take your own conclusions, maybe this script changes your life, like it changed mine.
What would be like if you could see the markets through the eyes of a trader with many years of experience? (and If you are already this trader, you could add this as a live second opnion)
Imagine if you could consistently predcit buyers and sellers actions, attempts and rejections. That's what Price action technical analysis tries, but price action often feels like very subjective and to succeed and learn it, you will probably need at least 4 years of trading, winning and loosing to find consistancy, that's the process. CRYPTO ECLIPSE will show how you will see the market after this years spent, You''ll be skipping this years.
CRYPTO ECLIPSE is a setup that translates the market to you and give you the view of the market as it is, and not only how it was in the past. Differently from almost all other indicators i've seen in my life, CRYPTO ECLIPSE is a setup focused in PREDICT, not REACT. In my opnion that's why indicators not work well, they are too focused in the past, giving late decisions.
Truth be told, it's sounds good, but how do I use it?
I will explain you the main features, what you need to do is: Take some time to learn it, mess with the configs. Until you see the chart as you believe is the best predict scenario for the past, and then just sit and see how it will keep predicting the next moviments. Well, it works for me :)
Why am I renting this setup?
I am not. This is made for you to test for free, and for those who this setup makes all sense, we will build a small comunity around it. Just watch as we go, or Join us.
Before I forget, the setup is also a screener to track the 6 conditions above in the last 1-5 periods.
Main Features description:
BAR COLOR 2 = Strong Buyers domain(Candle's color)
BAR COLOR 3 = Strong Sellers domain(Candle's color)
BAR COLOR 0 e 1 = Fine Tuning(Advanced) There are 3 main ways to use it:
-Standard, following the same 2 and 3 bar colors.
-Changing both 0 and 1 bar colors. You can use Orange or pink or white colors for both 0 and 1, or other any color, try to use one that does not match with green or red for distinction. Consider the 0 and 1 bars as trend changing in course, or the breath of the market before a trend continuation (pullback).
Another option, that's indicated for Professionals only: change bar zero to dark green and 1 to a lighter red. This way you will see the gain and loose game in real time, take some time and you will see dark red going to lighter red will indicate a seller's weakness and the oposite for the buyers. If you are already a PRO, go ahead and play with these 2 options.
BP= STRONG BUYERS DOMAN
BPD= STRONG BUYERS DOMAN DECREASING
SP= STRONG SELLERS DOMAN
SPD= STRONG SELLERS DOMAN DECREASING
EB= POSSIBLE EARLY BUYERS DOMAIN SIGNAL
ES= POSSIBLE EARLY SELLERS DOMAIN SIGNAL
Note that BPD AND SPD are the same as EB and ES, I made this as a double entries so we can combine two different periods. If you look close you'll learn that the periods are related to the range of past periods you want to consider.
IF you pick a low period, it will show more signals, and it willl be more sensitive to the market changes. All the signals are real things that happened there, you will see that there was always a pullback or a consolidation, since this is very sensitive it's better to traders who want what's happening all the time
If you pick a high period, it will show less signals and with significant and strong movement, there are no guesses in this signals, if it did not proceed with a strong moviment, the opposite forces rejected their attempt.
Fit to your market point of view: Mess with the period numbers until you see the signals(arrows) where you understand is the best place to take a trade in the past, and watch it repeat the alert for you in the future, same as bar colors.
Note: If you want to enter only with big movements signals, use Stronger signals and high periods. if you want to try to get the movement begin, go with the early signals, using short periods.
Play with the configs until the chart give you the confidence you want to have to trade your money.
I don't recomend to use it with many indicators, if you add more than one indicator with this, you are probably insecure, and this will be useless to you.
But go ahead and add a trend indicator, if you are a trend trader or a oscillator, if you are a oscillator guy... Whatever you need until you feel confident.
Alway remember, this is only a tool. it's your decision, this is not a buy/sell indicator (maybe in the future), this is a tool to read the market. Always trade SPOT never FUTURES, always keep your stop loss as close as you can.
Enjoy the ECLIPSE
Crypto Scannner for Traffic Lights StrategyI allways try to make trading easier. Developing Scripts for a quick backtest and improvement of a strategy, getting alerts for entry and exit a position. Loading data to a spreadsheet is also important and takes time.
In this case finding good parameters in different markets or assets to enter in a position, is a bit exhausting. It is something you have to do everyday, and sometimes in different moments of the day.
So I manage to develop a Screener, to take a quick look at specific hours, and tell if I have a buy or sell condition in an specific asset. Obviously this is not an alert to make a trade instantaneusly, but this help you filter a lot of information in matters of seconds. Then open those specific charts and make a better analisys.
A few weeks ago, I published a scrpipt called "Traffic Lights Strategy", that uses 4 emas to get a buy or a sell condition.
It is easy to understand and use, but if you don´t want to missed some opportunities, and don't want to be look at the screen in all the time looking for them, I have here a simple solution.
This script works plotting 2 labels. The first one plots all the assets in which the condition is true (fastema > medema > slowema > filterema or fastema < medema < slowema < filterema)
The second one plots the assets were the condition is true only if happened up to 5 candles back, so you can be in time to enter a trade.
You can take the script and customize it for a different strategy or assets. I coded like this because I backtested this strategy in this specific assets, and statistics suggest that it might be profitable.
I hope this works for you. In other time I'll try to code a script for the others strategies I published.

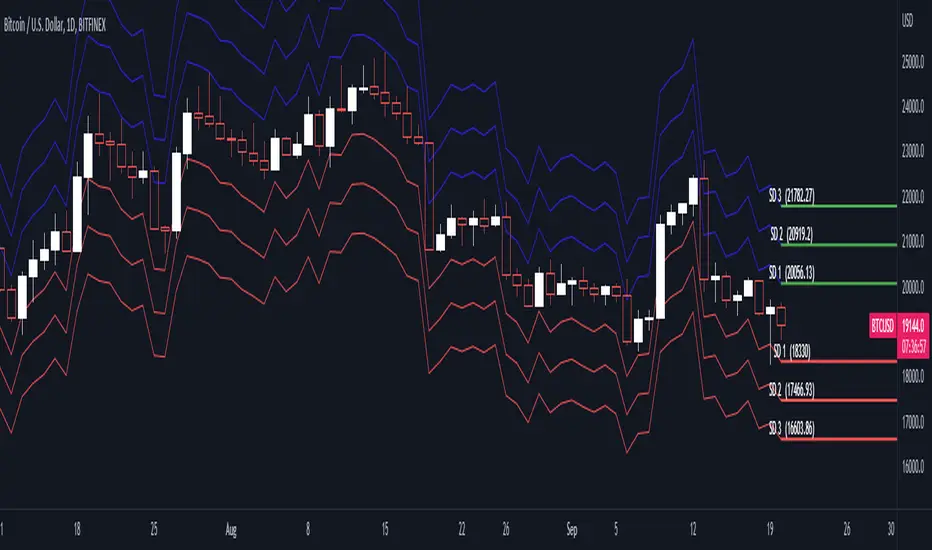
Standard Deviation ModelsBITFINEX:BTCUSD
The standard deviation model can be used for options traders that are selling options contracts to collect a premium to identify a specific range of strike prices which are optimal for selling based on the underlying asset’s historical price fluctuations. Traders will be able to identify the statistical likelihood that their options contract will be in the money (ITM) or out of the money (OTM).
Basic statistics of normal distributions (probability curve):
-1 SD to +1 SD = 68% likelihood
-2 SD to + 2 SD = 95% likelihood
-3 SD to +3 SD = 99% likelihood
Bagheri IG Ether v2In this version, the winning ratio has been decreased, but the Risk to Reward Ratio (RRR) has been set to be better than the previous version.
This is a technical trading strategy for Ethereum ( BINANCE:ETHUSDT ). We built and developed it on MetaEditor and optimized it with MetaTrader optimizer.
The main indicators are Donchian Channel, Oscillator of ROC , Bears Power, Balance of Power , and Simple Moving Average ( SMA ). Default values in the input panel are the best combination of these indicators, but you can change any of them and try it for better results.
Please notice that this strategy has been optimized on the 1-minute chart of Ethereum .
For each position, you can see the Take Profit (TP) and Stop Loss (SL) levels. Also, you can find the values of mentioned TP and SL in points from the input panel of the script.
Attention: The price of Ethereum has 2 decimal places.
Therefore, 3000 points for TP means 30 USDT for trading 1 BINANCE:ETHUSDT .
