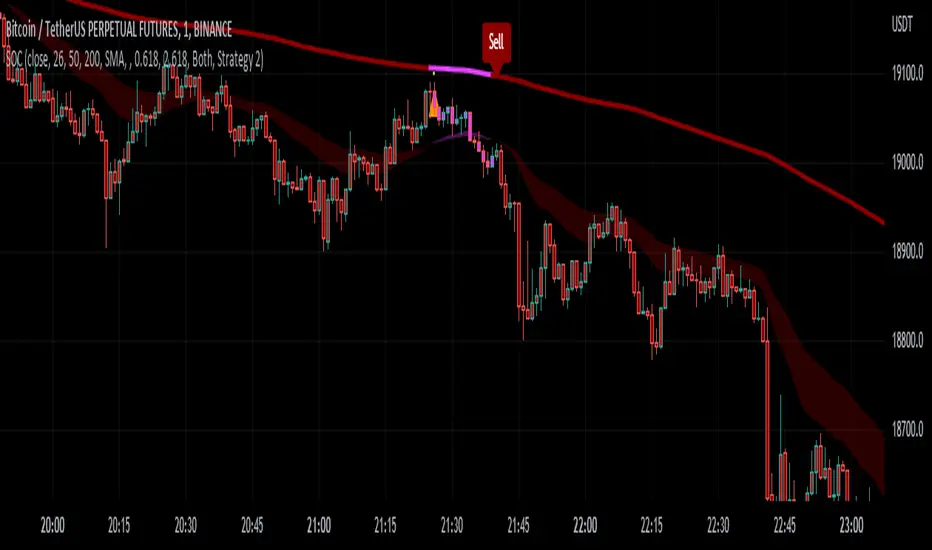
Bot MasterSqueeze 1.1 (crypt)Countertrend strategy for correction to the average value. The strategy is designed primarily for crypto.
The principle of operation is that with a rapid price change, the strategy tends to take a reverse position to return to the average value, which statistically often happens. It is enough for you to determine the percentage of the offset about the average price and the size of the averaging position as a percentage of the deposit.
With the settings, you determine how to determine the average opening price. It can be MA at the price of opening, closing, etc., and DCMA. Soon I will add a few more options for determining the average opening price
You can also choose the average price at which the transaction will try to close.
Now there are 3 methods:
- closing when returning to the average price
- closing on the first correction candle
- opening on an abnormally large candle in the direction of correction and closing on the first one is opposite
Search for the settings by the selection method for each pair separately. It is better to trade using signals via a bot.
The strategy shows itself best on volatile coins paired with the dollar for 1 hour or more.
Soon I will add new options for opening and closing deals, as well as determining the average price.
ATTENTION: the strategy involves averaging, so be careful with levers and overestimating the percentage of the transaction from the deposit. It is best to allocate no more than 25 percent to the risk of the transaction.
Mata Wang Kripto

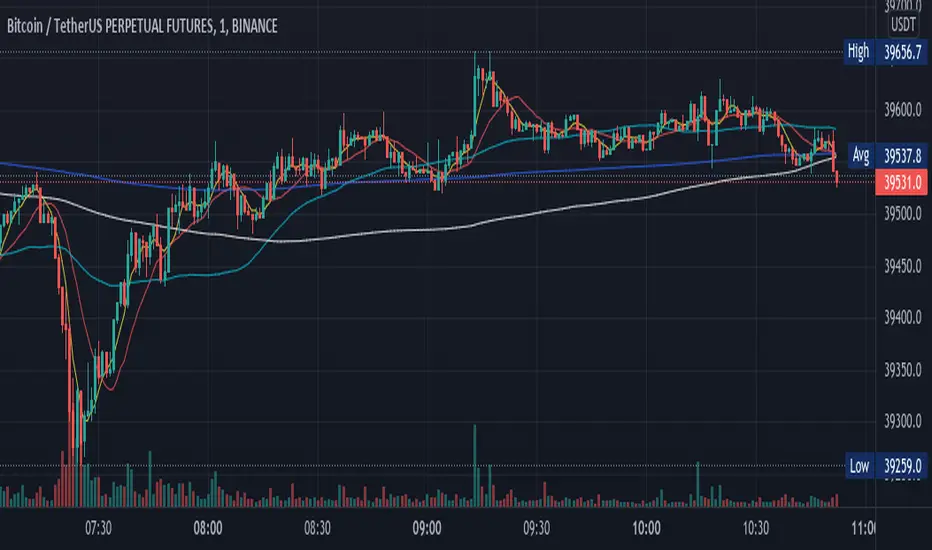
TBT Base to Quote Currency ConverterKnowing how much volume is traded on a chart is essential, but only knowing the Base volume can be confusing- especially when it's for a token only worth 0.00000210 sats. Put away your calculators and use this indicator instead to instantly convert the Base traded volume to Quote.
For example, on the chart above for BTCUSDT:BINANCE, if you add the Volume indicator, it is showing volume traded in the Base currency, which is Bitcoin. But it's more important to know how much QUOTE currency has been traded, which would be USDT in this case.
This is particularly useful when trading low-volume charts for AB Trading, something we teach in several of our courses.
Lastly, we have included a 30-period SMA to show average trading volume over the last 30 periods. Keep in mind that this will be more helpful when used on the daily time frame to get a general idea of the average trading volume over time for a trading pair.

MZ HTF HFT ROCit Bot - Non Repainting Scalper v1.2 ADX RSI MOM This is a new iteration based on my Momentum trading bot.
This is an original script meant to be a high frequency trader that works on higher time frame calculations.
I came up with the idea that using calculus I can figure out the actual rate of change and momentum with different calculations than the momentum indicator that is provided by trading view. Once momentum is shifted on a small time frame, it will provide an entry signal. The script is meant to be used on an algorithmic trading system for scalping purposes. It should be run on a one minute time frame. Unfortunately due to various plotting constraints in Pinescript, you cannot plot the rate of change and momentum and price in the same pane. To counter this, I have a showdata toggle to give you values of the indicators at each entry.
This version has two main entry settings toggled with a checkbox. There is the ROC (rate of change) version and the MOM (momentum) entry signals.
The rate of change version is meant to take a look at your moving average and try to trigger when it hits a certain rate of change point. This can be helpful if you rather play it safer. I have noticed that you can get slightly better entry points but also does not give you as many entries. The momentum algorithm will give you faster entry points and might work best with a slight offset (use your back test to help you figure it out).
I have started to add tooltips to help you along. If you have suggestions please let me know.
How does it work?
Let's just assume that you are looking at a one minute chart. I recommend using the one minute for bots because it will give you the fastest execution for entries. Pinescript has an issue where the signal is not usually sent until the end of the bar/beginning of next bar. If the signal was triggered at the beginning of a 15 minute bar, it might not actually send the signal until the following 15 minute bar. If you are trading on small time frames, this can make all the difference. If you are using an algo platform that trailing stops, stop losse, take profits, etc. I would recommend you use that platform to close your trade. The close trade message will work, but pinescript does not know the exact entry price you received, so if you are trying to collect small profits, it is best that intermediary platform does that calculation for you. If you are dealing with larger moves, instead of small 1-3% scalps, you are probably fine to use the close message setting from pinescript.
Ok, so to take an example. I like to use the 3L and 3S tokens on Kucoin. This gives you a lot of volatility to work with compared to other tokens and coins. However, it can also meas that you are likely taking a higher risk. However, there are some things that can help with that (more on that later).
So we have a token we want to run, and have it on the 1m chart.
First, be sure that all of your filters are OFF when you start playing with the back test. This allows you to see how to best optimize the bot.
Use the show data to show you additional data when you are backtesting. This can allow you to try to filter out results or market conditions that do not work. I typically work with the RSI and use the 30 minute and 15 minute RSIs. I make sure that it is trading within a certain band - about 40-75. You can try the inverse and only buy during really low RSI's as well.
www.dropbox.com
Find the source of your data with the variant drop down. You can use any time frame, open, close. high, low, olc4. Open is pretty much guaranteed to not have any repainting issues - although all the other calcs use a custom isbarconfirmed security repaint calculation. I have been finding that Open and SMA work well, but feel free to explore. If you use a source like open, close, high, low, etc - the interval will not change anything further. If you use a variant such as an sma, you should try to find an interval that works well for that token. For instance, try an sma of 8-11 minutes and see which gives you the best backtest result without changing anything else. Offset ALMA/LSMA parameters are only used for those specific variants. These specific parameters will also affect the ALMA and LSMA if you use that variant in the trend filter. In other words, you can skip these if you are not using those types of moving averages.
www.dropbox.com
Configure the ROC and MOM intervals. If you are using a source such as open, close, etc- this is where you set the interval for your change. So consider using OHLC4 or a interval of 5 thru 15 and see what works best. The Momentum inverval usually works best in the 2-5 bars. There is a custom calculation I added in to try to filter out false entries as momentum is waning. This calculation works best in 2-5 bar interval.
Configure the trigger point and offset. If you are using rate of change, the best settings will likely be between -1 to 0.5. If you are using momentum, you will likely want -20 to 10. This is where you will notice the entries will shift a bit. Try to find a balance between your backtest settings and actually finding what you thin will be the best entries based on a slight delay from trading view, to algo, to your trading platform. This can likely be a minute (maybe even) or so- so be sure to not get too caught up between the backtest results and be sure to finesse the entries to actually fit nicely - maybe a bar earlier than you would likely think. If your entries are coming in too early, you can use the offset to delay your entry by a few bars. This is both science and an art form- don't get too caught up on the back test results as that is based on having all the data tha already transpired, it's not based on how it will actually perform during deployment.
Take profit and stop loss. This should be self explanatory. This script can toggle between static take profit and a trailing profit. For scalping, you will likely want to limit it below 2% to get a good win ratio. Stop loss should be at least 5-6% for these types of 3L/3S tokens to give the strategy some room to move (if the token goes down 2% before it shoots back up, the price will go down 6%). This does not yield the best R/R ratio from a traditional trader perspective, but the statistical probabilities are in your favor for these events will happen. If you have better ideas for how to set this all up, feel free to contribute your ideas in the comments as we can all learn from each other. You can definitely set a much tighter stop loss with a larger take profit to get a lower win rate but in turn might get much better returns. It's all up to you.
FILTERS www.dropbox.com
These filters require you to know a bit about each indicator and how you want to use them. I will only go over the general idea.
Variant Filter - this is especially useful if you want to trade above a moving average. Say for instance you only want to take trades when we are over the 100 Day moving average. Or above a 30 minute, 30 bar EMA, etc. Although originally ported over from my other scripts, this is not a filter that I use often in conjunction with this script.
RSI - perhaps you want to buy when we are below the 30 line on the 30 minute RSI, or we want only want to have the strategy work when we are above the 50 RSI, this can all be configured here. I typically like to try a few different rationales here.
Now with brand NEW ADX filter - this is a brand new idea that seems to work rather well. Based on your ADX settings you can also turn on the "only uptrend" which will try to calculate if you are in an uptrend based on your ADX config. Please keep in mind that uptrend is based relatively on the ADX settings.
- There is a sprinkle of RSI magic in the entry signal to make sure that rsi is not declining in the calculation, so this can affect how many entries you get.
Some other tips:
Forward test.
Set up your algo bot on a one minute interval.
Set up take profit and stop loss on your algo trading platform.
Don't use the exact settings as your backtest, maybe try a slightly more conservative approach from the algo trading platform to make sure you are within range of triggering your events with a slight delay from signal to execution. If you have a 1.6% take profit, perhaps try 1.5% on your platform first.
By using these scripts you agree that you are trading at your own risk. I make no guarantees of returns or results. I just provide tools to help you trade better. However, I hope this ROCit will take you to the moon. And if it does, be sure to give me a shout as well as some tips of your own.
Send me a message with any questions or suggestions.

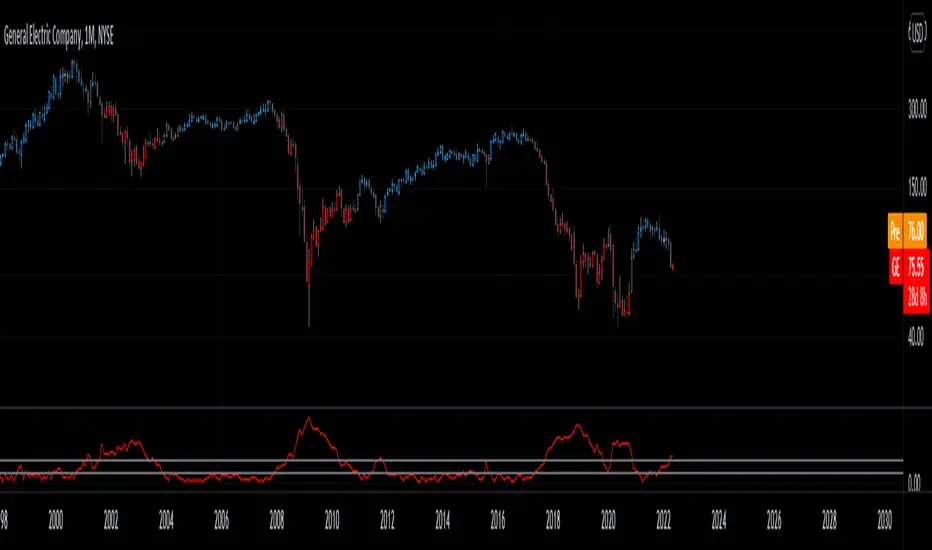
Bitcoin Indicator CBitcoin Indicator C is the missing part of the whole picture. It must be used together with Bitcoin Indicator B for the best results possible!
Indicator B is to find the entry on the market sharp, while the new Indicator C will help you to find the zone where it's time to look for the entry. The dots do NOT represent the start nor the end of the trend, they only show the cross of the waves. Indicator C was created to see the bigger picture of the market. You will see 3 waves on the indicator. The white wave is the main indication of the trend, however all of them should be considered together. Think about it as a painting so just step back and watch the whole picture. If you see the waves topping and start to form a downtrend it's time to find your entry on Indicator B. Also when you see waves bottoming it's time to look for the entry of the Long trade.
When all of 3 waves moving together parallel from the top to the bottom that's a strong downtrend. Opposite occurs when there is a strong uptrend on the market.
These waves were created to show unique repeating patterns, too. For example: White wave bottoming while others keep painting on the upside of the zero line. Other example if repeating waves getting lower and lower... Learn more about unique patterns on our website!

Sherry on cryptoIf the price is above the 200 EMA, you are allowed to open only long positions and avoid shorts.
If the price is below the 200 EMA, you are allowed to open only short position and avoid longs. Don't use this indicator alone, use RSI, Stochastic RSI etc. Do not use this indicator like a bot, do TA and FA as well. This is just an indicator, do not always rely on it. It requires experience. This indicator has different winrate in different timeframes. Set its value accordingly.
Rate Of Change Trend Strategy (ROC)This is very simple trend following or momentum strategy. If the price change over the past number of bars is positive, we buy. If the price change over the past number of bars is negative, we sell. This is surprisingly robust, simple, and effective especially on trendy markets such as cryptos.
Works for many markets such as:
INDEX:BTCUSD
INDEX:ETHUSD
SP:SPX
NASDAQ:NDX
NASDAQ:TSLA

Monday Highlight (Crypto & Stocks)Hello Traders
This is a very simple indicator that will highlight the background vertically over every Monday for Crypto and Stock markets. I use this indicator in all my technical analysis as it lets me very quickly see where each week begins without being too distracting. It can be easily customizable to whatever color, transparency level and visibility you want. Because of the way closing times are processed in different markets I could not make a single indicator to include all markets, but check out my second Monday Highlight indicator for Futures, Forex and CFD markets.
Hope you find them useful and don't forget to add them to your "favorites" list for easy access.

CANDLE FILTER Todays scripts is based on my Pullback And Rally Candles with other meaningful candles such as Hammers and Dojis.
You can choose which Candles to show on the cart and if you want to candles to appear above or below a moving average.
If you follow my work, you may recognise some of these candles which I'm about to show you however these candles are 1) more refined and 2) has moving average filters.
Ive included a D,6H,1H Candle in this script as on different timeframes - each swing low on average has a different amount of bars within the swing low / swing high so the DPB and RD will only work on the Daily
//Pullback candle
This candle is very powerful when used with simple Price Action such as Market Structure//Demand zones and support zones. (((((WORKS BEST IN UPTRENDS AND BOTTOM OF RANGES)))))
Ive included a D,6H,1H Pullback Candle in this script as on different timeframes - each swing low on average has a different amount of bars within the swing low so the DPB will only work on the Daily
//DAILY PULLBACK (Swing Traders)
snapshot
//4H PULLBACK (Swing Traders)
snapshot
- this signal will produce more signals due to the swing low filter on the 4H
//1H PULLBACK
snapshot
- this signal has been refined due to too many candle displaying in weak areas
!!!IF YOU DONT WANT TO USE PULLBACKS DURING DOWNTRENDS THEN USE THE EMA FILTER TO TURN OFF THE PULLBACKS WHEN PRICE IS BELOW THE MOVING AVERAGE!!!
//Rally candle (My personal Favourite) (((((WORKS BEST IN DOWNTRENDS AND TOP OF RANGES)))))
This candle is very powerful when used with simple Price Action such as Market Structure//Supply zones and Resistance zones.
//DAILY RALLY(Swing Traders)
snapshot
//4H RALLY(Swing Traders)
snapshot
- this signal will produce more signals due to the swing high filter on the 4H
!!!IF YOU DONT WANT TO USE RALLIES DURING UPTRENDSTHEN USE THE EMA FILTER TO TURN OFF THE RALLIES WHEN PRICE IS ABOVE THE MOVING AVERAGE!!!
//POWERFUL DOJIS (INDECISION)
snapshot
We look for indecision in key areas to see if momentum is shifting. When combined with Pullbacks or Rallys - this will enhance the odds of a probably area.
//HAMMERS
snapshot
//MOVING AVERAGES
snapshot
Short EMA = 50
Long EMA = 200
This filter can be used when the market is trending - look out for rejections off the moving averages
Also you can chance the Short And Long EMA to choose which MA cross you want to use
snapshot
ALSO ALL THE CANDLES HAVE A ALERT CONDITIONS WHICH YOU CAN ACCESS - THIS WILL ALERT ANY CANDLE YOU CHOOSE
Please leave a like/comment on this post as this is much appreciated....

Nabz-BBMACD-2022-V1.1I have tried to make script which triggers indicators on combination of different feedback including Bollinger bands and MACD. Also used some of my logic by trial and error, It gave 744%+ profit on back-testing on coin RUNE/USDT from Jan 2021. It is my first script, I am happy to help the community. Please share your feedback.

Oversold RSI with tight SL Strategy (by Coinrule)This is one of the best strategies that can be used to get familiar with technical indicators and start to include them in your trading bot rules.
ENTRY
1. This trading system uses the RSI ( Relative Strength Index ) to anticipate good points to enter positions. RSI is a technical indicator frequently used in trading. It works by measuring the speed and change of price movements to determine whether a coin is oversold (indicating a good entry point) or overbought (indicating a point of exit/entry for a short position). The RSI oscillates between 0 and 100 and is traditionally considered overbought when over 70 and oversold when below 30.
2. To pick the right moment to buy, the strategy enters a trade when the RSI falls below 30 indicating the coin is oversold and primed for a trend reversal.
EXIT
The strategy then exits the position when the price appreciates 7% from the point of entry. The position also maintains a tight stop-loss and closes the position if the price depreciates 1% from the entry price. The idea behind this is to cut your losing trades fast and let your winners ride.
The best time frame for this strategy based on our backtesting data is the daily. Shorter time frames can also work well on certain coins, however in our experience, the daily works best. Feel free to experiment with this script and test it on a variety of your coins! With our backtesting data a trading fee of 0.1% is taken into account. The fee is aligned to the base fee applied on Binance, which is the largest cryptocurrency exchange by volume. In the example shown, this strategy made a handsome net profit of 39.31% on Chainlink with 61.54% of trades being profitable.

Sideways Strategy DMI + Bollinger Bands (by Coinrule)Markets don’t always trade in a clear direction. At a closer look, most of the time, they move sideways. Relying on trend-following strategies all the time can thus lead to repeated false signals in such conditions.
However, before you can safely trade sideways, you have to identify the most suitable market conditions.
The main features of such strategies are:
Short-term trades, with quick entries and quick exits
Slightly contrarian and mean-reversionary
Require some indicator that tells you it’s a sideways market
This Sideways DMI + Bollinger Bands strategy incorporates such features to bring you a profitable alternative when the regular trend-following systems stop working.
ENTRY
1. The trading system requires confirmation for a sideways market from the Directional Movement Index (DMI) before you can start opening any trades. For this purpose, the strategy uses the absolute difference between positive and negative DMI, which must be lower than 20.
2. To pick the right moment to buy, the strategy looks at the Bollinger Bands (BB). It enters the trade when the price crosses over the lower BB.
EXIT
The strategy then exits when the move has been exhausted. Generally, in sideways markets, the price should revert lower. The position is closed when the price crosses back down below the upper BB.
The best time frame for this strategy based on our backtest is the 1-hr. Shorter timeframes can also work well on certain coins that are more volatile and trade sideways more often. However, as expected, these exhibit larger volatility in their returns. In general, this approach suits medium timeframes. A trading fee of 0.1% is taken into account. The fee is aligned to the base fee applied on Binance, which is the largest cryptocurrency exchange.

Three EMAs Trend-following Strategy (by Coinrule)Trend-following strategies are great because they give you the peace of mind that you're trading in line with the market.
However, by definition, you're always following. That means you're always a bit later than your want to be. The main challenges such strategies face are:
Confirming that there is a trend
Following the trend, hopefully, early enough to catch the majority of the move
Hopping off the trade when it seems to have run its course
This EMA Trend-following strategy attempts to address such challenges while allowing for a dynamic stop loss.
ENTRY
The trading system requires three crossovers on the same candle to confirm that a new trend is beginning:
Price crossing over EMA 7
Price crossing over EMA 14
Price crossing over EMA 21
The first benefit of using all three crossovers is to reduce false signals. The second benefit is that you know that a strong trend is likely to develop relatively soon, with the help of the fast setup of the three EMAs.
EXIT
The strategy comes with a fixed take profit and a volatility stop, which acts as a trailing stop to adapt to the trend's strength. That helps you get out of the way as soon as market conditions change. Depending on your long-term confidence in the asset, you can edit the fixed take profit to be more conservative or aggressive.
The position is closed when:
The price increases by 4%
The price crosses below the volatility stop.
The best time frame for this strategy based on our backtest is the 4-hr. Shorter timeframes can also work well, although they exhibit larger volatility in their returns. In general, this approach suits medium timeframes. A trading fee of 0.1% is taken into account. The fee is aligned to the base fee applied on Binance, which is the largest cryptocurrency exchange.

Optimised RSI strategy for Reversals (by Coinrule)The most common way to use the RSI to spot a good buy opportunity is to check for values lower than 30. Unfortunately, the RSI can remain in oversold territory for long periods, and that could leave you trapped in a trade in loss. It would be appropriate to wait for a confirmation of the trend reversal.
In the example above I use a short-term Moving Average (in this case, the MA9) coupled with an RSI lower than 40. This combination of events is relatively rare as reversal confirmations usually come when RSI values are already higher. As unusual as this setup is, it provides buy-opportunities with much higher chances of success.
The parameters of this strategy would be:
ENTRY: RSI lower than 40 and MA9 lower than the price
TAKE PROFIT and STOP-LOSS with a ratio of at least 2. That means that if you set up a take profit of 3%, your stop-loss shouldn’t be larger than 1.5%.
The advantage of this approach is that it has a high rate of success and allows you the flexibility of setting up the percentages of the take profit and stop-loss according to your preferences and risk appetite.

MACD Multiple AlertsThis script help traders to catch bullish and bearish momentum. It creates an alert for 40 altcoins based on the MACD cross over and cross under.
The MACD input are adjustable in the settings and you can choose your favorite assets.
Simply add this indicator to the chart wait that if finish to load and then create an alert on the time frame of your choice.
Enjoy your trading
F_rank_01

ScalpiusTrendCrypto trader and trading system developer Scott Phillips recently introduced a crypto trading system that specifies a set of rules for determining whether the crypto is in a trend. While the rules are not overly complex, they are complex enough that manual trend determination is somewhat laborious and prone to error. The ScalpiusTrend script is designed to automate this process. It operates is briefly summarized as follows:
1. It looks for a bar that breaks the Bollinger Band. That starts a pending trend.
2. When we find another bar with a higher high and higher close (uptrend) or lower low and lower close (downtrend), then the trend is confirmed.
3. The trend ends when the price touches the opposite Bollinger Band, or goes 20 bars without making a new low and new close.
The indicator is shown as a histogram plot below the main chart window. By default, the short black pending trend bars are off, but you can enable the Pending Bars checkbox in the indicator Settings menu to turn them on.

VIX FixSistema de trading hecho por Larry Williams, basado en VIX, optimizado para cualquier activo.
Formula:
(Highest (Close, 20) - Low) / (Highest (Close, 20)) * 100
Donde “Highest (Close, 20)” representa el cierre mas alto de los ultimos 20 periodos
Larry Williams Mechanical Trading System based on VIX.
The VIX Fix applies the same general formula that is used to calculate the stochastic indicator, so can be used for any asset:
(Highest (Close, 20) - Low) / (Highest (Close, 20)) * 100
Where “Highest (Close, 20)” means the highest closing value in the past 20 periods and the low refers
to the current period’s low. The formula can be applied to any timeframe.
Fukuiz Octa-EMA + Ichimoku (Strategy)This strategy is based EMA of 8 different period and Ichimoku Cloud which works better in 1hr 4hr and daily time frame.
#A brief introduction to Ichimoku #
The Ichimoku Cloud is a collection of technical indicators that show support and resistance levels, as well as momentum and trend direction. It does this by taking multiple averages and plotting them on a chart. It also uses these figures to compute a “cloud” that attempts to forecast where the price may find support or resistance in the future.
#A brief introduction to EMA#
An exponential moving average ( EMA ) is a type of moving average (MA) that places a greater weight and significance on the most recent data points. The exponential moving average is also referred to as the exponentially weighted moving average . An exponentially weighted moving average reacts more significantly to recent price changes than a simple moving average ( SMA ), which applies an equal weight to all observations in the period.
#How to use#
The strategy will give entry points itself, you can monitor and take profit manually(recommended), or you can use the exit setup.
EMA (Color) = Bullish trend
EMA (Gray) = Bearish trend
#Condition#
Buy = All Ema (color) above the cloud.
SELL= All Ema turn to gray color.

Level 1 - Learn to code simply - PineScriptThe goal of this script is honestly to help everyone learn about trading with bots and algos.
At least, to get started.
Level 1:
10 lines of code.
learn to plot 2 moving averages on your chart.
learn to create a signal from a crossover.
learn the very basics of Pine Script algo.

Oversold RSI with Tight Stop-Loss Strategy (by Coinrule)KRAKEN:LINKUSD
This is one of the best strategies that can be used to get familiar with technical indicators and start to include them in your rules on Coinrule .
ENTRY
1. This trading system uses the RSI (Relative Strength Index) to anticipate good points to enter positions. RSI is a technical indicator frequently used in trading. It works by measuring the speed and change of price movements to determine whether a coin is oversold (indicating a good entry point) or overbought (indicating a point of exit/entry for a short position). The RSI oscillates between 0 and 100 and is traditionally considered overbought when over 70 and oversold when below 30.
2. To pick the right moment to buy, the strategy enters a trade when the RSI falls below 30 indicating the coin is oversold and primed for a trend reversal.
EXIT
The strategy then exits the position when the price appreciates 7% from the point of entry. The position also maintains a tight stop-loss and closes the position if the price depreciates 1% from the entry price. The idea behind this is to cut your losing trades fast and let your winners ride.
The best time frame for this strategy based on our back testing data is the daily. Shorter time frames can also work well on certain coins, however in our experience, the daily works best. Feel free to experiment with this script and test it on a variety of your coins! With our back testing data a trading fee of 0.1% is taken into account. The fee is aligned to the base fee applied on Binance, which is the largest cryptocurrency exchange by volume. In the example shown, this strategy made a handsome net profit of 52.6% on Chainlink with 66.67% of trades being profitable.
You can execute this strategy on your favorite exchanges with Coinrule .

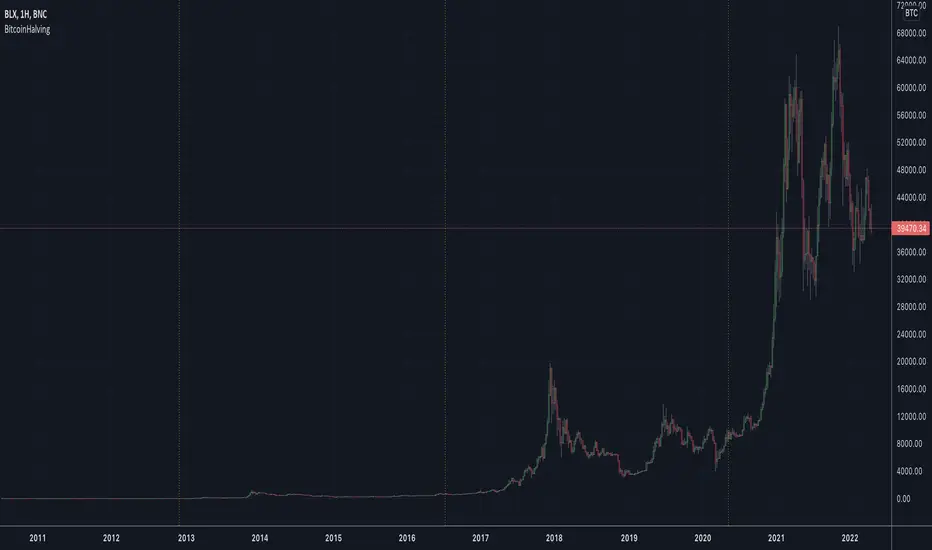
BitcoinHalvingLibrary "BitcoinHalving"
Displays where Bitcoin's halvings have been
getDates() List of Bitcoin halving dates
Returns: array with timestamp dates
isHalvingDay() Checks if the current day is a halving day
Returns: bool
Candle Colored by Volume Z-score [Morty]This indicator colors the candles according to the z-score of the trading volume. You can easily see the imbalance on the chart. You can use it at any timeframe.
In statistics, the standard score (Z-score) is the number of standard deviations by which the value of a raw score (i.e., an observed value or data point) is above or below the mean value of what is being observed or measured. Raw scores above the mean have positive standard scores, while those below the mean have negative standard scores.
This script uses trading volume as source of z-score by default.
Due to the lack of volume data for some index tickers, you can also choose candle body size as source of z-score.
features:
- custom source of z-score
- volume
- candle body size
- any of above two
- all of above two
- custom threshold of z-score
- custom color chemes
- custom chart type
- alerts
default color schemes:
- green -> excheme bullish imbalance
- blue -> large bullish imbalance
- red -> excheme bearish imbalance
- purple -> large bearish imbalance
- yellow -> low volume bars, indicates "balance", after which volatility usually increases and tends to continue the previous trend
Examples:
* Personally, I use dark theme and changed the candle colors to black/white for down/up.
Volume as Z-score source
Any as Z-score source, more imbalances are showed

Moving Averages With Cross AlertsA simple way to add up to 5 moving averages with optional crossover/crossunder alerts.
Available options for Moving Average Type are:
SMA
EMA (default)
HMA
RMA
WMA
VWMA
VWAP
ALMA
By default, 5 moving averages are enabled and set to the following:
MA1 set to 5
MA2 set to 13
MA3 set to 50
MA4 set to 200
MA5 set to 800
Each moving average has the following options:
Enable/Disable
Source (default is close)
Length
Color
Premium IndexThis indicator shows the premium index data for the market (only crypto) you're currently looking at.
The premium index is the difference in price between the perpetual swap contract and the spot index price.
In plain and simple English: it shows whether the spot market for a specific coin is trading at a discount or at a premium.
This is official data from the exchange itself.
At the moment of publishing TradingView only has data for Binance.
So only use this indicator on Binance charts right now (USDT perps and BUSD perps).
Make sure you're looking at a perpetual swap contract, if you're looking at the spot market for example the indicator won't work.
Once TradingView adds more data like this I'll try to make sure that the logic of the code will also work for other markets.
