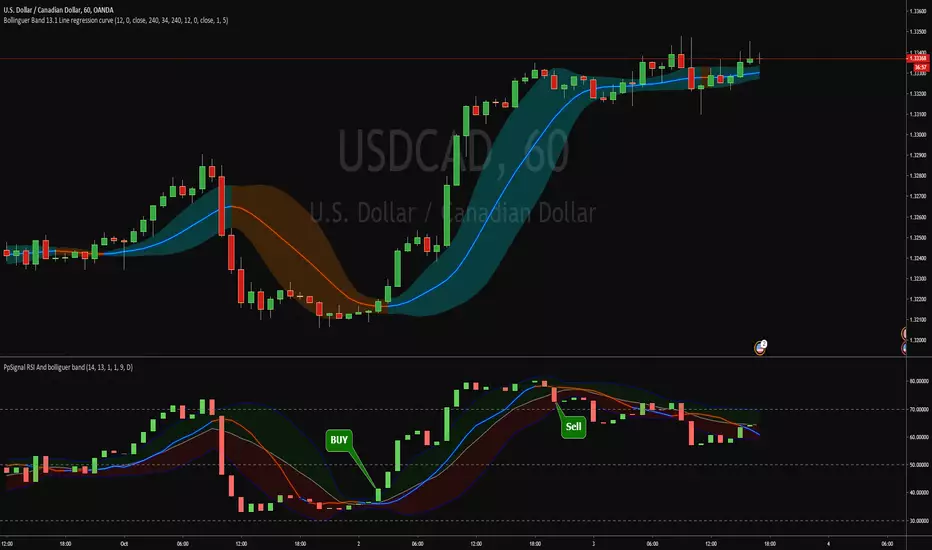
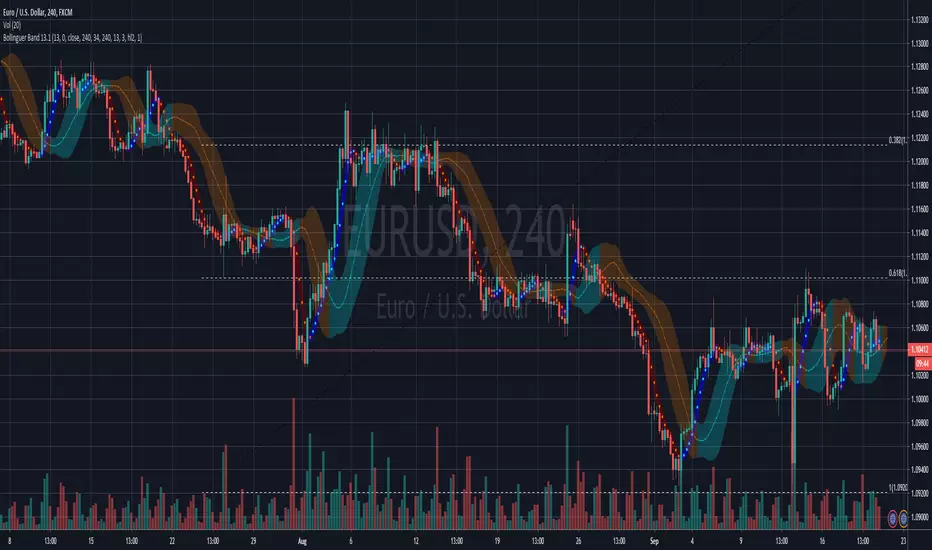
Bollinguer Band 13.1 Line regression curvelinear regression band, bouy when the price is above of the high band en sell when the price is bellow low band.
Mata Wang Kripto

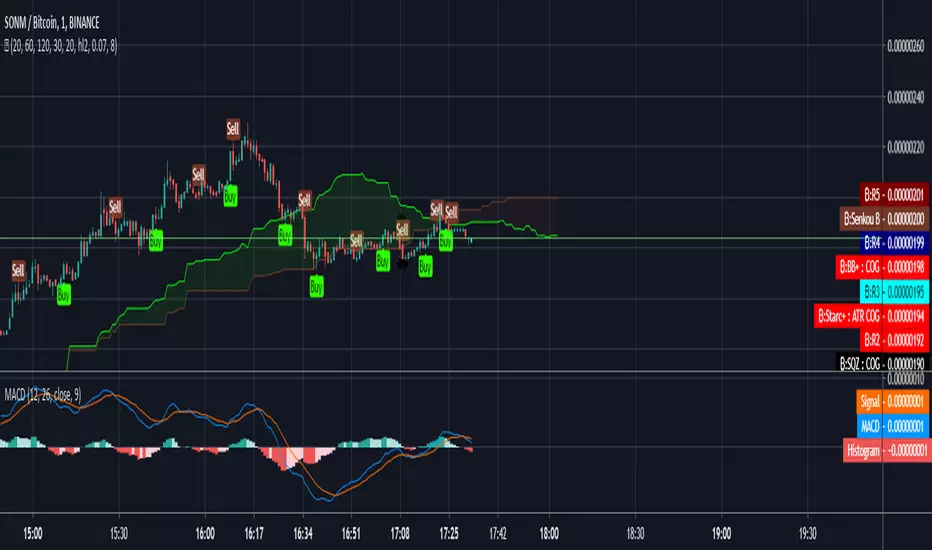
PpSignal RSI and bollinguer bandRSI bollinguer band oscillator, buy when the Ma is blue and the rsi is on the upper band and sell when de ma is red and rsi is cross down the lower band..
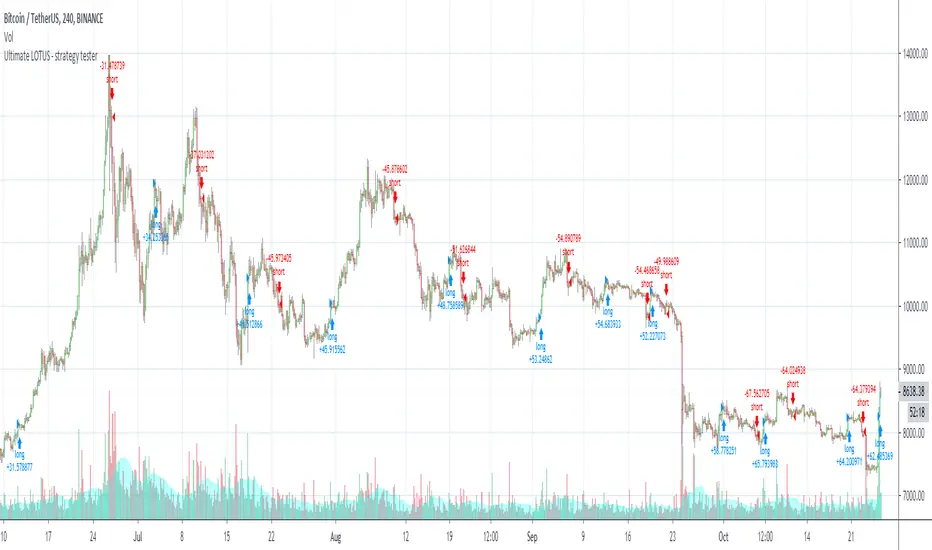
Ultimate LOTUS - strategy tester
Welcome to the Ultimate LOTUS - Strategy Tester.
This indicator is used for back-testing. Once you have found settings that you like, you can use my other published indicator "Ultimate LOTUS" to set alerts.
How to use: Apply to any chart, on any time frame. You will see LONG and SHORT signals on the chart. A LONG signal represents an entry/buy in, and a SHORT signal represents an exit/sell.
You can use the Express - Strategy Tester to scalp on low time frames such as the 5m, 15m, 30m etc. Or use it on higher time frames such as the 1hr, 2hr, 4hr.
You can use regular candles but Heikin Ashi are recommended for better accuracy.
You cannot set alerts with this indicator!
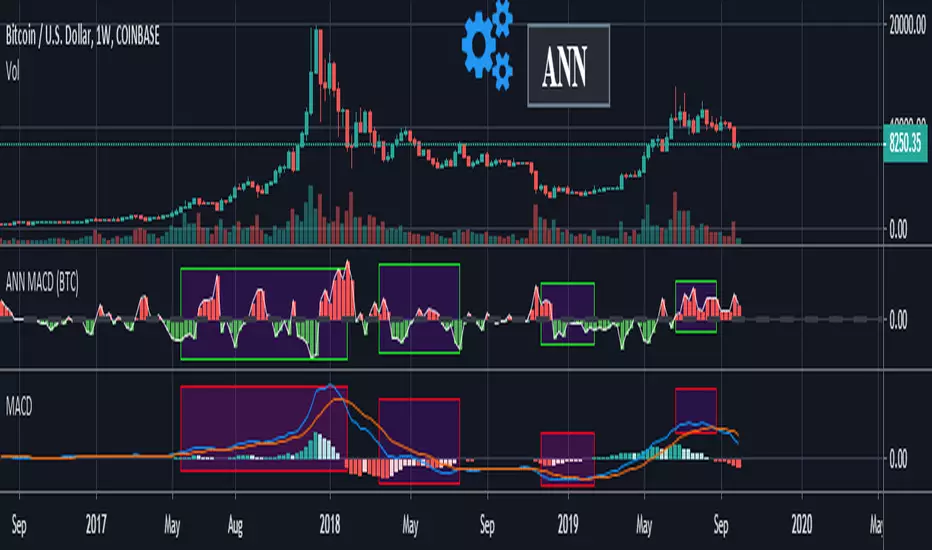
ANN MACD (BTC)
Logic is correct.
But I prefer to say experimental because the sample set is narrow. (300 columns)
Let's start:
6 inputs : Volume Change , Bollinger Low Band chg. , Bollinger Mid Band chg., Bollinger Up Band chg. , RSI change , MACD histogram change.
1 output : Future bar change (Historical)
Training timeframe : 15 mins (Analysis TF > 4 hours (My opinion))
Learning cycles : 337
Training error: 0.009999
Input columns: 6
Output columns: 1
Excluded columns: 0
Grid
Training example rows: 301
Validating example rows: 0
Querying example rows: 0
Excluded example rows: 0
Duplicated example rows: 0
Network
Input nodes connected: 6
Hidden layer 1 nodes: 8
Hidden layer 2 nodes: 0
Hidden layer 3 nodes: 0
Output nodes: 1
Learning rate : 0.6 Momentum : 0.8
More info :
EDIT : This code is open source under the MIT License. If you have any improvements or corrections to suggest, please send me a pull request via the github repository github.com
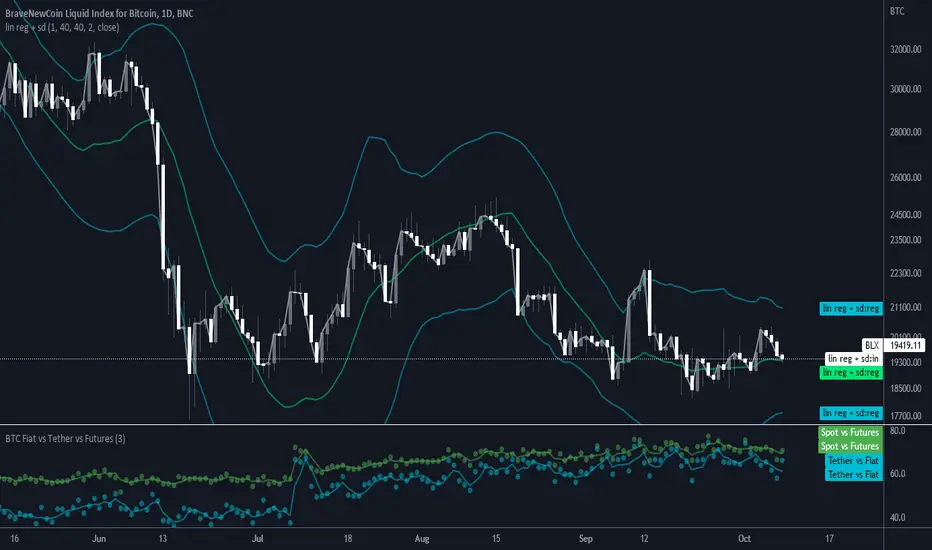
BTC Volume Fiat vs Tether vs FuturesFutures = BYBIT+ BITMEX
Fiat = KRAKEN + BITSTAMP + BITFLYER + COINBASE
Tether = HITBTC + HUOBI + BINANCE + BITFINEX
Spot = Fiat + Tether
Tether vs Fiat = 100 * Tether / (Tether + Fiat)
Spot vs Futures = 100 * Spot / (Spot + Futures)
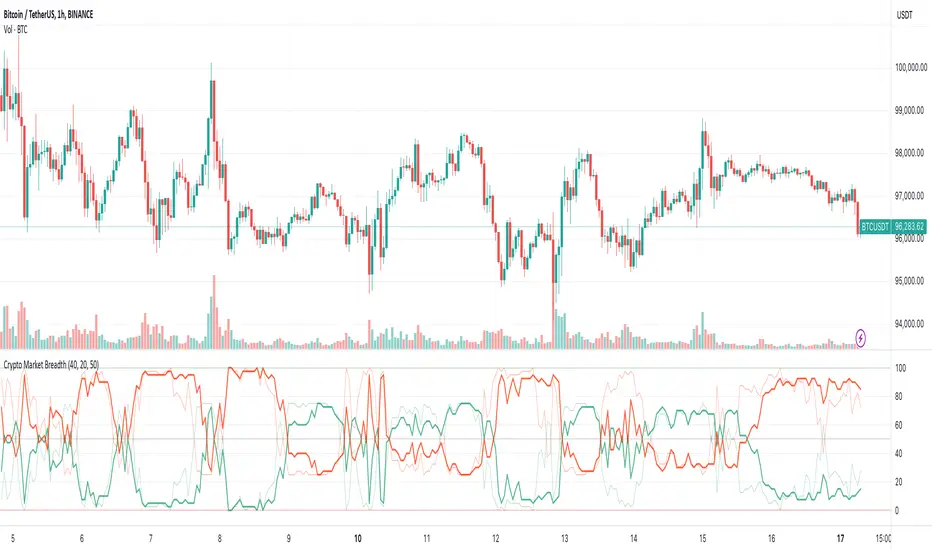
Crypto Market BreadthThis is the "Crypto Market Breadth" indicator from
I updated it to latest symbol so that it resolves again:
removed: BINANCE:NPXSUSD
added: BITFINEX:LEOUSD
Also helpful for automatic trading with WolfBot.org and TradingView Integration
ZomyzoX Scalp 1 MinuteEnglish
XBTBTC, BTCUSD , BTCUSDT is a strategy made to parity for 1 minute. Scalp is a very successful strategy for trading. It is free to use. Optionally, other strategies can be written.
Contact
Twitter: @zomyzox
Mail: oguzhan.yilmaz@hotmail.com.tr
Türkçe
XBTBTC, BTCUSD , BTCUSDT paritesi için 1 DK'da scalp trade için yazılmıştır. Scalp trade için başarılı buluyorum. Kullanımı ücretsizdir. İsteğe göre başka stratejilerde yazabilirim.
İletişim
Twitter: @zomyzox
Mail: oguzhan.yilmaz@hotmail.com.tr

FCO FIRE
FCO FIRE
BitMEX trades highly successful scalp in XBTUSD parity. You can use it not only for crypto but also high success on stock market.
You can contact to use.
Improvement works in progress...

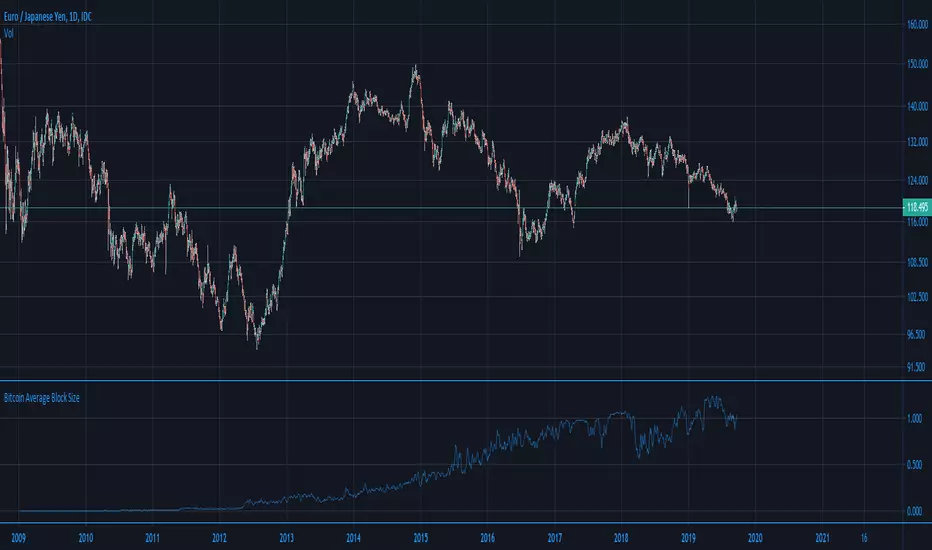
Ori Bitcoin Average Block SizeThis indicator shows Bitcoin Average Block Size . Have options to toggle line/trend view, log on/off and smoothing for line view.
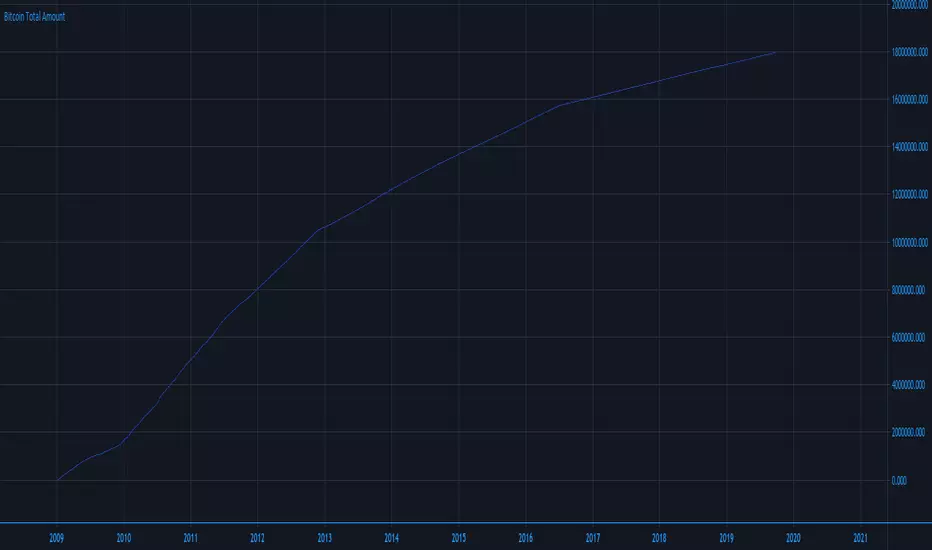
Ori Bitcoin Total AmountThis indicator shows total amount of Bitcoin. Have options to toggle line/trend view, log on/off and smoothing for line view.
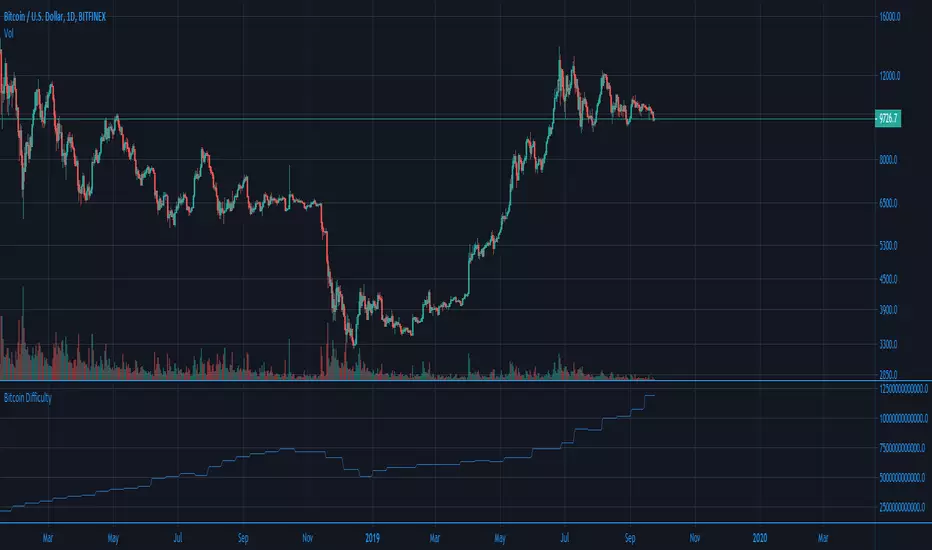
Ori Bitcoin DifficultyThis indicator shows Bitcoin Mining Difficulty. Have options to toggle line/trend view, log on/off and smoothing for line view.
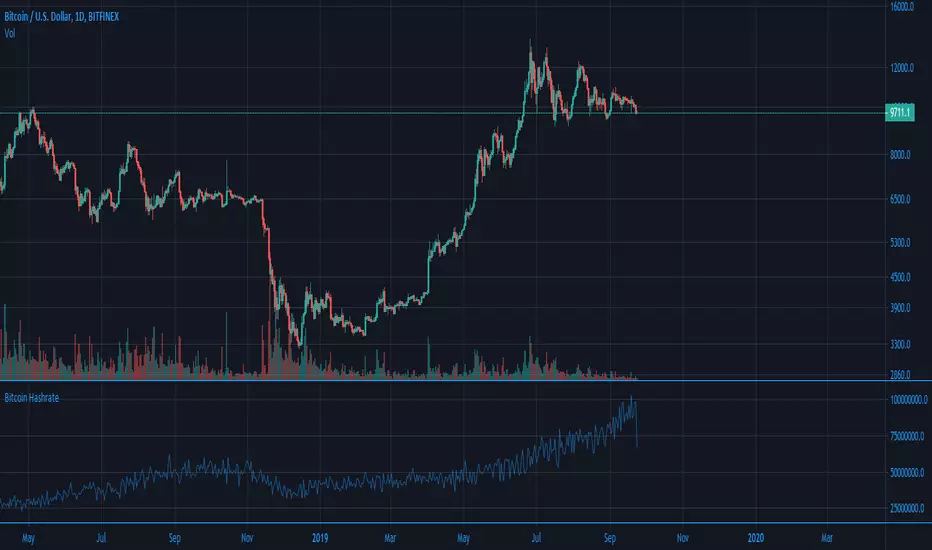
Ori Bitcoin HashrateThis indicator shows Bitcoin Hashrate. Have options to toggle line/trend view, log on/off and smoothing for line view.
Bollinguer Band 13.1Ppsignal Bollinguer band period 13 deviation for a swing trade.
Buy when the price is over the band and vice-versa in seel position

CS Trading Bot Study - Crypto EditionWhat is this Study about?
The CS Trading Bot Study is for getting Open Long (Buy) and Close Long signals (Sell) that you can use to get alerts in various ways (Webhooks, Emails, etc).
The Study is very profitable for a vast amount of Crypto assets and the algorithm behind is not overfitted.
How to use it?
Make sure to start your research and find your favorite Crypto assets using the corresponding strategy:
The research process is very important as you can see beforehand how well the alerts for this Study would perform.
Make sure to read the Strategy's description, as well!
After you found your Crypto assets of interest using the corresponding Strategy...
Open a new chart for each asset and add the Study from your favorite indicators.
Click on the alert symbol on your chart and from "Condition" choose the "CS Bot" Strategy.
Then below choose "CS Bot Buy Alert" and "CS Bot Sell Alert" (each separate alerts).
Under "options" check "Once per bar" (very important) .
Pick your desired way of getting the alerts (app, popup, email, webhook).
The webhooks for setting alerts are very interesting as you can forward your signals to your own trading bot or simply wait until my trading bot is available (currently in development)
Since I develop myself, rest assured it will be available soon. Look out for comments below as soon as it is available!
How to access?
If you are interested to get access to the complete package, please don't hesitate to send me a private message for a quote.
The amount of concurrent users using the package (=licenses) is limited to max. 500 a month (more we cannot manually handle has Tradingview has no automation for this yet).
Access to the bot package is based on a monthly basis. If you get access, you will asked in person at the end of the month if you want to continue or not.
The monthly fee depends on the demand, but for as long as you continue using the package your initial price stays the same!

CS Trading Bot Strategy - Crypto EditionWhat is this strategy about?
The CS Trading Bot Strategy is for researching the most lucrative Crypto assets to be selected for in the corresponding Study (that actually generates alerts/signals).
The Strategy is very profitable for a vast amount of Crypto assets and the algorithm behind is not overfitted.
How to use it?
As a rule of thumb, the best time-frames are the 4h, 3h, 2h and 1h (sometimes 30M and 45M).
For many high profile/volume assets such as BTC, ETH and XRP the Daily is very profitable, as well. Weekly and Monthly time-frames should be avoided.
It is not recommended to apply this strategy to new assets with only a few weeks of history. I recommend a history of at least 6 months and 5 trades in the Strategy stats.
In the Strategy settings, you can adjust the time-span to see how the Strategy performs in certain conditions like bear-markets (see for example 4H on BTCUSDT from Jan 2018 - March 2019).
What to look for on researching?
If you are researching, make sure to look for these metrics in the Strategy overview:
Linear equity growth (especially over a larger period of time)
Low drawdown
Profitability above 50%
Average gain per trade of 5%
A satisfying profit for your selected time-span
Min. 5 trades, better 10
Min. 6 Months time-span
As a head-start, I suggest to research on the following assets, so you get a feeling about what to look for based on the list above:
POLONIEX:BTCUSDT
POLONIEX:ETHUSDT
POLONIEX:XRPUSDT
Why Poloniex? Because it has a long history for these assets...
Once you determined your favorite assets, you are ready to add the corresponding Study and within, set alerts for them.
Here the Webhooks are very interesting as you can forward your signals to your own trading bot or simply wait until my trading bot is available (currently in development)
Since I develop myself, rest assured it will be available soon. Look out for comments below as soon as it is available!
The bot is a commercial package including:
This Strategy for finding the best assets
The Study for setting alerts based on the best assets (webhooks, emails, popups, etc)
Access to our automated trading bot (separate download, as soon as available)
How to access?
If you are interested to get access to the complete package, please don't hesitate to send me a private message for a quote.
The amount of concurrent users using the package (=licenses) is limited to max. 500 a month (more we cannot manually handle has Tradingview has no automation for this yet).
Access to the bot package is based on a monthly basis. If you get access, you will asked in person at the end of the month if you want to continue or not.

Lancelot vstop intraday trending strategyDear all,
Free strategy again.
I found using 3 volatility stop with different settings could be very helpful when trading an intraday trending market.
With the ATR setting or 5, 10, 15, we can weed out many false break.
Vstop setting is OHLC4.
On the other hand, this strategy also utilize Renko as part of the strategy, so you could say this strategy is mainly an intraday break out trend following strategy.
Works well on BTCUSD XBTUSD, as well as other major liquid alt Pairs.
And lastly,
Save Hong Kong, the revolution of our times.

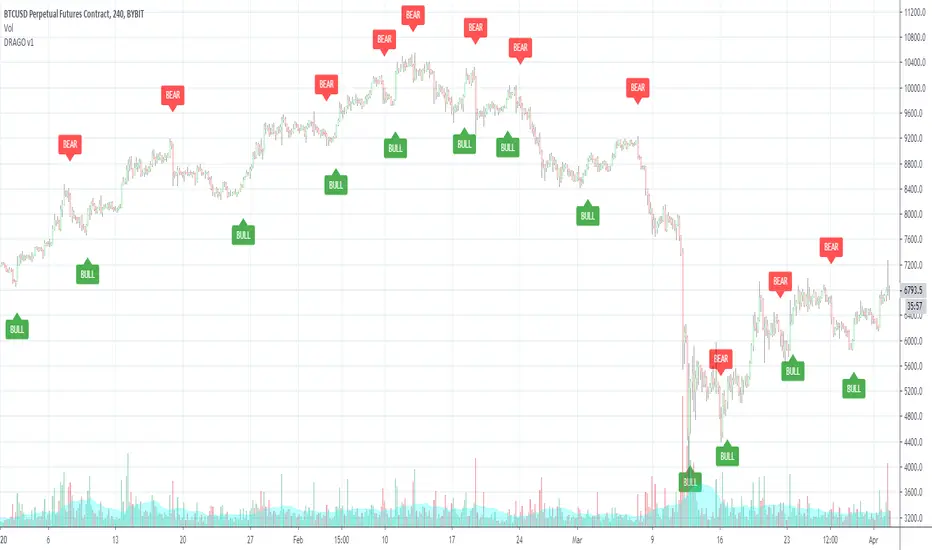
DRAGO v1Welcome to the DRAGO v1.
This indicator is best used on heikin ashi candles on higher timeframes such as 4hr, 1 day.
You can set alerts on this indicator for Buys and Sells.
This indicator does NOT repaint.
No back tester is currently provided with the Express.
DM for access!
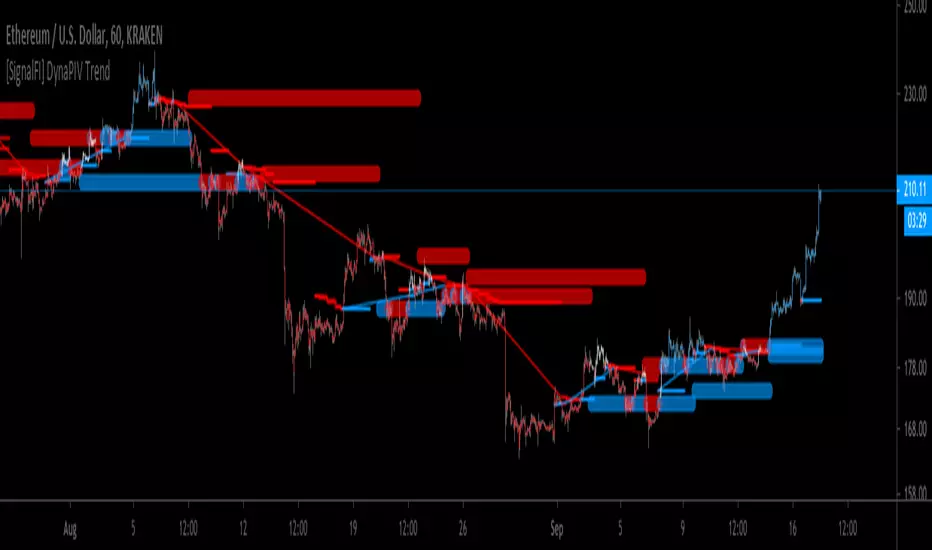
[SignalFI] DynaPIV TrendWelcome!
We're pleased to introduce DynaPIV Trend! This single script provides a array of valuable trend information that can help in short term scalping strategies, and helping define trend strength across support and resistance points.
The heart of DynaPIV is an dynamic, volatility adjusted moving average based on fibonacci ratios. The script creates a visual representation of trend based on the pivots created with this dynamic moving average as has both short and long term support and resistance lines delineated by color and thickness.
In general, the script will color bars according to the trend. By default, our safe mode is enabled which will filter out potential false breakouts, as well identify channeling zones (where bars are white). Disabling Safe Mode will provide more opportunities for scalping, however increases the risk of trend invalidation. By nature the trader is meant to follow the comprehensive visual presented by DynaPIV Trend, inclusive of horizontal and diagonal painted support and resistance lines.
NOTE: The script is useful for timeframes 5M to 2HR. However the recommended is 30M - 1HR. Using the script on higher timeframes will invalidate the dynamic nature of the DynaPIV Trend volatility calculation and thus render the trend invalid.
SignalFI was created to help traders and investors to effectively analyze the market based on the Golden Mean Ratio (Fibonacci numbers), plan a trade and ultimately execute it. To help inform and educate market decisions we developed a set of Trading Indicators which are available on TradingView.
SignalFI indicators are just that, indicators. Our indicators are generally configured to use completely historical data (negating repaint), and we advise all alerts created with SignalFI indicators to be fired upon "close" of the current candle. Our indicators can provide valuable context and visualization support when performing market analysis and executing buy and sell decisions. However. we are not financial experts, and all information presented on this site or our other media outlets are for educational purposes only.
For subscription information, visit www.signalfi.net and follow us on twitter: @signalfi_
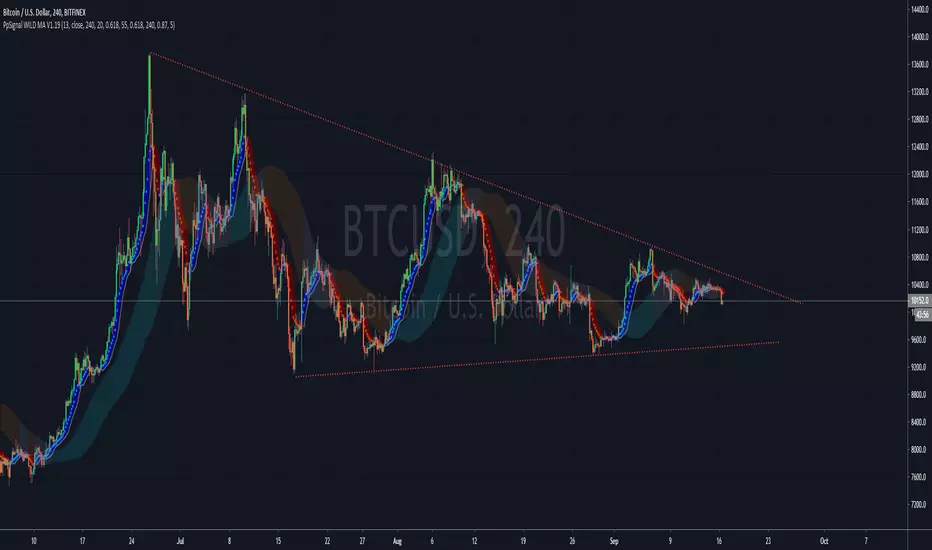
PpSignal WILD MA V1.19Wilder's Moving Average. Also called Wilder's Smoothed Moving Average, this indicator is similar to the Exponential Moving Average. Compared to other moving averages, Wilders MA responds more slowly to price changes, where an n-period Wilder MA gives similar values to a 2n- period EMA.
We added a standard deviation average.
buy when wilder is in blue color and standard average in aqua color.
Se ll when all is red
QuarryLake v4As some of you requested, I will make the code for QuarryLake Open for you all.
I have also updated the script in version 4.
This strategy consists of 3 indicators that I found works quite well together.
Keltner Channel, Waddah Attah Explosion, and Volatility Stop .
KC Period = 200
KCATR = 5
Vstop Period = 3
Vstop Mult = 1.5
Long when close > KC, close > Vstop, WAE trendUp
Short when close < KC, close < Vstop, WAE trendDown
Works well on BTCUSD XBTUSD , as well as other major liquid Pair.
This strategy utilized a modified Kelly position sizing for BTCUSD Bitstamp , feel free to modify it to your needs.
And lastly,
Save Hong Kong, the revolution of our times.

Lancelot RR StrategyDear all,
Free strategy again.
This strategy consists of 2 indicators I think works well with each other as a trend following strategy.
The 2 indicators are Renko chart and Relative Vigor Index.
This is a long-only breakout strategy that aims to capture the majority of the trend.
Works well on BTCUSD XBTUSD, as well as other major liquid Pair.
Please acknowledge my effort by like and follow.
And lastly,
Save Hong Kong, the revolution of our times.
