Aggregated Volume LTCBTCAggregates the LTC/BTC volume from multiple exchanges into a single indicator.
# Exchanges and Pairs
Included are only exchanges supported by TradingView:
* Binance
* Bitstamp
* Bittrex
* Coinbase
* Gemini
* Bitfinex
* Kraken
* Poloniex
* HitBTC
Many other top exchanges are not included, because they are not supported by TradingView.
# Inputs
By default the spot exchanges are selected. You can select also the other margin trading and derivatives exchanges.
# Contribute
Feel free to share any ideas and issues you have.
# Open Source
The code is open source @ github.com and uses the commonpine library github.com
Mata Wang Kripto

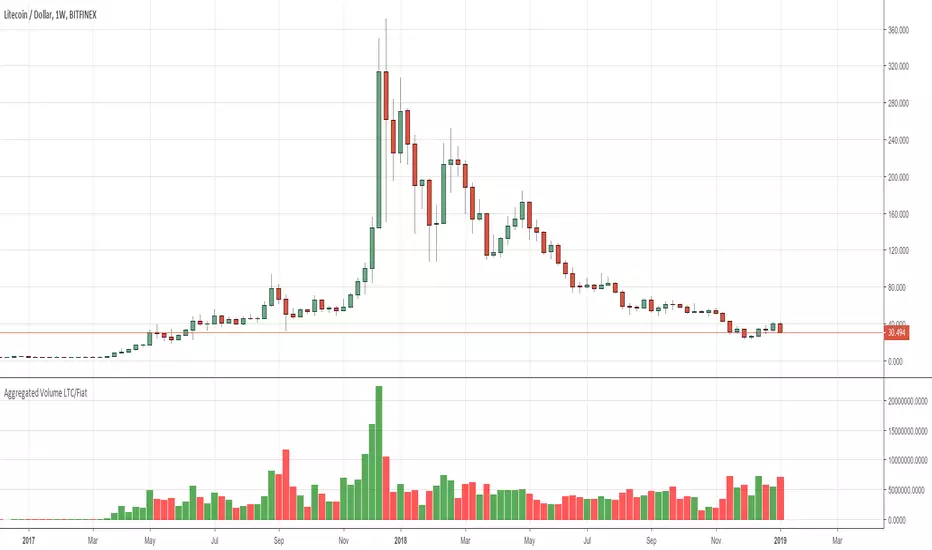
Aggregated Volume LTC/FiatAggregates the LTC/Fiat volume from multiple exchanges into a single indicator.
# Exchanges and Pairs
Included are only exchanges supported by TradingView:
* Binance
* Bitstamp
* Bittrex
* Coinbase
* Gemini
* Bitfinex
* Kraken
* Poloniex
* HitBTC
Many other top exchanges are not included, because they are not supported by TradingView.
The pair LTC/BTC is not included.
# Inputs
By default the spot exchanges are selected. You can select also the other margin trading and derivatives exchanges.
# Contribute
Feel free to share any ideas and issues you have.
# Open Source
The code is open source @ github.com and uses the commonpine library github.com

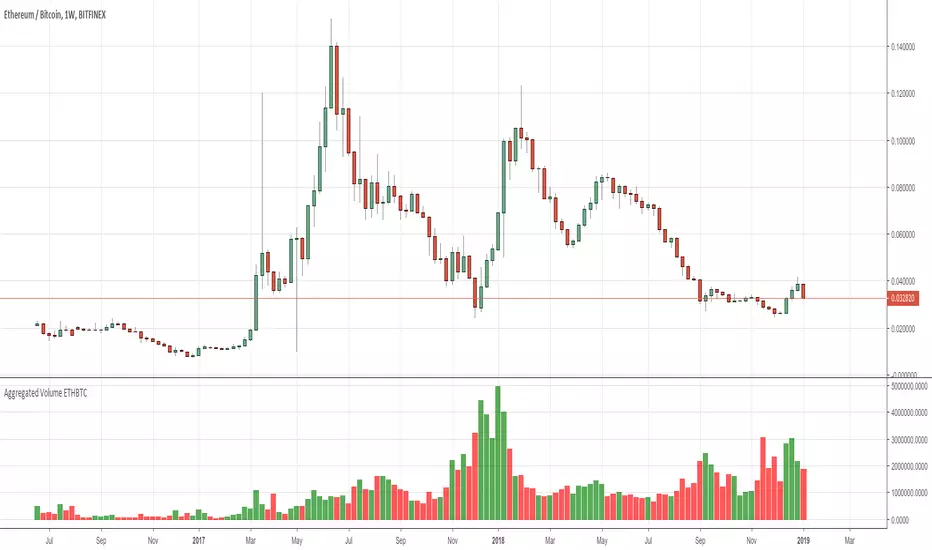
Aggregated Volume ETHBTCAggregates the ETH/BTC volume from multiple exchanges into a single indicator.
# Exchanges and Pairs
Included are only exchanges supported by TradingView:
* Binance
* Bitstamp
* Bittrex
* Coinbase
* Gemini
* Bitfinex
* Kraken
* Poloniex
* HitBTC
Excluded low volume exchanges (not in CMC Top):
* CEX.IO
Many other top exchanges are not included, because they are not supported by TradingView.
# Inputs
By default the spot exchanges are selected. You can select also the other margin trading and derivatives exchanges.
# Contribute
Feel free to share any ideas and issues you have.
# Open Source
The code is open source @ github.com and uses the commonpine library github.com
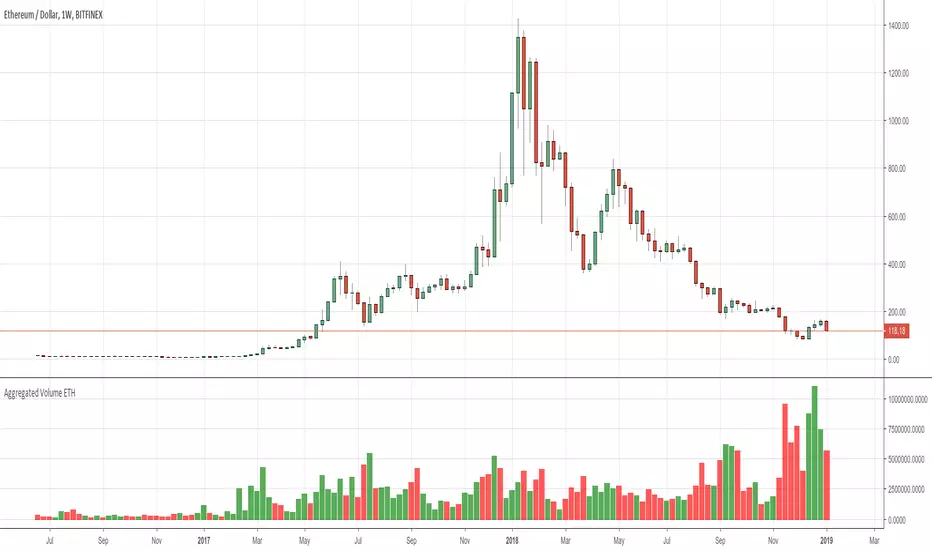
Aggregated Volume ETHAggregates the ETH/fiat volume from multiple exchanges into a single indicator.
# Exchanges and Pairs
Included are only exchanges supported by TradingView:
* Binance
* Bitstamp
* Bittrex
* Coinbase
* Gemini
* itBit
* Bitfinex
* Kraken
* Poloniex
* BitMEX
Excluded low volume exchanges (not in CMC Top):
* CEX . IO
* Coinfloor
Excluded exchange due to volume calculation by TV:
* HitBTC
Many other top exchanges are not included, because they are not supported by TradingView.
# Inputs
By default the spot exchanges are selected. You can select also the other margin trading and derivatives exchanges.
# Contribute
Feel free to share any ideas and issues you have.
# Open Source
The code is open source @ github.com and uses the commonpine library github.com
HATbot v1 Automation Script and Indicator [Backtest]This is the debut release of HATbot.
HATbot is a terrible name for a new trend following indicator and strategy script.
Backtest window: 2018-01-01 to 2019-01-01.
Initial capital: $1000
Shorting: enabled

LOTUS Bitcoin traderThis script is strictly created for trading bitcoin only. Do not attempt to use this for any other charts. The LOTUS Bitcoin trader is only meant to be used with Heikin Ashi candles, and only on the 2 hour time frame. Recommended to only use this on the Binance BTC/USDT chart. To use this script correctly, you must sell when the first red triangle appears and buy when the first green triangle appears. You can also set email, SMS and pop up alerts!

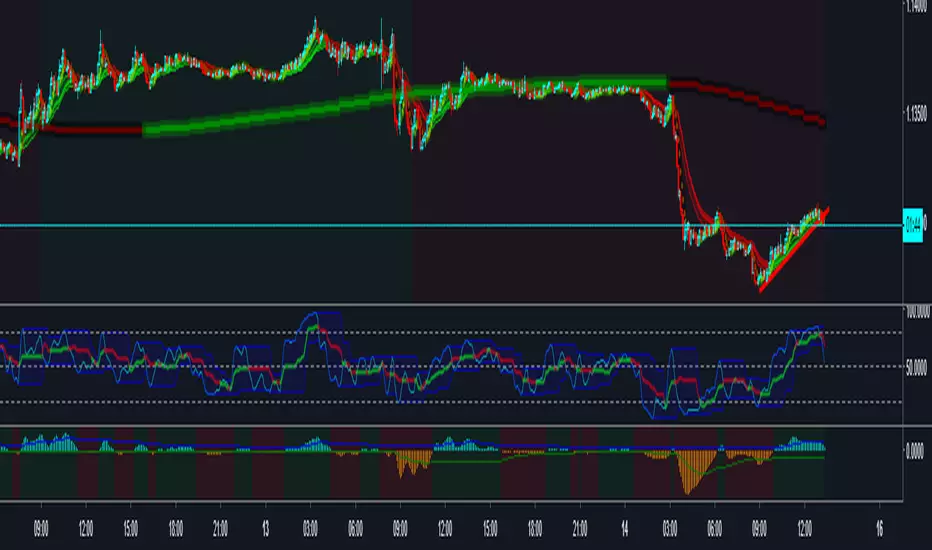
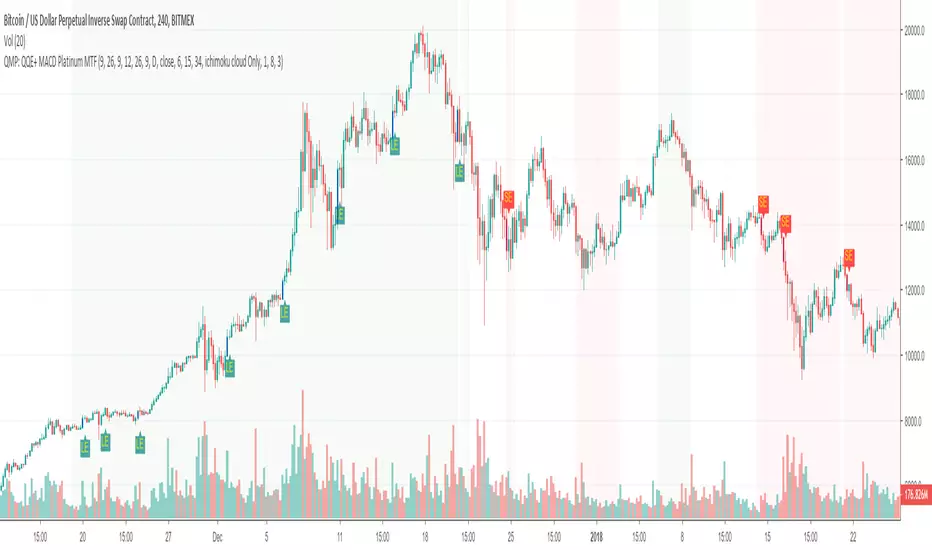
Trend following and reversal strategy for cryptoThe idea of this indicator comes from Jim Brown's book.
using the "MACD Platinum" and "QQE advanced" and multi-timeframe.
The difference to the original idea is that I use Ichimoku cloud for trend detection.
[SignalFI] VectorFI V1 [Alerts]Fibonacci Based Fan Projections based on alternate timeframes.
IDENTIFY SUPPORT & RESISTANCE
IDENTIFY PRICE CHANNELS
MOMENTUM TRENDING ANALYSIS
ALERTS VERSION Only for Jedi and Master Subscribers
SignalFI was created to help traders and investors to effectively analyze the market based on the Golden Mean Ratio (Fibonacci numbers), plan a trade and ultimately execute it. To help inform and educate market decisions we developed a set of Trading Indicators which are available on TradingView , the most advanced and yet easy to use charting platform available on the web.
SignalFI indicators are just that, indicators. Our indicators are generally configured to use completely historical data (negating repaint), and we advise all alerts created with SignalFI indicators to be fired upon "close" of the current candle. Our indicators can provide valuable context and visualization support when performing market analysis and executing buy and sell decisions. However. we are not financial experts, and all information presented on this site or our other media outlets are for educational purposes only.
For subscription information, visit www.signalfi.net and follow us on twitter.

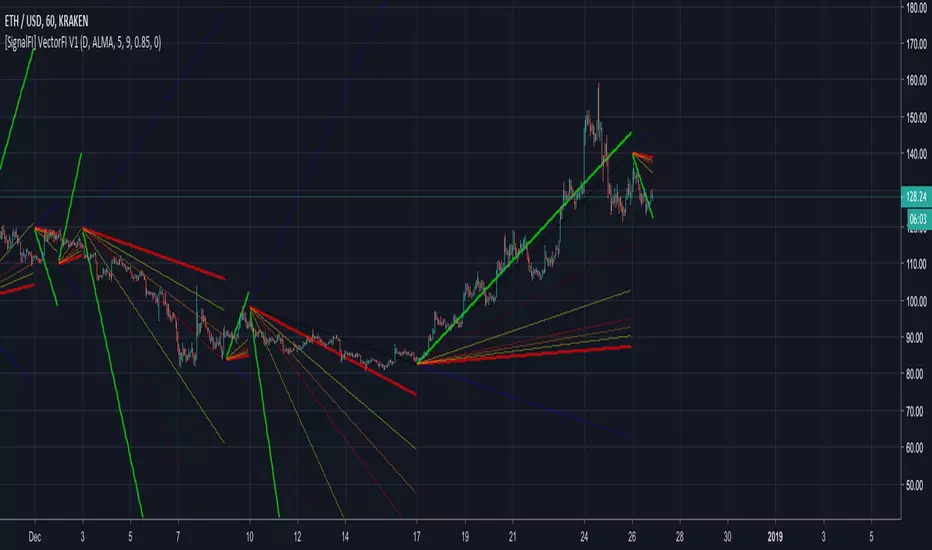
[SignalFI] VectorFI V1Fibonacci Based Fan Projections based on alternate timeframes.
IDENTIFY SUPPORT & RESISTANCE
IDENTIFY PRICE CHANNELS
MOMENTUM TRENDING ANALYSIS
SignalFI was created to help traders and investors to effectively analyze the market based on the Golden Mean Ratio (Fibonacci numbers), plan a trade and ultimately execute it. To help inform and educate market decisions we developed a set of Trading Indicators which are available on TradingView , the most advanced and yet easy to use charting platform available on the web.
SignalFI indicators are just that, indicators. Our indicators are generally configured to use completely historical data (negating repaint), and we advise all alerts created with SignalFI indicators to be fired upon "close" of the current candle. Our indicators can provide valuable context and visualization support when performing market analysis and executing buy and sell decisions. However. we are not financial experts, and all information presented on this site or our other media outlets are for educational purposes only.
For subscription information, visit www.signalfi.net and follow us on twitter.
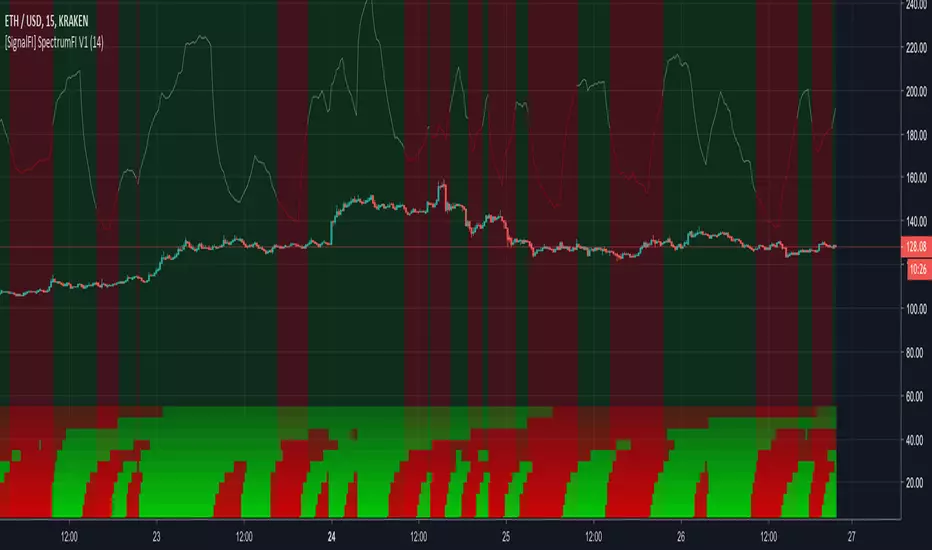
[SignalFI] SpectrumFI V1SpectrumFI uses 11 independent Fibonacci based moving averages and their associated momentum to create a unified trend signal.
FIBONACCI BASED TREND DISCOVERY
DIFFERENCE STATISTICS COMBINED WITH RSI MOMENTUM
HEATMAP AND RSI INDICATORS BUILT INTO ONE TRADINGVIEW INDICATOR
SignalFI was created to help traders and investors to effectively analyze the market based on the Golden Mean Ratio (Fibonacci numbers), plan a trade and ultimately execute it. To help inform and educate market decisions we developed a set of Trading Indicators which are available on TradingView , the most advanced and yet easy to use charting platform available on the web.
SignalFI indicators are just that, indicators. Our indicators are generally configured to use completely historical data (negating repaint), and we advise all alerts created with SignalFI indicators to be fired upon "close" of the current candle. Our indicators can provide valuable context and visualization support when performing market analysis and executing buy and sell decisions. However. we are not financial experts, and all information presented on this site or our other media outlets are for educational purposes only.
For subscription information, visit www.signalfi.net and follow us on twitter.
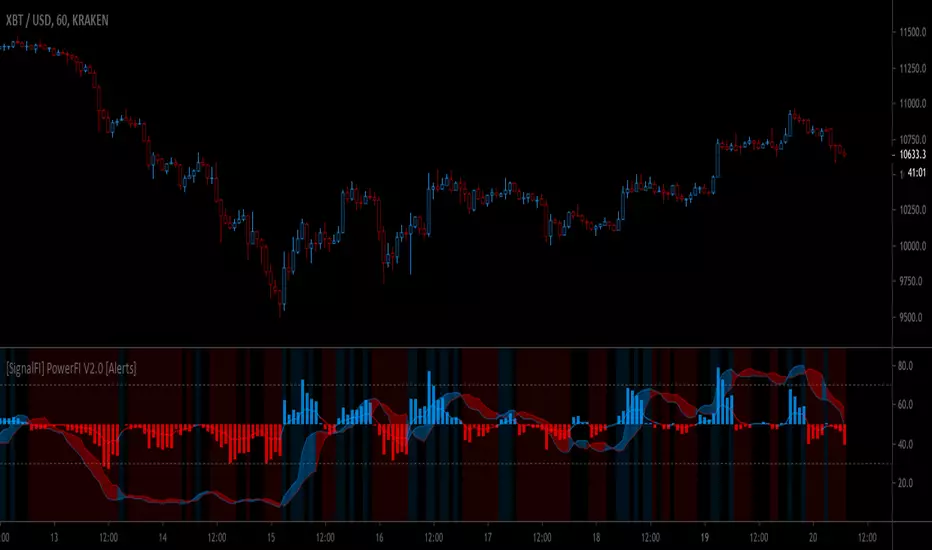
[SignalFI] PowerFI V1.0 [Alerts]PowerFI is a multidimensional RSI that gives you insight into price momentum and trend crossovers via price statistics and rates of change.
MUTLTIPLE-TIMEFRAME RSI
DIFFERENCE STATISTICS COMBINED WITH RSI MOMENTUM
RSI IMPULSE STRENGTH HISTOGRAM
ALERTS VERSION Only for Jedi and Master Subscribers
SignalFI was created to help traders and investors to effectively analyze the market based on the Golden Mean Ratio (Fibonacci numbers), plan a trade and ultimately execute it. To help inform and educate market decisions we developed a set of Trading Indicators which are available on TradingView , the most advanced and yet easy to use charting platform available on the web.
SignalFI indicators are just that, indicators. Our indicators are generally configured to use completely historical data (negating repaint), and we advise all alerts created with SignalFI indicators to be fired upon "close" of the current candle. Our indicators can provide valuable context and visualization support when performing market analysis and executing buy and sell decisions. However. we are not financial experts, and all information presented on this site or our other media outlets are for educational purposes only.
For subscription information, visit www.signalfi.net and follow us on twitter.
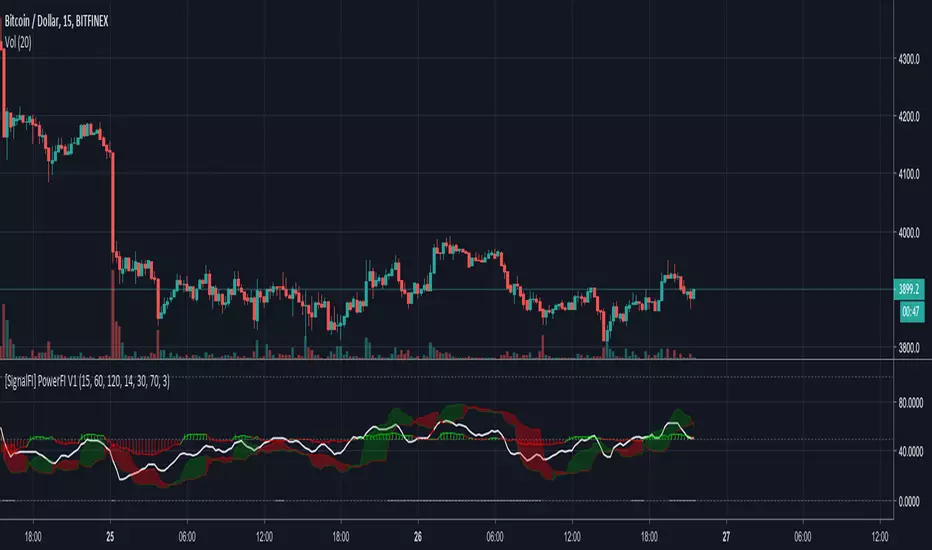
[SignalFI] PowerFI V1PowerFI is a multidimensional RSI that gives you insight into price momentum and trend crossovers via price statistics and rates of change.
MUTLTIPLE-TIMEFRAME RSI
DIFFERENCE STATISTICS COMBINED WITH RSI MOMENTUM
RSI IMPULSE STRENGTH HISTOGRAM
SignalFI was created to help traders and investors to effectively analyze the market based on the Golden Mean Ratio (Fibonacci numbers), plan a trade and ultimately execute it. To help inform and educate market decisions we developed a set of Trading Indicators which are available on TradingView , the most advanced and yet easy to use charting platform available on the web.
SignalFI indicators are just that, indicators. Our indicators are generally configured to use completely historical data (negating repaint), and we advise all alerts created with SignalFI indicators to be fired upon "close" of the current candle. Our indicators can provide valuable context and visualization support when performing market analysis and executing buy and sell decisions. However. we are not financial experts, and all information presented on this site or our other media outlets are for educational purposes only.
For subscription information, visit www.signalfi.net and follow us on twitter.
[SignalFI] - FutureFI V1 [Bitfinex - All Pairs][Alerts]FutureFI uses the futures (Long and Short) contracts housed on Bitfinex to provide a gauge for the relative difference and strength of interest in buying or selling Bitfinex assets based on total contracts created.
MUTLTIPLE-TIMEFRAME RSI FOR FUTURES CONTRACTS
DIFFERENCE STATISTICS COMBINED WITH RSI MOMENTUM
SIGNALS CAN BE APPLIED OUTSIDE OF BITFINEX
ALERTS VERSION Only for Jedi and Master Subscribers
Supported Assets:
LongAsset "BTCUSDLONGS","ETHUSDLONGS","XRPUSDLONGS","EOSUSDLONGS","LTCUSDLONGS","BTGUSDLONGS","ETPUSDLONGS","IOTUSDLONGS","ETCUSDLONGS","ZECUSDLONGS","NEOUSDLONGS","XMRUSDLONGS","ZRXUSDLONGS","OMGUSDLONGS","DSHUSDLONGS","BABUSDLONGS","BSVUSDLONGS","SANUSDLONGS","EDOUSDLONGS","TRXUSDLONGS","XLMUSDLONGS","BATUSDLONGS","VETUSDLONGS","SNGUSDLONGS"
ShortAsset "BTCUSDSHORTS","ETHUSDSHORTS","XRPUSDSHORTS","EOSUSDSHORTS","LTCUSDSHORTS","BTGUSDSHORTS","ETPUSDSHORTS","IOTUSDSHORTS","ETCUSDSHORTS","ZECUSDSHORTS","NEOUSDSHORTS","XMRUSDSHORTS","ZRXUSDSHORTS","OMGUSDSHORTS","DSHUSDSHORTS","BABUSDSHORTS","BSVUSDSHORTS","SANUSDSHORTS","EDOUSDSHORTS","TRXUSDSHORTS","XLMUSDSHORTS","BATUSDSHORTS","VETUSDSHORTS","SNGUSDSHORTS"
SignalFI was created to help traders and investors to effectively analyze the market based on the Golden Mean Ratio (Fibonacci numbers), plan a trade and ultimately execute it. To help inform and educate market decisions we developed a set of Trading Indicators which are available on TradingView , the most advanced and yet easy to use charting platform available on the web.
SignalFI indicators are just that, indicators. Our indicators are generally configured to use completely historical data (negating repaint), and we advise all alerts created with SignalFI indicators to be fired upon "close" of the current candle. Our indicators can provide valuable context and visualization support when performing market analysis and executing buy and sell decisions. However. we are not financial experts, and all information presented on this site or our other media outlets are for educational purposes only.
For subscription information, visit www.signalfi.net and follow us on twitter.
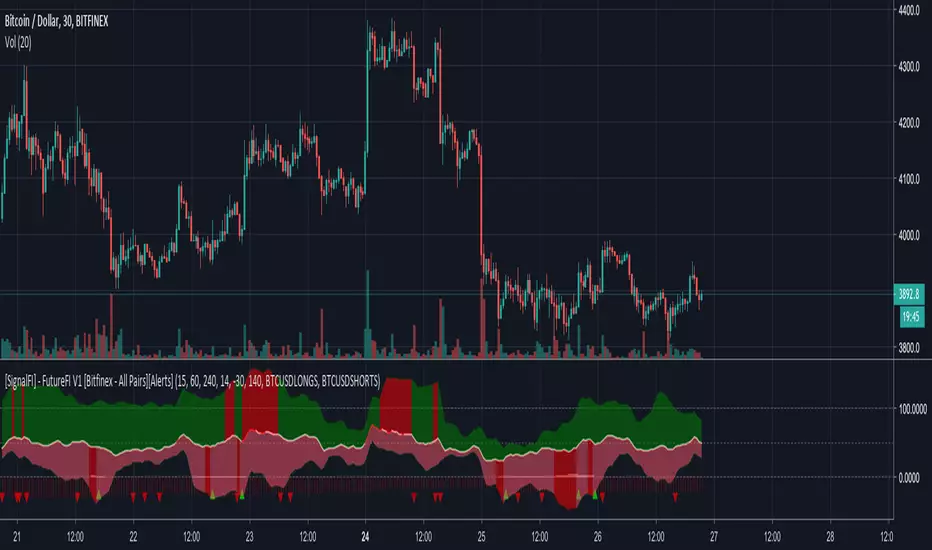
[SignalFI] - FutureFI V1 [Bitfinex - All Pairs]FutureFI uses the futures (Long and Short) contracts housed on Bitfinex to provide a gauge for the relative difference and strength of interest in buying or selling Bitfinex assets based on total contracts created.
MUTLTIPLE-TIMEFRAME RSI FOR FUTURES CONTRACTS
DIFFERENCE STATISTICS COMBINED WITH RSI MOMENTUM
SIGNALS CAN BE APPLIED OUTSIDE OF BITFINEX
Supported Assets:
LongAsset "BTCUSDLONGS","ETHUSDLONGS","XRPUSDLONGS","EOSUSDLONGS","LTCUSDLONGS","BTGUSDLONGS","ETPUSDLONGS","IOTUSDLONGS","ETCUSDLONGS","ZECUSDLONGS","NEOUSDLONGS","XMRUSDLONGS","ZRXUSDLONGS","OMGUSDLONGS","DSHUSDLONGS","BABUSDLONGS","BSVUSDLONGS","SANUSDLONGS","EDOUSDLONGS","TRXUSDLONGS","XLMUSDLONGS","BATUSDLONGS","VETUSDLONGS","SNGUSDLONGS"
ShortAsset "BTCUSDSHORTS","ETHUSDSHORTS","XRPUSDSHORTS","EOSUSDSHORTS","LTCUSDSHORTS","BTGUSDSHORTS","ETPUSDSHORTS","IOTUSDSHORTS","ETCUSDSHORTS","ZECUSDSHORTS","NEOUSDSHORTS","XMRUSDSHORTS","ZRXUSDSHORTS","OMGUSDSHORTS","DSHUSDSHORTS","BABUSDSHORTS","BSVUSDSHORTS","SANUSDSHORTS","EDOUSDSHORTS","TRXUSDSHORTS","XLMUSDSHORTS","BATUSDSHORTS","VETUSDSHORTS","SNGUSDSHORTS"
SignalFI was created to help traders and investors to effectively analyze the market based on the Golden Mean Ratio (Fibonacci numbers), plan a trade and ultimately execute it. To help inform and educate market decisions we developed a set of Trading Indicators which are available on TradingView , the most advanced and yet easy to use charting platform available on the web.
SignalFI indicators are just that, indicators. Our indicators are generally configured to use completely historical data (negating repaint), and we advise all alerts created with SignalFI indicators to be fired upon "close" of the current candle. Our indicators can provide valuable context and visualization support when performing market analysis and executing buy and sell decisions. However. we are not financial experts, and all information presented on this site or our other media outlets are for educational purposes only.
For subscription information, visit www.signalfi.net and follow us on twitter: @signalfi_

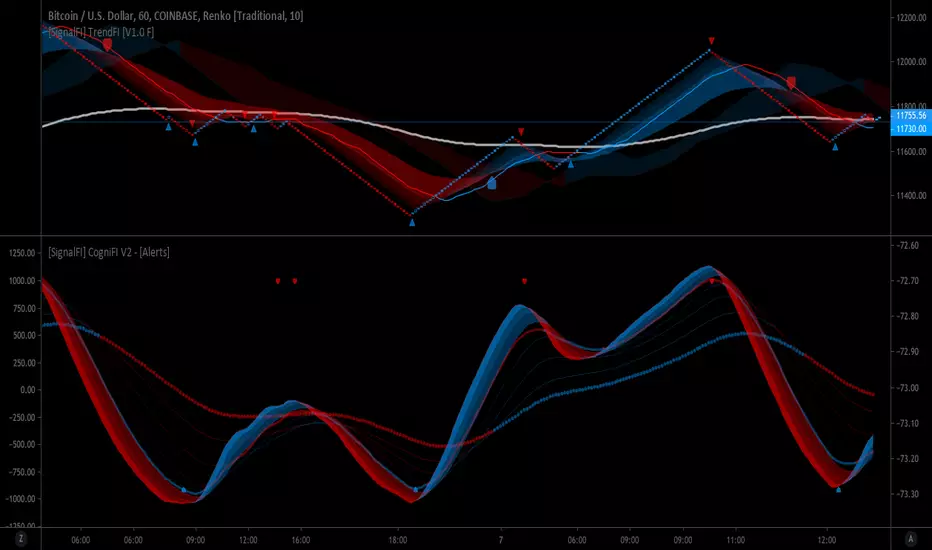
[SignalFI] CogniFI V1 - [Alerts]CogniFI uses 8 independent Fibonacci based inputs to calculate a unified Center Of Gravity (COG) and RMA or RSI based moving average created by J. Welles Wilder.
FIBONACCI BASED TREND AND MOMENTUM DISCOVERY
RSI BASED MOVING AVERAGES COMBINED WITH CENTER OF GRAVITY (COG)
COLOR BASED TREND SMOOTHING FOR INDICATOR SIGNAL
SignalFI was created to help traders and investors to effectively analyze the market based on the Golden Mean Ratio (Fibonacci numbers), plan a trade and ultimately execute it. To help inform and educate market decisions we developed a set of Trading Indicators which are available on TradingView , the most advanced and yet easy to use charting platform available on the web.
SignalFI indicators are just that, indicators. Our indicators are generally configured to use completely historical data (negating repaint), and we advise all alerts created with SignalFI indicators to be fired upon "close" of the current candle. Our indicators can provide valuable context and visualization support when performing market analysis and executing buy and sell decisions. However. we are not financial experts, and all information presented on this site or our other media outlets are for educational purposes only.
For subscription information, visit www.signalfi.net and follow us on twitter: @signalfi_
MACD + Stochastic + RSI StrategyMy strategy uses a combination of three indicators MACD Stochastic RSI.
The Idea is to buy when (MACD > Signal and RSI > 50 and Stochastic > 50) occures at the same time
This strategy works well on stocks and cryptos especially during market breaking up after consolidation
The best results are on Daily charts, so its NOT a scalping strategy. But it can work also on 1H charts.
The strategy does not have any stops and profit targets, so we can take all the market can give us at the moment.
The exit point only when MACD goes under Signal
Its Preformance is quite stable.
So, use it, trade it.
If it will help you to imprive your trading results, please donate me
BTC: 12kd1F8buWisUBdq27BBwRkUvzW7Ey3og5

Directional Indicator Strategy v1.2ADX Trading Strategy , using
ADX, D+ and D-
RSI
Historical Volatility
Hull Moving Averange for the price trend
Stop-loss
The Strategy Report is based on 10.000 USD initial investment without pyramiding, starting on januari the 1st 2018, on a 1D time frame. Taking in account a 0.2% Commission fee per trade.

RSC Trend Trading Strategy v1.0Ready Set Crypto Trend Trading Back-testing Strategy v1.0
This is a backtesting strategy for those who are familiar with Doc Severson's (Ready Set Crypto) Trend Trading Class offered at Ready Set Crypto . It is published with permission.
I highly recommend that you attend the class to understand this strategy and use this to your advantage. There is way more than just some indicators to utilise this trading strategy successfully.
Please also see the matching indicator for this strategy: Ready Set Crypto Trend Trading Indicator .
Buy and Sell Calls are based on the following:
An Upper Donchian Channel of 20 days (default) or more, used to indicate buy signals
A Lower Donchian Channel of 10 days (default) or more, used to indicate exit signals
A 50 day Simple Moving Average (for entry filtering)
A 200 day Simple Moving Average (for entry filtering)
How to do back-testing with this:
Once you add this strategy to your chart, go to the " Strategy Tester " section at the bottom of the screen to see it's performance.
You will need to configure the strategy (just like you'd configure any indicator) to tailor it to your specific scenarios.
Note following:
TradingView does not support BTC, ETH, etc as currencies, so BTC and other trading pairs are not available for back-testing; You will have to use USD pairs
The backtesting will apply to your chart's time frame (candle times) - use daily time candles as the starting point
You will need to tailor the " Input " and " Properties " options (click on the little gear icon) to adjust to suit your needs/scenarios
The default settings are as follows:
Backtest the current chart/ticker for the period of 2016 to 2020,
With a single position of US$1000 and a 0.1% commission (no pyramiding, i.e. multiple buy entries),
By entering a single position (buy) when the price is above SMA 50 and 200 and a candle high touches DC 20,
And exiting the position when a candle low touches DC 10.
Look under the " Strategy Tester " pane for the back-testing overview, performance and list of trades. Or if you are looking at the Published Idea , the back-testing results are displayed at the bottom of the page.
Please like, Share and Comment, if you like this indicator.
Warning
The Buy and Sell calls are meaningless and must not be auctioned without a thorough understanding of this trading strategy and the full consideration of the entry and exit conditions.
Please use this indicator at your own risk. The publisher does not accept any responsibility for its performance or any implications.

CRYPTONYY TRADING MACHINEThia script will automatically gives you long and short signals.
WORKS ON ALL EXCHANGE.
SUITABLE FOR BITMEX TRADING.
FOR ALTCOINS TRADING GO FOR 30MIN OR ABOVE 30MIN TIMEFRAME.
AUTOMATIC STOP LOSS TRIGGER.
MORE NEW UPDATES COMING!!!

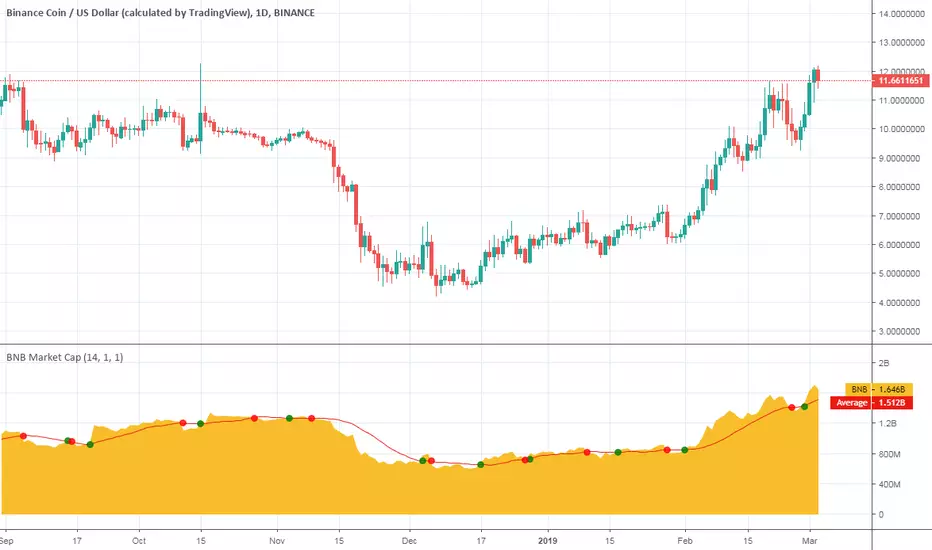
Binance Coin Market CapHey there!
This is Binance Coin market cap with some additional features.
Consider it as my Christmas gift to the community.
What is included
Dynamic market capitalization chart
Customizable SMA of the market capitalization
Crossovers highlighting
You can set alerts for crossovers
Alert for the specified positive % change
Alert for the specified negative % change
NOTE : The word "Dynamic" means that I did not hardcode the supply of the presented coin. You can check it over time.
Good luck and happy trading!
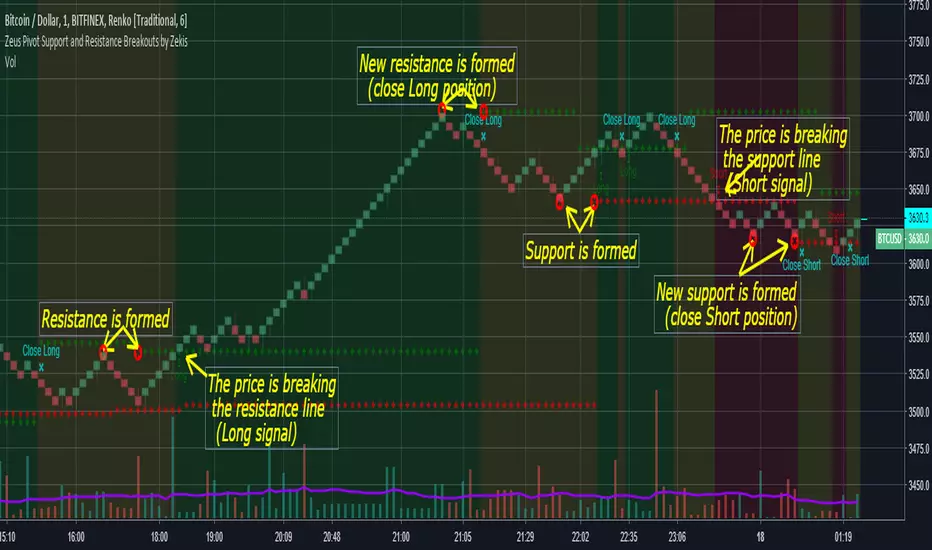
Zeus Pivot Points Support and Resistance Breakouts by ZekisZeus Pivot Support and Resistance Breakouts by Zekis
Is an indicator with big results, it forms new support /resistance according to the last higher high or lower low (it prints new ones only if it breaks through the last one)
Rules:
- enter Long or Short when the support or resistance is craked
- exit when new support or resistance is starts to form
Alerts for entries and exits
A moving average is added to filter signals (leave it at 1 for price close signals)
Bar colors can be added to see longs, shorts or no position
Background colors for longs, shorts or no position
Enjoy!
@Zekis