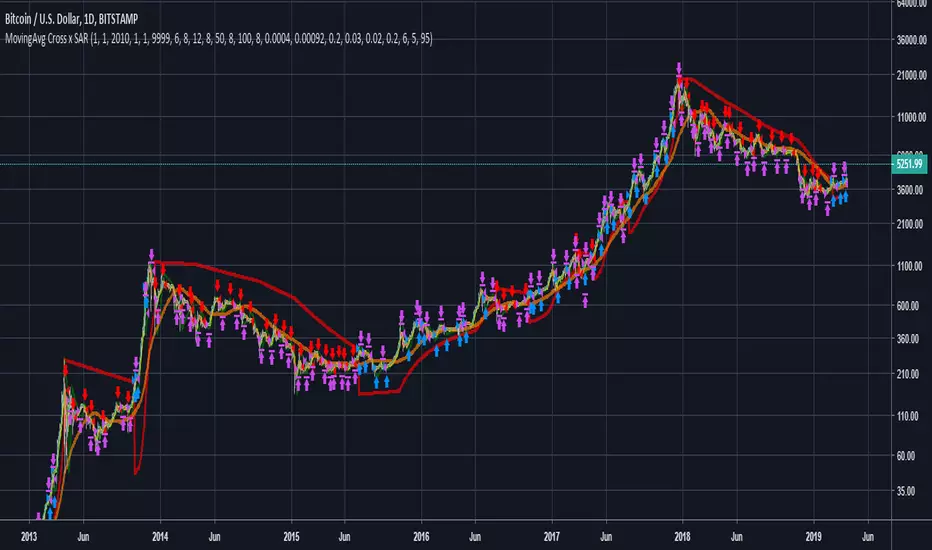
MovingAvg Cross x SARSimple yet powerful strategy to use on cryptomarkets.
I recommend use up to 2-3x leverage in order to prevent liquidations. The results will be much better than backtest if you do so.
Working timeframes are 1d and 4h , but you can test it anywhere. Set time interval in settings to avoid >3000 orders.
Feel free to add this to your favorites and use it on your own risk.
The best markets are BITMEX:XBTUSD , BITSTAMP:BTCUSD , BINANCE:XRPBTC and BITFINEX:ETHUSD .
If you found this helpful please donate and I will develop more interesting things:
BTC: 3BMEXi9EU5SRmiSxXFdTRVCpDXQeP8KMis
ETH: 0xc4ce227a1c8586794e07ca378c04a64ba6bb2387
Ethereum (Mata Wang Kripto)
UltraInstintoTraderthe ultra instinct trader is the most powerful tool basedin the ultimate form of goku, u can use this script to do very fast trading also binary options and get a lot of profitttt

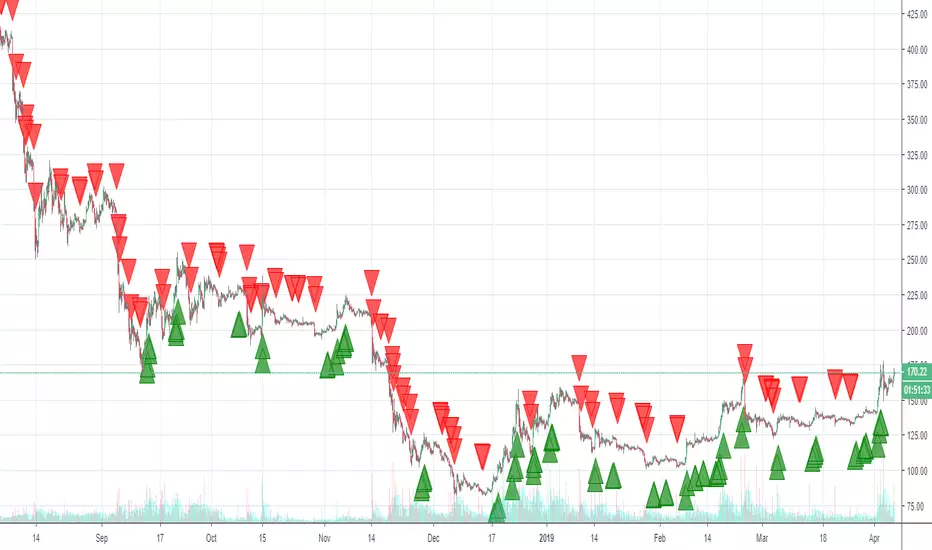
LOTUS Ethereum TraderThis indicator is designed only for trading ETH/USD and ETH/USDT on the 2hr heikin ashi chart.
How to use: This indicator waits for confirmation and paints a bull (green triangle) signal when it expects an uptrend. It will also paint a bear (red triangle) when it expects a downtrend. You can also set alerts for this indicator.
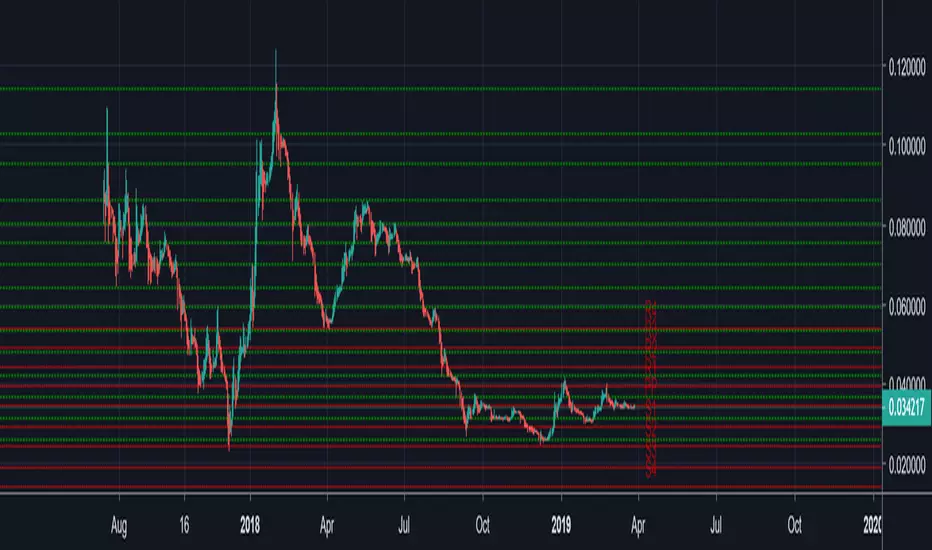
Auto FIB v1Auto FIB indicator defects automatically high and low for the coins and created Fib lines.
I would greatly appreciate if you could leave feedback on this indicator.
if you like this indicator, I would greatly appreciate if you can donate for the hard work.
BTC - 138yXLNU2CJBuTJ9tBYkKBcv1wC17VN2RV
ETH -0x435a32d7F1383626F271eE9f999d18b83453BF80
LTC - LcsfSCsRDqPWxH7vC5wMGJXh8x3bfKvvZj
ETC - 0x3f6cAfdc0544a34DdC0E0fd4908C68Ec6a803708
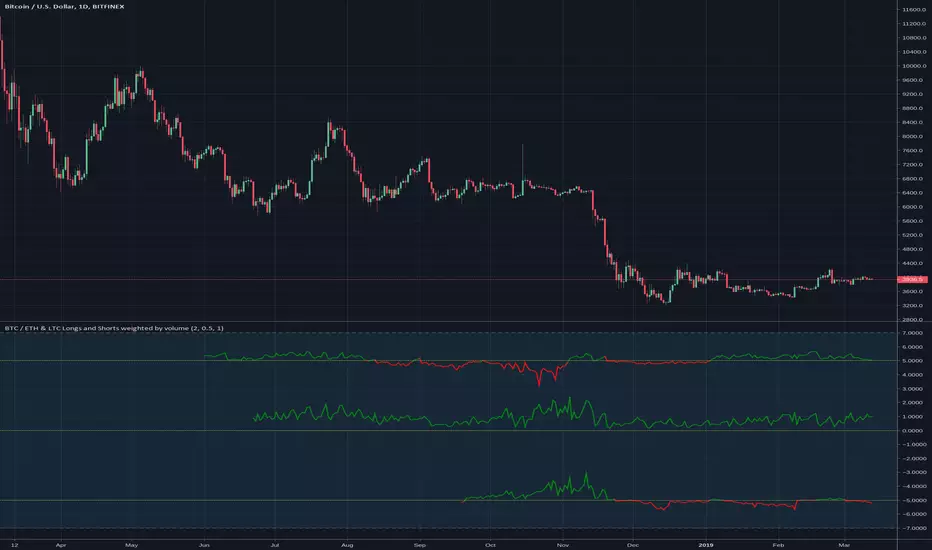
BTC / ETH & LTC Longs and Shorts weighted by volumeMy personal crypto market breadth.
The long and short contract come from Bitfinex, the daily volume for weighting is used from four different exchanges to average the result.
A line above the center line means more open long contracts (green) than open short contracts (red).
The upper indicator shows BTC ratio, the middle one ETH and the lower one LTC.

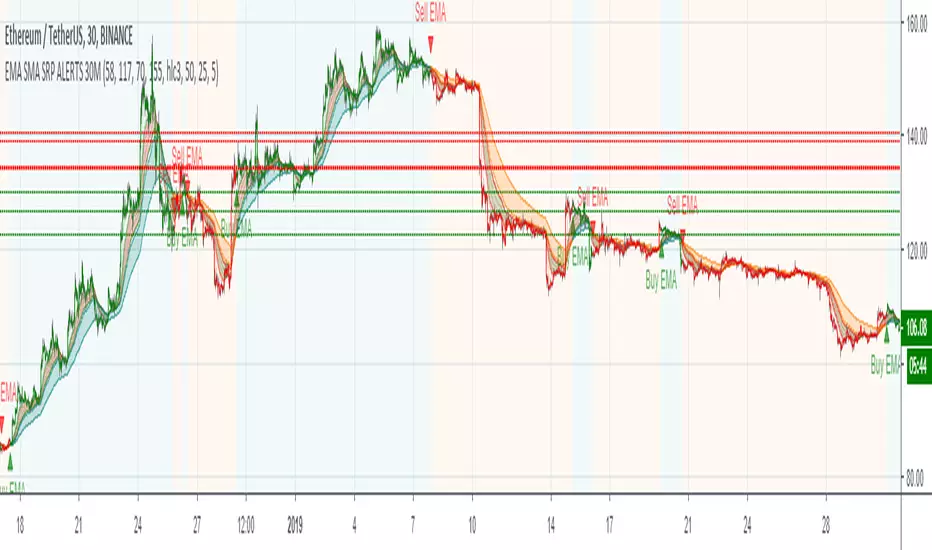
EMA SMA SRP ALERTS 30MThe Alerts is based on indicators:
Exponential Moving Average ( EMA )
Simple Moving Average ( SMA )
Support and Resistance Levels
Allows to find entry/exit points
Adapted for:
Chart: 30 minutes
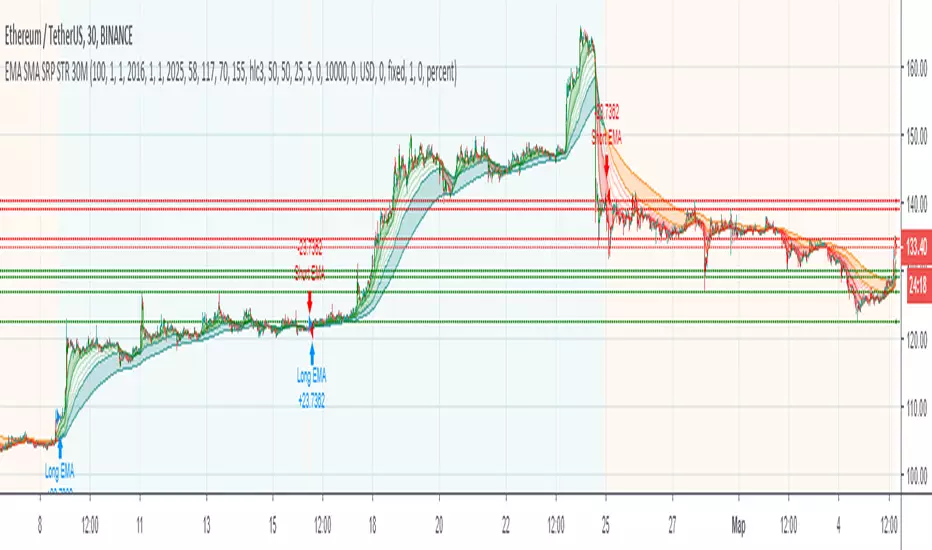
EMA SMA SRP STRATEGY 30MThe strategy is based on indicators:
Exponential Moving Average (EMA)
Simple Moving Average (SMA)
Support and Resistance Levels
Allows to find entry/exit points

+1200% Mr. Benedict ETH/USD 2H Strategie öffentlichDies ist eine Probe des Mr. Benedict ETH/USD 2H Bot.
Diese Strategie wurde nur für ETH/USD 2H entwickelt und sollte nur dort angewendet werden.
COINBASE:ETHUSD
Es kann frei am Zeitraum herumgestellt werden, um vergangene Ergebnisse zu überprüfen.
Ergebnis in 2018 ist zum Beispiel 1200%
Für den Kurs sollte Coinbase genutzt werden, da Bitmex erst Daten seit August 2018 hat und Bitfinex falsche Ergebnisse erzeugt.
Die Strategie geht von einer Investition von 100% des Kapitals aus und Gebühren sind bereits abgezogen (0,075% Bitmex)
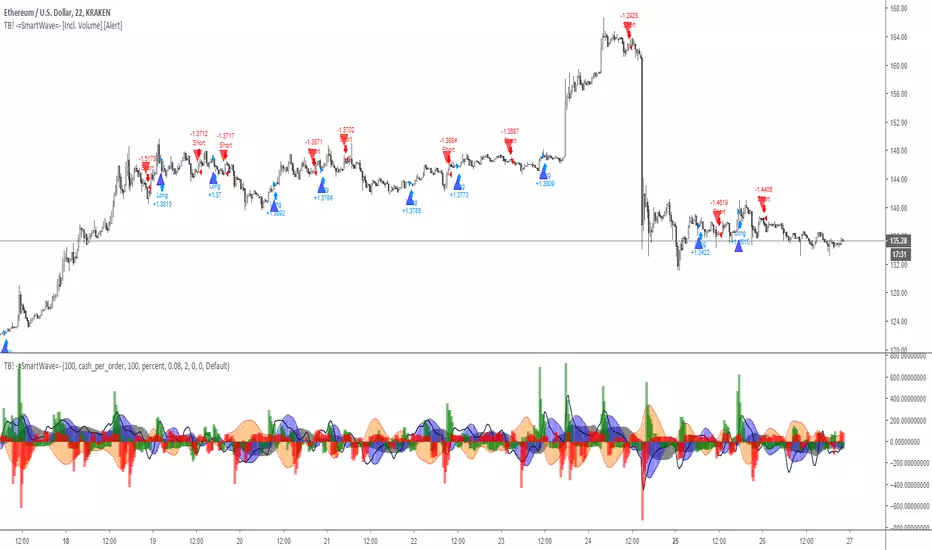
TB! -=SmartWave=- [Incl. Volume]My Precious SmartWave Formula Ready for Action.
What does it do?
It monitors buys vs sells, since the market moves because people buy n sell,i kinda thought it would be important.
It also monitors price action in relation to that volume to determine if a lot of volume is gobbled up by (over-) leveraged positions.
It provides a good insight when to take some action.
NB.
The drawback and the losses it makes can be reduced a lot with a 2.5% stoploss and fib based TP's, i just did not care to have the script deal with those,
ETH HawkEye Aggregated Volume IndicatorThis is combined Aggregated ETH Exchange Volume by Neobutane with HawkEye volume clone indicator by LazyBear.
Indicator includes aggregated raw ETH volume from 7 user selectable fiat and tether exchanges on USD, USDT, BTC, EUR, GBP, JPY pairs + Exponential MA + hawkeye bar coloring where: green is bullish volume , red - bearish and white - volume neutral to the market:
Bitfinex
Coinbase
Bitstamp
Kraken
Binance
Poloniex
Bittrex
*There is a TV bug that doesn't display a whole volume history if some pair was added later than date intended to be analysed by operator eg, if you want to watch older data you should exclude all secondary pairs that were added later and switch off "newer" exchanges like Binance.

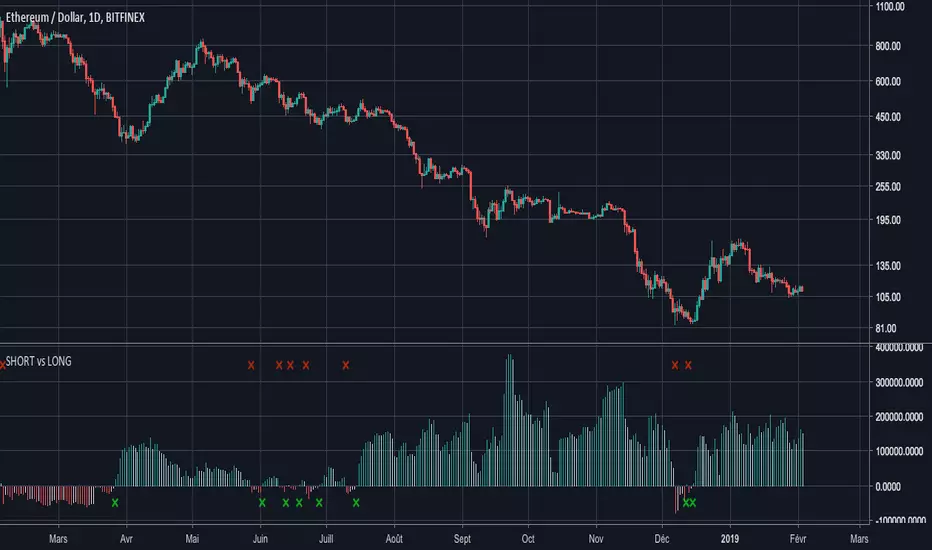
ETHUSDSHORTS - ETHUSDLONGS : balance of powerHello everyone,
I noticed that many people try to compare SHORTS and LONG positions (see:ETHUSDSHORTS and ETHUSDLONGS ), and the available indicators don't sufficiently highlight the balance of power .
That's why I programmed this indicator to answer this need ( which I also have ! ).
His ETHUSDSHORTS - ETHUSDLONGS crossover indicator e of power
I think you will understand quickly how it works, it's easy :
- If the histogram is negative, the color is red and that means that there are more BTCUSDSHORTS than ETHUSDLONGS
- If the histogram is positive, the color is green and that means that there are more ETHUSDLONGS than ETHUSDSHORTS
A small cross (red or green) appears when the power balance is reversed.
Have a good day.
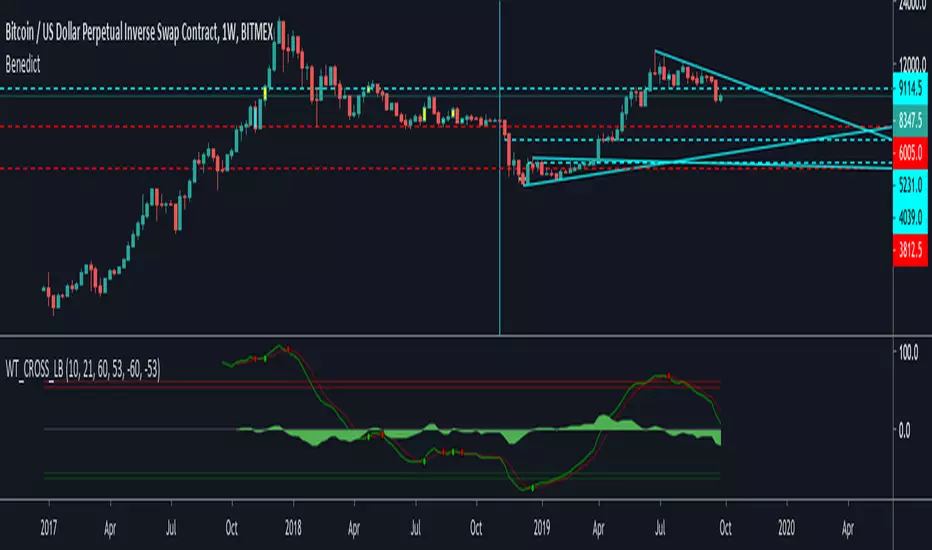
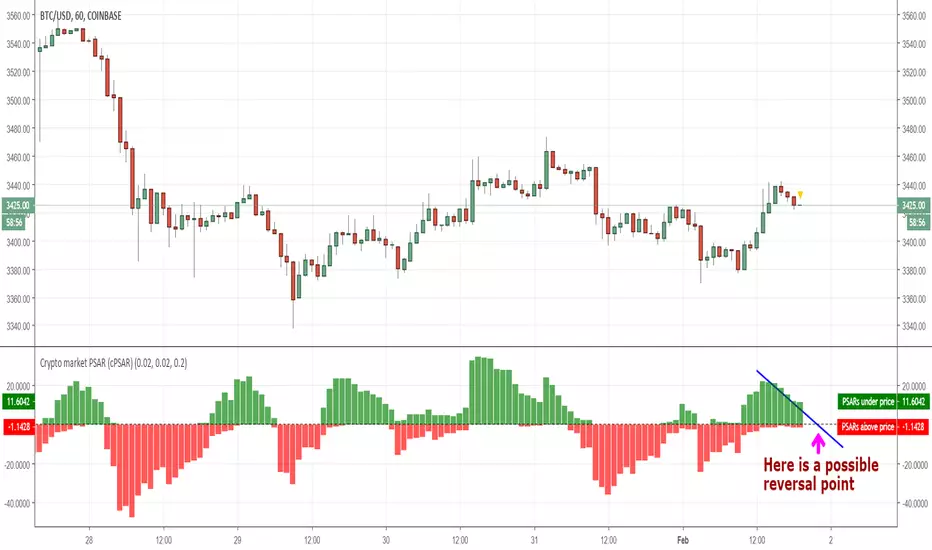
Crypto market PSAR (cPSAR)This indicator calculates the PSARs of the most liquid cryptocurrencies (as percent differences from the prices) and sums them together.
The PSARs under the closes, which act as support, are summed separately and shown in green. The PSARs over the closes (acting as resistance) are summed separately and shown in red.
The result is an indicator which can be interpreted somewhat like the RSI (but keep in mind that PSAR is a lagging indicator unlike the RSI which is a leading indicator). By interpreting this correctly you can - SOMETIMES - predict the short-term turns of the entire crypto market.
Many traders use the prices shown by PSAR (Parabolic Stop And Reverse) to set stop loss prices and/or to take profit and reverse their positions. This is why, on reversal of the PSARs (= when one of the red or green values becomes visibly larger than the other), a strong turning of the market can, sometimes, occur.
ASX300 Golden Cross stock alerts (A2M-ANZ)Golden Cross happens when the SMA50 crossover the SMA200, which usually signals profitable bullish trend and good buy entry. For example, for Aurelia Metals the Golden Cross buy signal had 250% buy and hold profit in about a year.
This indicator hunts for the Golden Cross of the first 20 stocks in the ASX300 (A2M to ANZ), once it it happens the indicator plots the name of the stock that had Golden cross which could be use as entry for that stock. As you can see various stocks were plotted in the chart, those had crossedover at the time of plotting.
Due to TradingView Pinescript limitations, only 20 stocks can be watched in one indicator. Therefore 15 Golden Cross indicators are required to watch the entire ASX300.
This can also be applied to crypto coins with some adjustments in the script, so you can be alerted of the Golden Cross in crypto coins and buy bullish coins.

Lazy Trend System 2019latest, more powerful and applicable on FX, indices, stocks and cryptocurrencies!

Oscillator Strategy for Scalping (BITMEX Swaps btc + eth)This is short selling strategy for BITMEX's XBTUSD and ETHUSD swaps scalping.
Made specifically for 3M XBTUSD and 3M-5M ETHUSD timeframe trading.
Not gonna open all the details, but it works mostly on bear divergences and moving averages.
On premium it shows 10000 bars back on 3minute timeframe and over that period(3 weeks aprox) XBTUSD had 28 trades and ETHUSD had 25(+17 on 5M timeframe) trades with that strategy.
How to trade it and setups that i use for manual trading:
1: You can use it to confirm your bias. Sell signal appears + price tries to retake previous resistance = most likely it will fail.
2. Sell signal after wick up suggests that you are likely to get filled at the top.
Your main target should be this moving average. Basically sell signal appears at resistance/near one and moving average represents current line of support. So when you enter short you should be eyeing this MA as your exit/target. Yes, there is a good possibility that support wount hold and this is a bear market we talking about BUT it is 3M bot oriented trading strategy, dont forget about and dont hold for too long to find yourself with price lending on MA and jumping from it.
This strategy does not have a defined stop, rather it suggests you to calculate it based on entry (provided) and target (provided).
Here is what i usually do to calculate my risks. My reward is a move to line of support, my stop is usually 1R, winrate is much higher than 50% so i feel good about it. Entry either at sell signal or at wick. Wicks not always get runned, but they provide incredible r/r setups.
Free trial for 36 hours for this one.

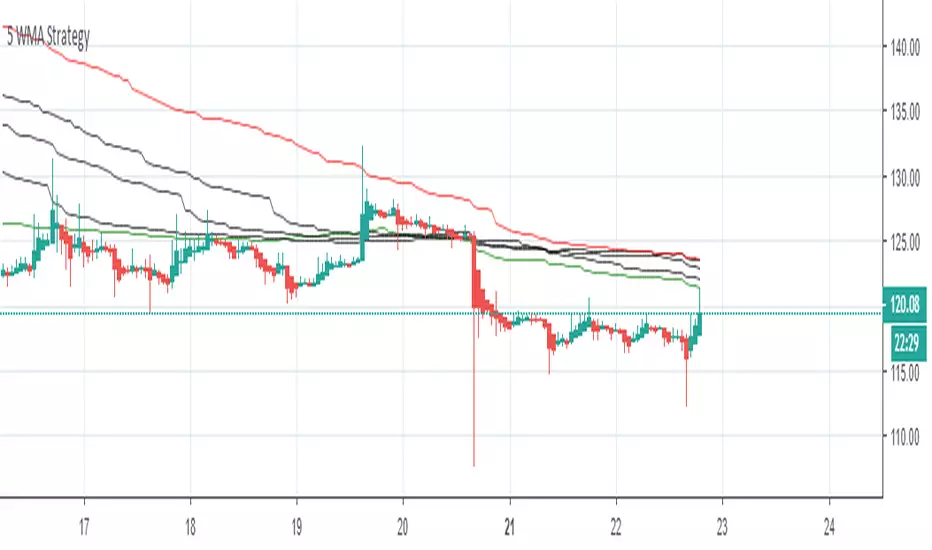
5 Weighted Moving Averages Strategy for Trend Analysis This indicator was made to allow Five WMA to be displayed without needing to use up 5 charting indicators individually
This is best Indicator for Support and Resistance, If GREEN line is on TOP market Bullish
If RED line is on Top Market is Bearish ,
Entry and Exit place Long and Short orders on Lines According to Trend
For more info contact : rohitworkss@gmail.com
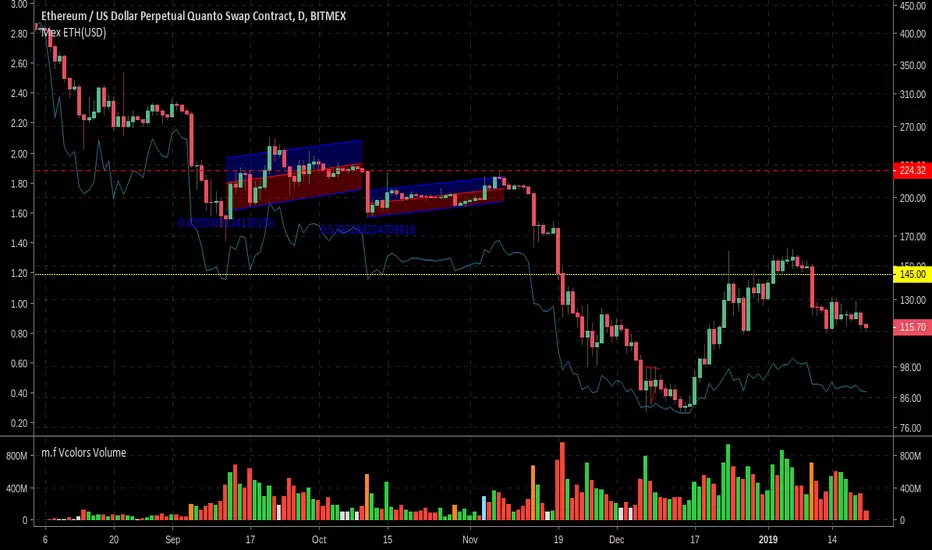
BitMEX ETHUSD contract value (USD)The ETHUSD Quanto Swap contract on BitMEX allows you to trade ETHUSD with Bitcoin put forward as collateral. However this means that 1 contract is not equal to 1 USD or 1 ETH, but instead varies according to the price of ETHUSD.
You can see the contract specs here www.bitmex.com and find more information here blog.bitmex.com
My advice is always to make sure you fully understand a derivative product before you trade it, however many of us may not have the acumen to actually understand how a quanto swap works. Nevertheless, we have to be aware that the value in USD of each contract depends on the price of Ethereum and also the price of Bitcoin at each point in time.
This tool will show you the value of a single ETHUSD contract in USD, but it solely for indicative purposes only. Your trade, your risk. I do not ask for any donations from your gains and I am not liable for any of your losses.
Source code is provided.
Note in the example image that the price of ETHUSD is plotted on a logarithmic scale but the indicative contract value is linear.
CB Signals - Holla-724 BITMEX ETH/USD Long/Short (PAID ALGO)This algo uses a number of strategies developed from 7 yrs of trading this concept in the FX markets. I have modified it for Leverage trading on BITMEX exchange.
You may view detail summary of live performance of this Algo dating from Jan 1st 2018 - Jan 17th 2019 (In one of Crypto's worst bear markets) below by clicking the "Performance Summary" Tab:
To signup for this algo please visit the link below:
www.cryptoblood.io

RSI + Stochastic RSI Indicator CombinedFree to use RSI and Stochastic RSI, combined within one indicator.
The RSI and Stochastic RSI are two of the most commonly used and respected indicators in trading technical analysis. By placing them on top of each other you can save valuable space on your chart and stay more easily within your TradingView indicator limit.
The RSI is bright blue, with the "neutral" 30-70 chart area shaded blue.
The Stoch RSI is red and blue, with the "neutral" 20-80 chart area shaded purple.
None of the other annotations shown above will appear, they are only to demonstrate how they can be interpreted.
So what does the RSI do?
Broadly speaking, the Relative Strength Index measures the strength and movements of a market.
Above 70 the RSI is considered oversold = an increased likelihood of an incoming price drop.
Below 30 the RSI is considered undersold = an increased likelihood of an incoming price rise.
What does the Stochastic RSI do?
Broadly speaking, the Stochastic RSI measures the momentum of a market. It does this by measuring the RSI relative to its own high/low over the previous period.
Above 80 the Stoch RSI is considered oversold = an increased likelihood of an incoming price drop.
Below 20 the Stoch RSI is considered undersold = an increased likelihood of an incoming price rise.
Look for when the two Stoch RSI lines cross over - it is an important signal.
When the blue line is on top we have momentum driving the price up; when the red line is on top we have momentum driving the price down.
The key here is to look for periods where both the RSI and Stoch RSI are both low at the same time (especially on the daily chart) = an extremely promising entry point to catch a move up. Equally, looking for periods where both the RSI and Stoch RSI are very high is likely a good exit point (or at least a time to make absolutely certain you have a suitable stop-loss in place), because a price drop is likely not far away.
Remember: the Stoch RSI does not always fluctuate cleanly between the top and bottom. At any time it can change direction to reflect market conditions, which is why a stop loss is essential at all times. Equally, just because the RSI or Stoch RSI is at 100, it is still possible for it to keep going up due to whale action or traders FOMOing in. The same applies at low levels. Both these indicators represent historical data and therefore are not strictly predictive in nature, but show trends that may be in action.
Please give me a thumbs up and follow me if you found this useful. This tool is for educational purposes only and not a recommendation to buy or sell. Always do your own research before trading. Make sure to add this to your favourite scripts.
Best wishes,
BCryptological
ps - combine this powerful indicator with knowledge of strong support and resistance points with the 50/100/200 Moving Average . This will help you identify likely entry/exit points to maximise the accuracy of your predictions.
