Multi Time Frame Buy&Sell V4.0 [BACKTEST]Hi guys,this indicator Developed for Intraday and multi Time Frame Trading. Note: Invite only Script.Request to me Access permission to test this.
*** THIS IS STUDY VERSION ***
Time Frame : can use for 15 min / 30 min / 1h / 4h time
15 min configuration is best result for bitcoin and ethereum .
This can be used : Crypto Currency/ Bitcoins / ethereum ,Forex,currencies ,Index ,Commodity Gold / silver , Oil Market and in Equity / Futures
ETHUSDT Futures 15min
BTCUSDT Futures 15min:
GOLD /USD FOREX 15min:
HOW IT WORKS:
this indicator analyze EMA&SMA support and resistance then combine with pivot point and fibo levels is used to calculate the signals.and finally show entry label on
chart with target point and stop loss
HOW TO USE:
Creating a signal is as simple as adding the indicator called to your chart(buy or sell)label and background color change ( green=buy / red = sell)
green line is target and black line is stop loss.
in top of setting page you can see noise filter option . that can change it to get better result and reduce noise. in setting can set 3 target level and stoploss
NOT:all information show to info panel in chart.
strategy tester : enabled .All you can test this in live market in any segment.
NOT: can to change noise filter in setting setup until to get best result.
Choose any Date Month Year to Current Date and check the results below in the Strategy Tester.
REPAINT/NO REPAINT : No Repaint ,entery labal(buy or sell) and Background Color wont change. In the current candle position wait for the candle to close to see the
stability.
"Set alert": Select "Once per bar close" for your alert options.
There are 5 alerts:
- BUY
- SELL
- BUY OR SELL (for free TV users)
- take profit
- stop loss
Review and Feedback.Thank you!
Any issues report to me to Fix.Thank you!
how To Get access : Use the link below to obtain access to this indicator or PM us to obtain access.
Ethereum (Mata Wang Kripto)

Bitcoin Top Finder by DataDaterBitcoin Top Finder is an indicator that detects the absolute top of BTCUSD in each bull cycle (red line). It is also helpful in detecting bottoms of cycle (blue). It is based on cost of electricity and mining hash rate.
If you'd like access to this script, please send me a direct message.

Multi Time Frame Buy&Sell V4.0 [ALERTSETUP]Hi guys,this indicator Developed for Intraday and multi Time Frame Trading. Note: Invite only Script.Request to me Access permission to test this.
*** THIS IS STUDY VERSION ***
Time Frame : can use for 15 min / 30 min / 1h / 4h time
15 min configuration is best result for bitcoin and ethereum .
This can be used : Crypto Currency/ Bitcoins / ethereum ,Forex,currencies ,Index ,Commodity Gold / silver , Oil Market and in Equity / Futures
ETHUSDT Futures 15min
BTCUSDT Futures 15min:
GOLD /USD FOREX 15min:
HOW IT WORKS:
this indicator analyze EMA&SMA support and resistance then combine with pivot point and fibo levels is used to calculate the signals.and finally show entry label on
chart with target point and stop loss
HOW TO USE:
Creating a signal is as simple as adding the indicator called to your chart(buy or sell)label and background color change ( green=buy / red = sell)
green line is target and black line is stop loss.
in top of setting page you can see noise filter option . that can change it to get better result and reduce noise. in setting can set 3 target level and stoploss
NOT:all information show to info panel in chart.
strategy tester : enabled .All you can test this in live market in any segment.
NOT: can to change noise filter in setting setup until to get best result.
Choose any Date Month Year to Current Date and check the results below in the Strategy Tester.
REPAINT/NO REPAINT : No Repaint ,entery labal(buy or sell) and Background Color wont change. In the current candle position wait for the candle to close to see the
stability.
"Set alert": Select "Once per bar close" for your alert options.
There are 5 alerts:
- BUY
- SELL
- BUY OR SELL (for free TV users)
- take profit
- stop loss
To Get access - Send me a private chat message in tradingview.com to get access.Or request in comment section below.
Review and Feedback.Thank you!
Any issues report to me to Fix.Thank you!
Use the link below to obtain access to this indicator:

NB OptimusPrime2Hello Everyone,
Welcome to NB Optimus Prime 2.
This is an educational indicator that makes two colorful calls in your chart thus :
Red = Bear
Green = Bull
The calls are meant to indicate potential downtrends and uptrends respectively.
The signals are made based on aggregated Index prices and moving averages which are then smoothened out. Volume is used to gage momentum of the trend which is then shown by colors on the candle stick. This indicator is best used in combination with other traditional indicators i.e MACD , RSI and other tools that are available on TradingView.
Even though this indicator was designed with Cryptocurrency in mind, it can also be used for Stocks and Forex. I created this for my crypto community as a way to introduce them to trading with indicators.
It should be noted that this indicator should not be considered financial advice in any way or form. This is just an indicator. Please use it responsibly.
PM me to obtain access to this indicator and I will be happy to help you.
BTC & ETH Alert SystemWith Tradingview's free plan, only one alert is allowed. The purpose of this indicator is to allow for two alerts--one for BTC and one for ETH.
How to use the alert system:
1. Set the desired value for BTC and ETH that you want to be alerted for
2. Set an alert on the indicator by clicking the three ellipses and then "Add Alert"
3. Set the alert to go off if the value of the indicator is greater than 0.
The example is of BTC using an alert of $10,000 and an alert of ETH at $2,000 (untriggered)
The script can be easily modified to be used for different assets

[astropark] DMI/ADX strategy [strategy]Dear Followers,
today I'm happy to share with you my DMI / ADX Strategy .
It provides directional trend information, so if a bullish or a bearish trend is going to start. Statistically it works better on lower timeframes (from 5 minutes to 1 hour).
It is both a Swing and Scalping Strategy indicator , based on a simple trend following theory , good for trading FOREX, Indexes, Stocks, Commodities and Cryptocurrencies.
To help in Taking Profits, the strategy integrates 2 special other than bull/bear signals:
Overbought and Oversold RSI Signals , which appear both as darker background (the darker the color, the more the price is in overbought/oversold) and green "ob"-"tp" / red "os"-"tp" labels (they optionally pop up only on a configurable stronger overbought/oversold condition) (you can enable/disable it optionally)
Peak Profit Tracker , which resets every time a new trade starts and keeps track of price fluctuation during the trade: the message is don't be too greedy and take profits or lock them with a stoploss in profit (you can enable/disable it optionally)
You can edit many options in order to
have more/less bull/bear signals
enable/disable showing bull/bear signals
enable/disable showing RSI TP signals (you can edit RSI length, overbought (OB) and oversold (OS) levels)
enable/disable showing peak profits on each trade
The user who wants to use this strategy, especially via an automated bot, must always set a stoploss (example 150$ from entry on bitcoin ) or use a proper risk management strategy .
This is not the "Holy Grail", so use it with caution. It's highly suggested to use a proper money management .
This script will let you backtest performance of the indicator based on bear/bull signals.
You can find the alarms version by searching for my DMI / ADX Strategy and choosing the "alarms" named.
Here there are some examples how this DMI / ADX strategy works on many markets:
LTC/USDT 15m
BTC/USD 15m
BNB/BTC 15m
ETH/USD 15m
GOLD (XAU/USD) 15m
GOLD (XAU/USD) 1h
FB 15m
AAPL 15m
TSLA 1h
BANKNIFTY Index 5m
NIFTY 50 Index 5m
This is a premium indicator , so send me a private message in order to get access to this script .

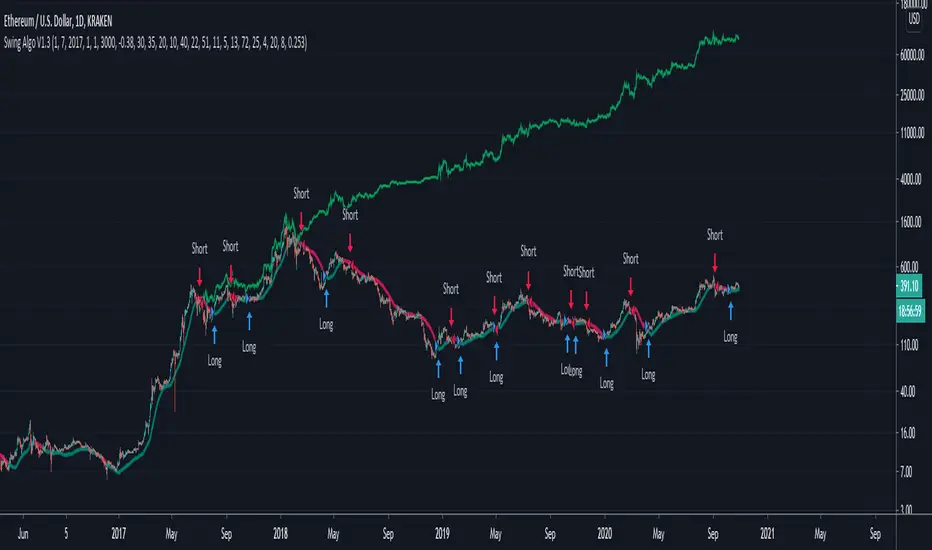
Swing Algo V1.3An upgrade of Swing Algo V1.2 to reduce chop heavily, used for trading ETH. For differences to other versions, see below.
This indicator can be used for e.g. swing algorithmic trading. It will give Buy/Long and Sell/Short signals on the chart. This algorithm uses a combination of several (custom) functions and rules to find good entry points for trend trading. After many iterations and tests I came up with this particular setup, which is highly optimized for the ETH/USD trading pair on the daily (D) timeframe. Attention was also paid to stability, as all parameters are set onto plateaus, so that smaller changes in the characteristic price action should not affect the efficiancy too much. For other assets and/or timeframes it is however possible to change algorithmic parameters within the indicator settings to tune this swing algorithm. You don't need any programming skills or similar abilities to navigate this indicator.
For the here presented backtest data, we omitted the biggest portion of the cryptocurrency bullrun in 2017 (starting only at 1st July 2017) so that the results become more realistic for long-term swing traders (investing at least 2-3 years into trading) if such large runs do not happen again. As cryptocurrencies like Ethereum are still to this date capable of doing comparatively smaller runs of about 2-3x in a few weeks/months (as witnessed in 2020), the order of magnitude of the shown results is still realistic for long-term trend trading efforts. Do not expect these results in a matter of days or weeks, and of course as with any trading strategy past performances are not indicative of future results.
Within this indicator you can choose the backtest time interval to test the perfomance of this algorithm for different time windows and different trading pairs. Here various backtesting parameters (e.g. trading fees) can be customized. Default settings for the shown backtest are a starting balance of $1000, a slippage of 2 ticks (= $0.02) and a trading fee of 0.26 % (which is the worst taker fee on the Kraken exchange) to have realistic settings. However as we do not conduct many trades with this strategy, fees should not impact our performance too much. As long-term swing traders, we devote one initial portion of our portfolio to swing trading and from then on always use 100% of this portion for the next trade to get the compounding starting. This is in difference to other trading styles which use various, often very small, percentage values for their short- or mid-term trades. Keep this in mind when evaluating the backtest data. Also note that due to the small number of trades the statistical significance is low. It is not possible to gather an abundance of long-term trend signals in the order of hundreds or thousands trades, as much more time would have to pass for this in the case of rather new assets like Ethereum.
Additionally to the TradingView Strategy Tester you can also plot your equity directly on the chart to get a sense for the performance. For this you can also scale the equity graph to e.g. match the starting point of your equity with some price point on the chart to get a direct comparison to 'Buy & Hold' strategies over time.
This indicator (and all other content I provide) is no financial advice. If you use this indicator you agree to my Terms and Conditions which can be found on my Twitter profile linked on my TradingView profile or in my signature.
Differences to other versions:
- Changed from a dual (V1, V1.1) to a single smoothing function system (V1.2, V1.3), which can react better to more sudden price movements that got prevalent during the current end-phase of the stock bullmarket due to correlations, while still handling 'normal' price action well
- Changed the oscillator part of the algorithm again with one that handles chop for the ETH/USD trading pair extremely well.
- Improved net profits by potentially +100% in comparison to V1 for ETH/USD on daily timeframe
- However for other assets (e.g. BTC and smaller coins like XTZ and ALGO) and timeframes V1 might perform better than V1.3 due to somewhat different characteristic price action. I leave you with all options to play so that you can find the best solution for a given trading pair.
- There's also a previous version called Swing Algo V1.2 considered the go-to algo at the moment, which works similar to V1.3, but operates a bit less tight, leading to more flexibility while suppressing chop not as much as V1.3.
For access please contact me via DM on TradingView or on Twitter (linked on my TradingView profile and my signature). People who purchased access to any 'Swing Algo 1.x' get access to all other 'Swing Algo V1.x' indicators automatically ('Swing Algo V1' counts as 'Swing Algo V1.0').
Swing Algo V1.2The next upgrade in the 'Swing Algo V1.x' series, and the go-to algorithm for trading ETH (until further notice). For differences to other versions, see below.
This indicator can be used for e.g. swing algorithmic trading. It will give Buy/Long and Sell/Short signals on the chart. This algorithm uses a combination of several (custom) functions and rules to find good entry points for trend trading. After many iterations and tests I came up with this particular setup, which is highly optimized for the ETH/USD trading pair on the daily (D) timeframe. Attention was also paid to stability, as all parameters are set onto plateaus, so that smaller changes in the characteristic price action should not affect the efficiancy too much. For other assets and/or timeframes it is however possible to change algorithmic parameters within the indicator settings to tune this swing algorithm. You don't need any programming skills or similar abilities to navigate this indicator.
For the here presented backtest data, we omitted the biggest portion of the cryptocurrency bullrun in 2017 (starting only at 1st July 2017) so that the results become more realistic for long-term swing traders (investing at least 2-3 years into trading) if such large runs do not happen again. As cryptocurrencies like Ethereum are still to this date capable of doing comparatively smaller runs of about 2-3x in a few weeks/months (as witnessed in 2020), the order of magnitude of the shown results is still realistic for long-term trend trading efforts. Do not expect these results in a matter of days or weeks, and of course as with any trading strategy past performances are not indicative of future results.
Within this indicator you can choose the backtest time interval to test the perfomance of this algorithm for different time windows and different trading pairs. Here various backtesting parameters (e.g. trading fees) can be customized. Default settings for the shown backtest are a starting balance of $1000, a slippage of 2 ticks (= $0.02) and a trading fee of 0.26 % (which is the worst taker fee on the Kraken exchange) to have realistic settings. However as we do not conduct many trades with this strategy, fees should not impact our performance too much. As long-term swing traders, we devote one initial portion of our portfolio to swing trading and from then on always use 100% of this portion for the next trade to get the compounding starting. This is in difference to other trading styles which use various, often very small, percentage values for their short- or mid-term trades. Keep this in mind when evaluating the backtest data. Also note that due to the small number of trades the statistical significance is low. It is not possible to gather an abundance of long-term trend signals in the order of hundreds or thousands trades, as much more time would have to pass for this in the case of rather new assets like Ethereum.
Additionally to the TradingView Strategy Tester you can also plot your equity directly on the chart to get a sense for the performance. For this you can also scale the equity graph to e.g. match the starting point of your equity with some price point on the chart to get a direct comparison to 'Buy & Hold' strategies over time.
This indicator (and all other content I provide) is no financial advice. If you use this indicator you agree to my Terms and Conditions which can be found on my Twitter profile linked on my TradingView profile or in my signature.
Differences to other versions:
- Changed from a dual (V1, V1.1) to a single smoothing function system (V1.2, V1.3), which can react better to more sudden price movements that got prevalent during the current end-phase of the stock bullmarket due to correlations, while still handling 'normal' price action well
- Changed the oscillator part of the algorithm with a better suited one (at least) for the ETH/USD trading pair, handling chop better.
- Improved net profits by potentially +100% in comparison to V1 for ETH/USD on daily timeframe
- However for other assets (e.g. BTC and smaller coins like XTZ and ALGO) and timeframes V1 might perform better than V1.2 due to somewhat different characteristic price action. I leave you with all options to play so that you can find the best solution for a given trading pair.
- There's also an upgrade called Swing Algo V1.3, which works similar to V1.2, but reduces losses due to chop even further. Because V1.2 is a bit more flexible, it is, however, considered the go-to algo for the time being.
For access please contact me via DM on TradingView or on Twitter (linked on my TradingView profile and my signature). People who purchased access to any 'Swing Algo 1.x' get access to all other 'Swing Algo V1.x' indicators automatically ('Swing Algo V1' counts as 'Swing Algo V1.0').

ELLIPSE: Bidirectional Swing Trading Strategy (Strategy Version)The eternal question that has occupied humanity since its early existence is what is the meaning of life and why am I here? On a daily basis this quest for meaning is distilled into a somewhat simpler question: What is the reason for getting up every morning?
For many of us, these thoughts arise even more as autumn arrives and it gets dark, bleak and cold outside. I guess it is easier to forget about the meaning of your life, while swimming on a sandy beach, enjoying a cocktail. Than you are living you life and you don’t need to rationalize it. Everything makes perfect sense!
In winter however, you need to get more “creative”. I, for example, would always try to change my perspective of things by doing something that makes my heart beat faster, like drinking a bottle of Heineken on a Friday evening or having endless conversations with my mates about stupid things, or kicking a ball against BALLONTHEROOF 7 on a Saturday morning. During the week, I would take out my frustrations on the fitness equipment at the local gym.
But what if all of this is canceled by CORONA? All that’s left is to work for the boss and run your 10km lap twice a week. The question is, what do you do now, with this huge amount of ”free” time than any old person would give anything for. When you are young time is never ending, when you are older it is never enough. Time has reached a different dimension in these days.
However, you can still do 2 things. You can slowly let the walls come to you and give up or you can actually do something useful with your time and find something that you are good at.
For us this choice was easy. After the success of our positioning trading strategy the MATRIX, at the time of the corona lockdown, we started making a swing trading strategy for the 4H timeframe, called ELLIPSE. We have included all feedback and any improvements we received about the positioning strategy and integrated it into the 4H script.
The main requirements of the script that we had set ourselves were:
Bidirectional
Low max drawdown
High profit factor
Works on all main crypto coins
By fully focusing ourselves on the script over the past few months, I can’t help but (unhumbly) say that we have not only succeeded in our mission, but that we have absolutely surpassed ourselves!
The only bright spot in this heavy corona time is, if a drug becomes available, there is extra money in the bank!
***The script is invite-only, message us to get script access***
-------------------------------------------------------------------------------------------------
User Guidelines:
The trading strategy was designed and optimized for trading cryptocurrencies only; furthermore it works best on established cryptocurrencies that have a clear historical trend such as:
BTCUSD
ETHUSD
LTCUSD
XRPUSD
ADAUSD
The trading strategy is based on swing trading methodology. The script must therefore be used on 4h candles only .
Use USD trading pairs only (e.g. use ETHUSD instead of the ETHBTC) since the individual trend is captured more effectively and therefore gives better results.
The trading strategy is bidirectional , both long and short entries are generated.
-------------------------------------------------------------------------------------------------
Indicators used in this strategy:
Ichimoku Cloud ; acts as the leading indicator.
Volume ; without strong volume , a market move is not valid.
MACD and Vortex ; both being used as confirmation indicators.
Choppiness index ; avoids trading in choppy markets.
Simple and Exponential Moving Averages ; prevents trading against the trend.
The trading strategy is easy to use, bidirectional, trend based and without repainting, meaning once a signal has been made it is permanent and that no future data is used in the decision making. It detects the trend and filters out market noise based on more than 10 technical indicators. ONLY when all indicators align with each other the algorithm prints a LONG or SHORT signal. The trading strategy provides high probability trading signals and minimizes risk! This script aims to capture the profit from short to medium trending moves and by doing so filters out non-substantial trends and avoids the associated risks with these trades.
-------------------------------------------------------------------------------------------------
Features:
NO Repaint once candle is closed.
Stop loss feature ; set your own stop loss to manage your risks.
Customizable Display for the Ichimoku cloud indicator display.
Bidirectional ; both long and short trading positions can be enabled.
Full backtest feature ; Easily generate your own backtest results for each asset (Strategy Version Script).
Alerts ; Get notified via email / pop-up / sms / app once a signal is given! (Alert Version Script).
-------------------------------------------------------------------------------------------------
Backtest results
Below are the back test results. Only well established cryptocurrencies are displayed with a clear historical trend:
Long and short trading positions,
Signal to signal trading (no multiple orders),
Initial Capital: 10 000 USD,
Order size: 10% of equity per trade,
commission fee 0.1%, period: start of chart,
Exchange-----Asset------Timeframe---Percent Profitable----Profit Factor---Total Trades----Max Drawdown----------Net Profit------
Bínance------BTCUSDT------4H-----------------54.4---------------5.32-----------------57----------------1.58%------------40.34%-(4034 USD)
Bínance------ETHUSD-------4H-----------------50.9---------------5.01---------------- 57----------------2.96%------------54.93%-(5493 USD)
Bínance------LTCUSD--------4H-----------------61.0---------------5.08-----------------59----------------2.09%------------57.06%-(5706 USD)
Bínance------XRPUSD-------4H-----------------43.13--------------3.52-----------------51----------------2.42%------------43.13%-(4313 USD)
Bínance------ADAUSD-------4H-----------------57.5---------------3.36-----------------47----------------3.46%------------40.82%-(4082 USD)
-------------------------------------------------------------------------------------------------
Reminder: Use this trading strategy at your own risk and trade responsibly. We are not responsible for any financial loss using this strategy.
***The script is invite-only, message us to get script access***

ELLIPSE: Bidirectional Swing Trading Strategy (Alert Version)This is the alert version of our original script ELLIPSE: Ultimate Bidirectional Swing Trading Strategy.
This release has the same internal algorithm as the ELLIPSE Strategy script. But instead of showing back test results, this script provides the functionality to add alerts that can notify the user via email / pop-up / sms / app once a signal is given! You must manually add these alerts via TradingView. If you need help setting up these alerts, feel free to ask in the comment box or send us a dm.
***The script is invite-only, message us to get script access***
-------------------------------------------------------------------------------------------------
User Guidelines:
The trading strategy was designed and optimized for trading cryptocurrencies only ; furthermore it works best on established cryptocurrencies that have a clear historical trend such as:
BTCUSD
ETHUSD
LTCUSD
XRPUSD
ADAUSD
The trading strategy is based on swing trading methodology. The script must therefore be used on 4h candles only .
Use USD trading pairs only (e.g. use ETHUSD instead of the ETHBTC) since the individual trend is captured more effectively and therefore gives better results.
The trading strategy is bidirectional , both long and short entries are generated.
-------------------------------------------------------------------------------------------------
Indicators used in this strategy:
Ichimoku Cloud ; acts as the leading indicator.
Volume ; without strong volume , a market move is not valid.
MACD and Vortex ; both being used as confirmation indicators.
Choppiness index ; avoids trading in choppy markets.
Simple and Exponential Moving Averages ; prevents trading against the trend.
The trading strategy is easy to use, bidirectional, trend based and without repainting, meaning once a signal has been made it is permanent and that no future data is used in the decision making. It detects the trend and filters out market noise based on more than 10 technical indicators. ONLY when all indicators align with each other the algorithm prints a LONG or SHORT signal. The trading strategy provides high probability trading signals and minimizes risk! This script aims to capture the profit from short to medium trending moves and by doing so filters out non-substantial trends and avoids the associated risks with these trades.
-------------------------------------------------------------------------------------------------
Features:
NO Repaint once candle is closed.
Stop loss feature ; set your own stop loss to manage your risks.
Customizable Display for the Ichimoku cloud indicator display.
Bidirectional ; both long and short trading positions can be enabled.
Full backtest feature ; Easily generate your own backtest results for each asset (Strategy Version Script).
Alerts ; Get notified via email / pop-up / sms / app once a signal is given! (Alert Version Script).
-------------------------------------------------------------------------------------------------
Backtest results
Below are the back test results. Only well established cryptocurrencies are displayed with a clear historical trend.
Back test results: (long and short trades, signal to signal, order size: 100% of equity, commision fee 0.1%, period: start of chart)
Exchange-----Asset---------Timeframe---Percent Profitable----Profit Factor-----Total Trades----Max Drawdown---Average bars in trade-----Net Profit
Bínance------BTCUSDT---------4H-----------------54.4---------------3.37-------------------57----------------14.9---------------------38------------------1978
Bínance------ETHUSD----------4H-----------------50.9---------------3.48------------------- 57---------------26.8----------------------37------------------3953
Bínance------LTCUSD-----------4H-----------------61.0---------------3.15-------------------59----------------20.9---------------------33------------------3098
Bínance------XRPUSD----------4H-----------------43.1---------------2.44--------------------51---------------22.4----------------------26------------------1226
Bínance------ADAUSD----------4H-----------------57.5---------------3.47--------------------47---------------34.7----------------------35------------------1233
-------------------------------------------------------------------------------------------------
Reminder: Use this trading strategy at your own risk and trade responsibly. We are not responsible for any financial loss using this strategy.
***The script is invite-only, message us to get script access***

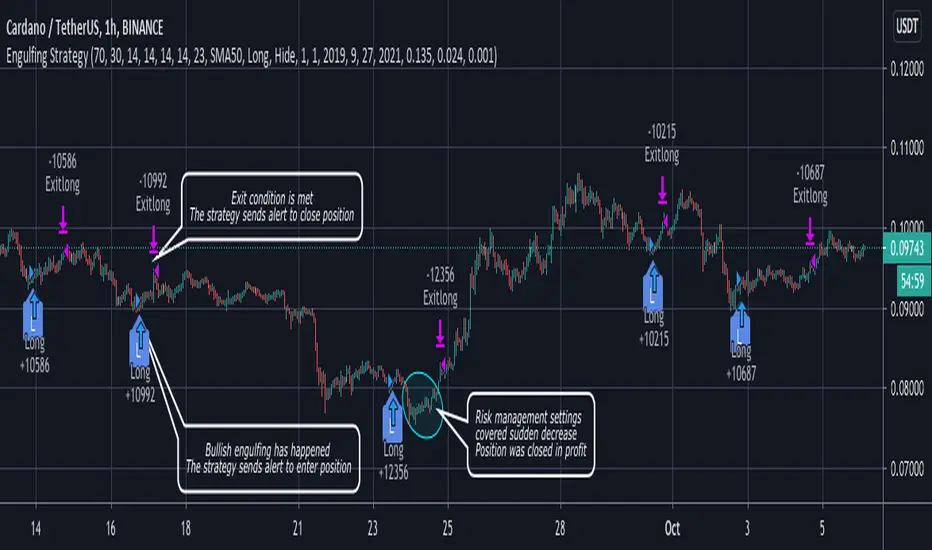
Engulfing strategy with DMI confirmationThe strategy contains Bearish and Bullish Engulfing trend reverse alerts with entry and closure notifications. Entries are enforced by Directional Movement Index (DMI) indicator levels combination. The strategy can be applied to spot, futures and marginal trading exchanges. It is suitable for both long and short positions and works accurately with BTC, USDT, ETH and BNB quote currencies. Best to use with 1H timeframe charts
Strategy elements can be configured at your own desire with user interface settings, no programming skills required:
1. Choose signals type: Long, Short or Both
2. Choose trend detection pattern rule:
SMA50 - provides a higher number of positions
SMA50 + SMA200 provides a higher accuracy
3. Change risk management settings to make the most accurate and efficient configuration. You can set up unique stop loss, take profit and trailing offset for different assets
4. Configure strategy periods
DMI and ADX lengths
ADX Smoothing
Key level
EMA and SMA lengths
5. Configure backtest dates
6. Show or hide RSI support and resistance bands
Engulfing strategy provides information for traders to enter the market in anticipation of a possible reversal in trend. Engulfing candles tend to signal a reversal of the current trend in the market. This specific pattern involves two candles with the latter candle "engulfing" the entire body of the candle before it. The engulfing candle can be bullish or bearish depending on where it forms in relation to the existing trend. The script calculates and compares values of the price action candles to define is there an engulfing and what type it is: bullish or bearish
If there is a bullish engulfing the indicator fills price action candle with yellow color
If there is a bearish engulfing the indicator fills price action candle with purple color
Advantages of the script:
1. The script detects presence of both types of engulfing: Bullish and Bearish
2. Weak engulfment signals and market noises are filtered by RSI bands and DMI confirmations. This allows to receive only strong and confirmed engulfment signals
3. This script has configurable risk management settings (order size, commission, take profit, stop loss and trailing). This provides you opportunity of direct broker connection and allows to conduct backtests before applying the strategy to real account. You also can set up strategy actions alerts
At the chart you can see the historical price action of ADAUSDT at Binance exchange from the January 1st 2019 till current date. The strategy is set up to receive only long signals because it is a spot market. Moments when the strategy triggered to enter a position are shown as L label while position entries are shown as "Long" messages. Moments when a certain position should be closed are shown as "Exitlong" messages
The strategy demonstrate high backtest results:
Mathematical expectation of risk management settings is positive = 1.34%
Percent profitable = 93.33%
Profit factor = 3.253
Quantity of entries = 75
Net profit = 15.22%
How to use?
Long signals:
1. Apply indicator to a trading pair your are interested in.
2. Click Settings button and select Alert Positions Type Long
3. Once bullish engulfing and confirmation conditions are met price action candle will be colored yellow and script strategy will enter a position.
4. Check Strategy Tester to set up optimal Risk management settings: stop loss, trailing profit activation point, trailing offset
5. Set up the strategy alert to be notified when a position should be opened or closed
Short signals:
1. Apply indicator to a trading pair your are interested in.
2. Click Settings button and select Alert Positions Type Short
3. Once bearish engulfing and confirmation conditions are met price action candle will be colored purple and script strategy will enter a position.
4. Check Strategy Tester to set up optimal Risk management settings: stop loss, trailing profit activation point, trailing offset
5. Set up the strategy alert to be notified when a position should be opened or closed
Best regards,
SkyRock Signals team
If you want to receive access to the strategy please contact us in personal message!
The MATRIX: Ultimate Crypto Position Strategy (Alert Version)Welcome back everyone,
It's been a while since our last post. In recent months we have worked on all kinds of projects, but more on that later. In the meantime, we also received a lot of positive feedback about our original 'The MATRIX: Ultimate Crypto Position Strategy' script.
One of the many requests was whether we could release an alert version.
However, since Pinescript does not provide the alert functionality in a strategy type script, it had to be converted to a study type script. Besides that, we have also added a stop-loss functionality. This release has the same internal algorithm as the original 'The MATRIX: Ultimate Crypto Position Strategy' script. But instead of showing back test results, this script provides the functionality to add alerts that can notify the user via email / pop-up / sms / app once a signal is given! You must manually add these alerts via TradingView. If you need help setting up these alerts, feel free to ask in the comment box or send us a dm.
***The script is invite-only, message us to get script access***
-------------------------------------------------------------------------------------------------
The MATRIX: Ultimate Crypto Position Strategy should be used as follows:
• The trading strategy was designed and optimized for trading cryptocurrencies only ; furthermore it works best on established high market cap cryptocurrencies that have a clear trend such as:
BTCUSD
ETHUSD
LTCUSD
XRMUSD
EOSUSD
ADAUSD
DASHUSD
ETCUSD
• The trading strategy is based on swing/position methodology. The script must therefore be used on daily timeframe candles only (1D).
• Use USD trading pairs only (e.g. use ETHUSD instead of the ETHBTC) since the individual trend is captured more effectively and therefore gives better results.
-------------------------------------------------------------------------------------------------
The MATRIX:Ultimate Crypto Position Strategy is based on the following indicators:
• Ichimoku Cloud ; acts as the leading indicator.
• Volume ; without strong volume , a market move is not valid.
• MACD and Vortex ; both being used as confirmation indicators.
• Choppiness index ; avoids trading in choppy markets.
• Bullish/ Bearish Regular Divergences in combination with RSI to spot tops and bottoms.
• Simple and Exponential Moving Averages ; prêvents trading against the trend.
The trading strategy is easy to use, trend based and without repainting, meaning once a signal has been made it is permanent and that no future data is used in the decision making. It detects the trend and filters out market noise based on more than 10 technical indicators. ONLY when all indicators align with each other the algorithm prints a BUY or SELL signal. The trading strategy provides high probability trading signals and minimizes risk! This script aims to capture the profit from longer term trending moves and by doing so filters out non-substantial trends and avoids the associated risks with these trades.
-------------------------------------------------------------------------------------------------
The MATRIX: Ultimate Crypto Position Strategy has the following features:
• ALERTS can be enabled which can notify the user through email/popup/app once a signal is given.
• Automatically generated Buy / Sell alerts in the form of a label.
• NO Repaint once candle is closed.
• SAFEGUARD ; custom built-in security prevẹnts trading when the price is out of equilibrium.
• Customizable Display for the Ichimoku cloud indicator display.
-------------------------------------------------------------------------------------------------
Reminder: Use this trading strategy at your own risk and trade responsibly. We are not responsible for any financial loss using this strategy.
***The script is invite-only, message us to get script access***

Truenomic's Universal BTC and ETH VolumeA simple indicator to display the total volume of BTC or ETH from different exchanges. The difference between this indicator and others is the ability to see the total volume in BTC or ETH (not USD) from all exchanges simultaneously, including derivative ones.
Spot Exchanges:
Binance;
Coinbase;
Kraken;
Gemini;
Bitfinex;
Bitstamp;
Derivatives Exchanges:
Bitmex;
Okex;
Deribit;
FTX;
Binance;
This list is relevant only at the time of publication, stay tuned for further indicator updates!

CONSOL SPOT ETHEREUM OBVConsolidated OBV for ETH Cross the below exchange volume also has built-in divergences.
BITSTAMP:ETHUSD
COINBASE:ETHUSD
COINBASE:ETHEUR
COINBASE:ETHUSDC
COINBASE:ETHGBP
BINANCE:ETHUSDT
BINANCE:ETHUSDC
BINANCE:ETHPAX
BITFINEX:ETHUSD
KRAKEN:ETHUSD
KRAKEN:ETHEUR
ETHUSD signal [DinhChienFX Corner] Ver 1.01. How to use Keltner Channel
a_ Length of Keltner's basis line is 50. It gives the best result in finding rule of ETHUSD.
b_ How to confirms a trend.
- Upper 1 is used to confirm Keltner channel at Uptrend to give Buy_1.
- Lower 1 is used to confirm Keltner channel at Downtrend to give Sell_1.
c. How to determine a swing Entry.
- Upper 1 is used to buy when the market make a corrective.
- Lower 1 is used to sell when the market make a corrective.
d. Color count calculate
- Color count = Green + Red
- If Color count > 0 is Uptrend to give Buy_2
- If Color count < 0 is Downtrend to give Sell_2
2. Long signal is confirmed when Closed of candle crossover the Upper 1 & Color count for Uptrend.
3. Short signal is confirmed when Closed of candle crossunder the Lower 1 & Color count for Downtrend.
4. Stoploss is calculated by the price closed candle +/- the value of Average true range (length=20 bars)
Stoploss = previous Close +/- atr(20)x2x0.9
-> To move the stoploss every 1 hour.
5. Filter the Candle is over 93% for Not Entry.
6. Report the result at Backtest:
a. Longterm result 2018-23/9/2020:
b. Midterm result (every year)
_ 2018-2019:
_ 2019-2020:
c. Shortterm 01/01/2020 to 09/23/2020
--------------
"Use the link below to obtain access to this indicator" or "PM us to obtain access"
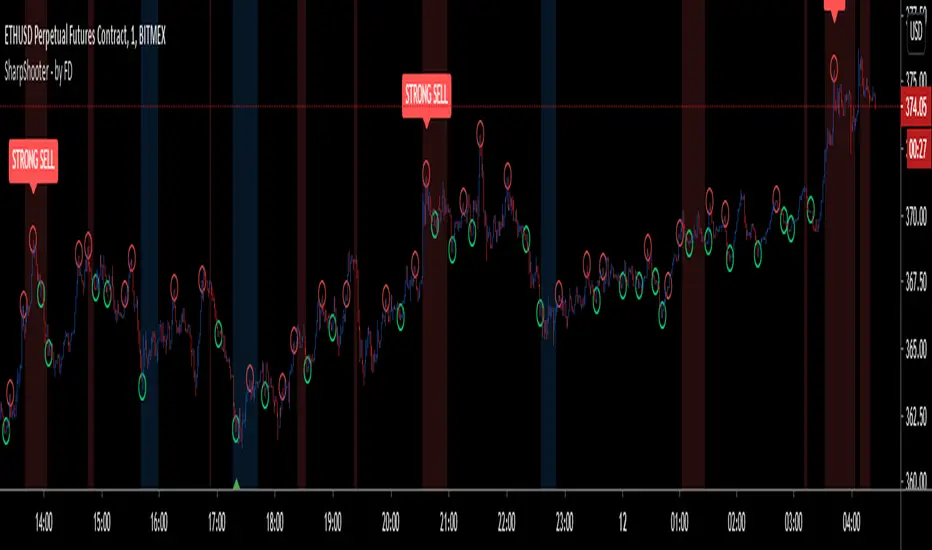
Sharp Shooter - by FiatDropoutThis is an experimental script and is intended to be used only on LTF charts for scalping. It may or may not be useful on other charts and time frame, but that is subject to back testing.
Now, coming back to this script. It has multiple features yet i tried to keep it as clean in representation as possible.
As obvious, few things are easily recognizable on chart, such as:
BUY - Go LONG
STRONG BUY - Heavy Uptrend is expected, Go LONG
SELL - Go SHORT
STRONG SHORT - Heavy Downtrend is expected, Go SHORT.
on addition to above signals, there are few other plot-shapes, which are:
Red Circle - Acts as TP for LONG during uptrend and acts as Add-On SHORT during downtrend
Green Circle - Acts as TP for SHORT during downtrend and acts as Add-on LONG during uptrend.
Red Background - Bearish Peak, potential start of downtrend
Blue Background - Bullish Peak, potential start of uptrend
------------------------------------------------------------------------------------------------------------------------------------------------------------------------------------
Now that plots are over, lets go to how to use them. As name of this script suggests, it intends to find most optimal entry and exit for long and short while taking profit on the way and adding to the position until trend changes.
Be aware that trend here is very much based on current time-frame and does not represent other time-frame's bias. Also, trend here is intended to be used as a scalp trend and not a swing trend.
Now once, you get a signal for BUY(example), then wait for "Bullish Peak"(blue background) to appear with either "STRONG BUY" or just "BUY" and take an entry at respective price, next look for "red circle" which acts as TP for long(refer sec, above) and either move stop to entry, or take partial profits or close position entirely.
Now every subsequent "green circle" will act as add-on for long and every "red circle" will act as TP for long, until "Bearish Peak" appears, which will reverse the order of how circles are used and direction of the trade. Now during "Bearish Peak" and until "Bullish Peak" appears, "red circle" will act as add-on for short and "green circle" will act as TP for short.
It might take some time to adjust to the plots, but i have decided to keep it that way in order to keep chart clean of too many signals.
------------------------------------------------------------------------------------------------------------------------------------------------------------------------------------
NOTE : Please use stops and be sure to place orders quickly as prices move faster on minute charts and you should be able to place orders and stop right away, so if you are new to trading and are currently in early stage of the business, scalping is strongly not advised, let alone this indicator. Also, past performance are not guarantee of future results and most importantly, this indicator does not repaint. By using this indicator, you accept that i am not responsible for any losses or gains made by user by trading with help of this bot.
Also, in next update, i will fix some bug, add some SS and also add alerts. Alerts are not being added currently because of high volatile nature of the bot signals which if tried on automation can give varied results. Once everything is set, i shall add alerts.
for any other queries, feel free to get back here on chat or DM.
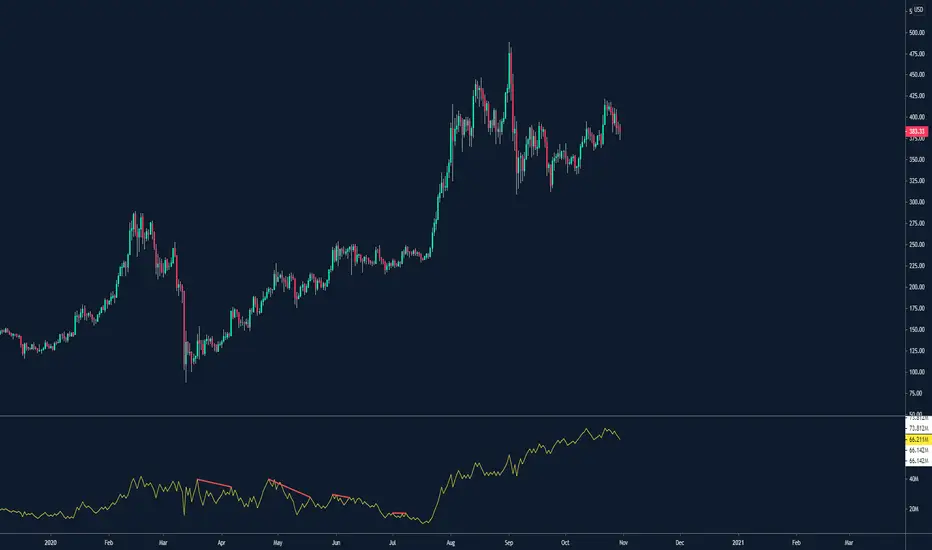
RSI + MFI - Crypto Bull and Bear market A fancy styled version of the RSI (Relative Stochastic Index) + MFI (Money Flow Index) oscillators in order to emphasize buy and sell opportunities.
The 80 and 20 Bands are meant to be used in Bull or Bear markets. Better performing in D timeframes.
The circles represent the cross between RSI and MFI .
Designed for Crypto Markets
Thanks @micheleprandina
Credits:

Crypto USD VolumeOften times I need to check the volume in cryptocurrency exchanges and I find myself checking which type of volume I am looking at, I need to manually make sense what the data is and converting it into USD volume which I end up going to CoinMarketCap website to verify whether my calculation is right.
Today I thought it was about time I created an automatic way to find the volume in USD Dollars. This is what this script does.
1 - It removes the base currency from the symbol (e.g., "BTCUSD", it would remove "BTC", leaving us with the "USD" part.). This is important because it helps us identify the currency the pair uses.
2 - It has different pair's variables, each is given a specific currency that the final volume is calculated from. (BTC, ETH, BNB and USD are the default currencies, for other ones, it must be added manually).
This works with all crypto symbols that include BTC, ETH, BNB and USD as currencies. If you modify it, please make sure to compare data with the exchange's one.
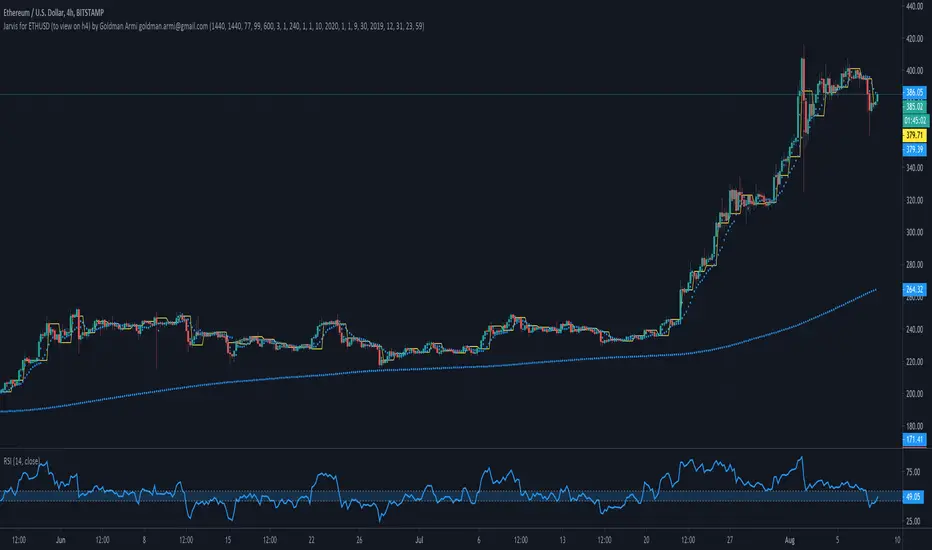
Jarvis for ETHUSD by Goldman ArmiThis strategy is called JARVIS after the famous AI from the MARVEL movie Iron Man.
It is an improvement of the Copernicus Strategy to get better results. More exactly I was aiming to obtain over 50% of the number of trades profitable, for every pair provided (see the title).
The strategy tester does not include leverage trading, please keep that in mind and feel free to change the parameters of the volume for the position in the strategy settings to see the closer to reality results.
The setup for this strategy is more complicated because it includes 3 averages, all of them calculated with prices obtain by various formulas for each one of them and I call this: Sophisticated Moving Average (Copyright). Each of the 3 averages are applied to different timeframes and have different values. All of these parameters are configured separately for every trading pair and this is why I am publishing them separately.
There are not a lot of trades in this strategy, the average is around 1/month.
You can use the Tradingview alert services to configure this to execute (webhook) on your exchange/broker, because strategies have now the possibility to send alerts.
For other questions please send me a message.
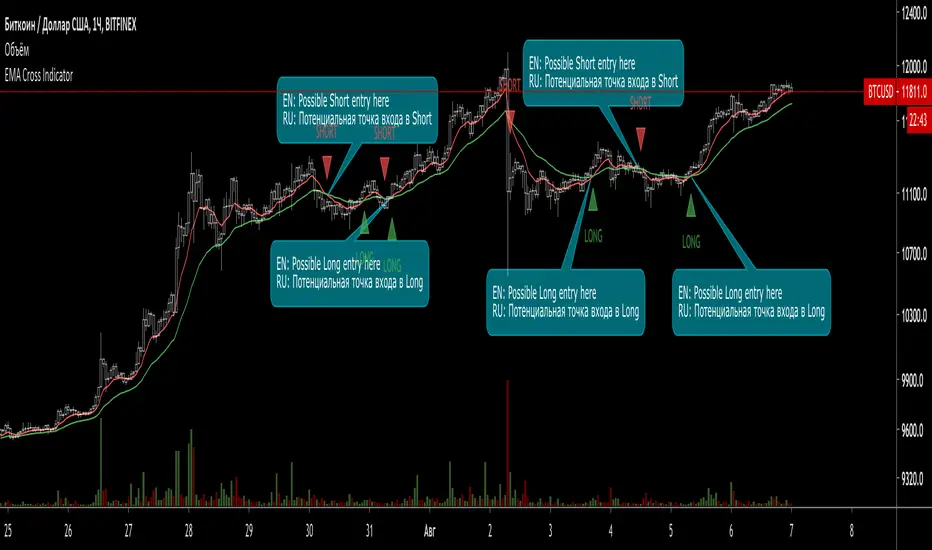
EMA Cross Indicator (with signals)This indicator shows 2 EMA (Long and Short) Cross and gives a possible entry point for a trade.
When Short EMA (red line) line crosses Long EMA (green) from bottom to top - this is a possible Long trade entry point.
When Long EMA (green line) line crosses Short EMA (red) from bottom to top - this is a possible Short trade entry point.
In both cases (basically, all the crossovers) are indicated with "Long" and "Short" labels.
Works with Crypto (from 30 min timeframe and higher)
Stocks (from 1 hour timeframe and higher)
Commodities (from 1 hour timeframe and higher)
Forex (from 1 hour timeframe and higher)
Consider using it with respect to Your trading style, money- and risk-management as well as other indicators.
Ethereum: Price Action Integral BandsThis indicator tries to display absolute tops and bottoms for Ethereum. The price action gets integrated with three custom functions resulting in the blue top, green mid and red bottom price action integrals. From those integral values we allow 5% deviation in up and down direction, leading to price action integral bands of some non-zero width.
Even during the liquidity crisis in March 2020 with abnormal price movements, Ethereum had no daily or weekly candle close below the support band. For longer-term trades it might be a good idea to buy ETH when price is around the red band, and temporarily sell/go short when ETH is around the blue band, although this is no financial advice and one should always cross-check with other indicators/informations.
The green mid price action integral band indicates bullish/bearish zones. When price is located above the green band, the market is in a bullish environment, if price lies below it, the market is in a bearish environment.
There's the option to plot or hide the bands individually.
These integral bands are specifically designed for the Ethereum (ETHUSD) Kraken ticker on daily (D) or weekly (W) timeframe (the indicator automatically adjusts for both those timeframes). For other assets, tickers and timeframes the functionality of this indicator cannot be guaranteed and will most probably not deliver meaningful results. If you want to use the integral bands for Bitcoin, please see my other indicator titled 'Bitcoin: Price Action Integral Bands'.
For access please contact me via DM on TradingView or on Twitter (linked in my TradingView profile and my signature).

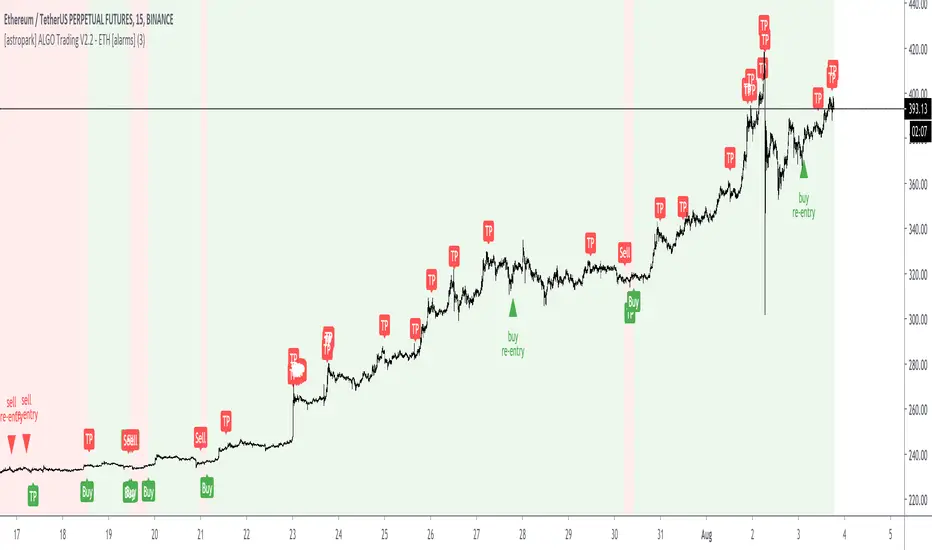
[astropark] ALGO Trading V2.2 - ETH [alarms]Dear Followers,
today another awesome Swing and Scalping Trading Strategy indicator : the upgraded version of ALGO Trading V2 for Binance Ethereum PERP on 15m timeframe!
It is runnable on a bot , just write me in order to help you do it.
If you are a scalper or you are a swing trader, you will love suggested entries for fast and long-lasting profit.
Keep in mind that a proper trailing stop strategy and risk management and money management strategies are very important (DM me if you need any clarification on these points).
This is an upgrade version of ALGO Trading V2 for Ethereum.
You can find ALGO Trading V2 indicator here below:
If you are interested in Bitcoin Trading, you will like for sure ALGO Trading V1.2, which is a customized version for Bitcoin trading:
This strategy has the following options:
enable/disable signals on chart
enable/disable bars and background coloring based on trend
enable/disable a Filter Noise option, which reduces overtrading
enable/disable a Trailing Stop option
enable/disable/config a Take Profit option, with Re-Entry
enable/disable a secret Smart Close Option which may improve profit on your chart (again, check it on you chart if it helps or not)
This strategy only trigger 1 buy (where to start a long trade) or 1 sell (for short trade). If you enable Take Profit / Stop Loss option, consider that many TP can be triggered before trend reversal, so take partial profit on every TP an eventually buy/sell back lower/higher on RE-ENTRY signal to maximize your profit.
This script will let you set all notifications you may need in order to be alerted on each triggered signals.
The one for backtesting purpose can be found by searching for the astropark's "ALGO Trading V2.2" and then choosing the indicator with "strategy" suffix in the name, or you can find here below:
This is not the "Holy Grail", so use proper money and risk management strategies.
This is a premium indicator , so send me a private message in order to get access to this script.
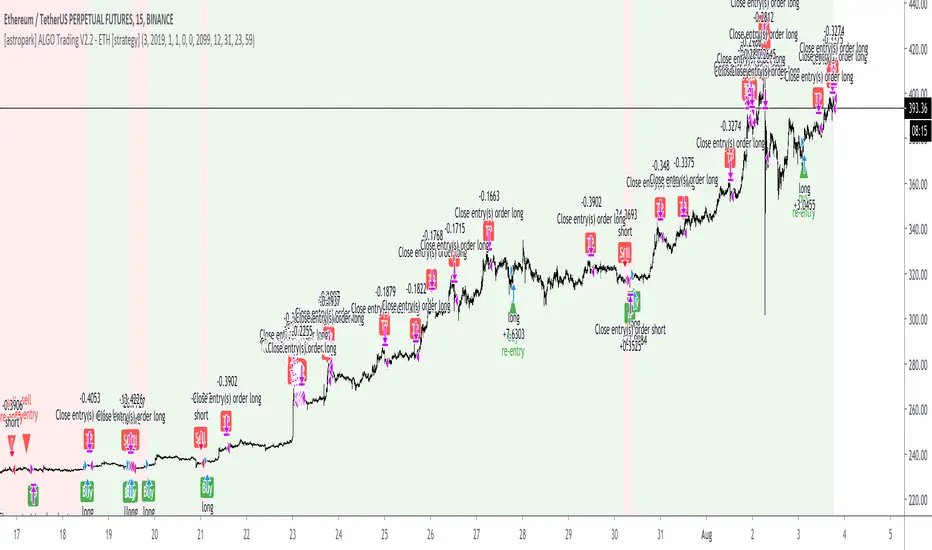
[astropark] ALGO Trading V2.2 - ETH [strategy]Dear Followers,
today another awesome Swing and Scalping Trading Strategy indicator : the upgraded version of ALGO Trading V2 for Binance Ethereum PERP on 15m timeframe!
It is runnable on a bot , just write me in order to help you do it.
If you are a scalper or you are a swing trader, you will love suggested entries for fast and long-lasting profit.
Keep in mind that a proper trailing stop strategy and risk management and money management strategies are very important (DM me if you need any clarification on these points).
This is an upgrade version of ALGO Trading V2 for Ethereum.
You can find ALGO Trading V2 indicator here below:
If you are interested in Bitcoin Trading , you will like for sure ALGO Trading V1.2, which is a customized version for Bitcoin trading:
This strategy has the following options:
enable/disable signals on chart
enable/disable bars and background coloring based on trend
enable/disable a Filter Noise option, which reduces overtrading
enable/disable a Trailing Stop option
enable/disable/config a Take Profit option, with Re-Entry
enable/disable a secret Smart Close Option which may improve profit on your chart (again, check it on you chart if it helps or not)
This strategy only trigger 1 buy (where to start a long trade) or 1 sell (for short trade). If you enable Take Profit / Stop Loss option, consider that many TP can be triggered before trend reversal, so take partial profit on every TP an eventually buy/sell back lower/higher on RE-ENTRY signal to maximize your profit.
Strategy results are calculated on the time window from December 2019 to now, so on more than 7 months, using 1000$ as initial capital and working at 1x leverage (so no leverage at all! If you like to use leverage, be sure to use a safe option, like 3x or 5x at most in order to have liquidation price very far).
This is not the "Holy Grail", so use proper money and risk management strategies.
In order to get notified when a signal is triggered, you need to use the "alarms" version of this indicator (just search for astropark's "ALGO Trading V2.2 - ETH" indicator and choose the one with "alarms" suffix).
This is a premium indicator , so send me a private message in order to get access to this script.