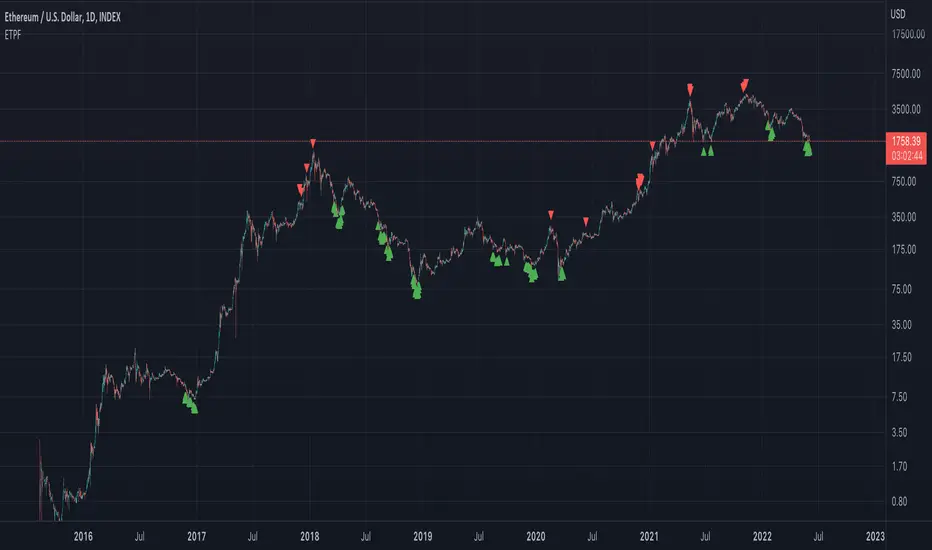
Exponential Top and Bottom FinderThis is an indicator to identify possible tops and bottoms after exponential price surges and drops, it works best on ETH 1D, but you can also use it for bitcoin and altcoins.
It's based on stochastic first and second derivatives of a close moving average
Ethereum (Mata Wang Kripto)
Sideways Strategy DMI + Bollinger Bands (by Coinrule)Markets don’t always trade in a clear direction. At a closer look, most of the time, they move sideways. Relying on trend-following strategies all the time can thus lead to repeated false signals in such conditions.
However, before you can safely trade sideways, you have to identify the most suitable market conditions.
The main features of such strategies are:
Short-term trades, with quick entries and quick exits
Slightly contrarian and mean-reversionary
Require some indicator that tells you it’s a sideways market
This Sideways DMI + Bollinger Bands strategy incorporates such features to bring you a profitable alternative when the regular trend-following systems stop working.
ENTRY
1. The trading system requires confirmation for a sideways market from the Directional Movement Index (DMI) before you can start opening any trades. For this purpose, the strategy uses the absolute difference between positive and negative DMI, which must be lower than 20.
2. To pick the right moment to buy, the strategy looks at the Bollinger Bands (BB). It enters the trade when the price crosses over the lower BB.
EXIT
The strategy then exits when the move has been exhausted. Generally, in sideways markets, the price should revert lower. The position is closed when the price crosses back down below the upper BB.
The best time frame for this strategy based on our backtest is the 1-hr. Shorter timeframes can also work well on certain coins that are more volatile and trade sideways more often. However, as expected, these exhibit larger volatility in their returns. In general, this approach suits medium timeframes. A trading fee of 0.1% is taken into account. The fee is aligned to the base fee applied on Binance, which is the largest cryptocurrency exchange.

Three EMAs Trend-following Strategy (by Coinrule)Trend-following strategies are great because they give you the peace of mind that you're trading in line with the market.
However, by definition, you're always following. That means you're always a bit later than your want to be. The main challenges such strategies face are:
Confirming that there is a trend
Following the trend, hopefully, early enough to catch the majority of the move
Hopping off the trade when it seems to have run its course
This EMA Trend-following strategy attempts to address such challenges while allowing for a dynamic stop loss.
ENTRY
The trading system requires three crossovers on the same candle to confirm that a new trend is beginning:
Price crossing over EMA 7
Price crossing over EMA 14
Price crossing over EMA 21
The first benefit of using all three crossovers is to reduce false signals. The second benefit is that you know that a strong trend is likely to develop relatively soon, with the help of the fast setup of the three EMAs.
EXIT
The strategy comes with a fixed take profit and a volatility stop, which acts as a trailing stop to adapt to the trend's strength. That helps you get out of the way as soon as market conditions change. Depending on your long-term confidence in the asset, you can edit the fixed take profit to be more conservative or aggressive.
The position is closed when:
The price increases by 4%
The price crosses below the volatility stop.
The best time frame for this strategy based on our backtest is the 4-hr. Shorter timeframes can also work well, although they exhibit larger volatility in their returns. In general, this approach suits medium timeframes. A trading fee of 0.1% is taken into account. The fee is aligned to the base fee applied on Binance, which is the largest cryptocurrency exchange.

Optimised RSI strategy for Reversals (by Coinrule)The most common way to use the RSI to spot a good buy opportunity is to check for values lower than 30. Unfortunately, the RSI can remain in oversold territory for long periods, and that could leave you trapped in a trade in loss. It would be appropriate to wait for a confirmation of the trend reversal.
In the example above I use a short-term Moving Average (in this case, the MA9) coupled with an RSI lower than 40. This combination of events is relatively rare as reversal confirmations usually come when RSI values are already higher. As unusual as this setup is, it provides buy-opportunities with much higher chances of success.
The parameters of this strategy would be:
ENTRY: RSI lower than 40 and MA9 lower than the price
TAKE PROFIT and STOP-LOSS with a ratio of at least 2. That means that if you set up a take profit of 3%, your stop-loss shouldn’t be larger than 1.5%.
The advantage of this approach is that it has a high rate of success and allows you the flexibility of setting up the percentages of the take profit and stop-loss according to your preferences and risk appetite.

Bitcoin trend RVI and Emastrategy with two emas and rvi.
Only long positions when fast ema above slow ema when rvi gives entry.
Only short positions when slow ema above fast ema when rvi gives entry.

VMC Oracle This is Oracle. It is a momentum driven indicator with behind-the-scenes filters designed to best indicate the oversold and overbought points on most assets. Oracle partially uses a regression equation displayed in line format with a predetermined spacing to indicate different support and resistance points within the last 100 bars. When used in combination with the smoothed oscillator and moving averages it becomes a powerful tool in your box. It is important to keep in mind that because this indicator is always looking at the last 100 bars the user will need to use the “replay” function on Tradingview for the best manual back-testing to the triggers as possible. It should become clear that when its in the red zone above the ‘zero’ line that the potential for downward movement is greater. The bottom or below ‘zero’ green zone indicates a potential time to buy.
In addition to the regression lines, the indicator is supplied with a basic moving average application involving cross analysis. The two lines in cooperation help the user determine when the overall trend is shifting. As an example, when the overall trend may be indicating a bearish market or downtrend it may be beneficial to consider any of Oracle’s triggers that may be opposite more closely. Some of the alerts will trigger in what appears to be opposite trending areas such as a buy trigger when the averages indicate a bearish period. When this happens, it is up to the user utilize other confirmation type tools to assist in the decision of the oracle triggers. The reason for this is that Oracle is designed to predict the change in the market before or during a peak or through area on the graph. The success can be large but this can reduce the automatic trigger’s success in which loss management must be executed.
The custom alert function built in is designed to automate the visual comparisons of the two items above. By considering trend, immediate resistance and support lines, and momentum we can help visually indicate the points of possible exhaustion in either direction.
When setting up the alert it's as simple as a new alert creation and selecting the VMC Oracle Indicator in the top drop down. After that its as simple as selecting Long Alert or Short alert. As with any tool it is recommended to understand the asset being traded and providing yourself with the best risk management rules to minimize unfavorable movements.

The Brain Trust Presets Strategies [BTC / ETH] [PrismBot] [Lite]This strategy contains 9 different timeframe strategies (2 strategy types with pre-adjusted filter options for the different timeframes) tailored to BTC ( Bitcoin ) and ETH ( Ethereum ) on Binance. While I've listed these prebuilt strategies for specific timeframes, they are versatile enough to be checked and tested on other timeframes, and exchanges as well. I have been careful to avoid any curvefitting or overfitting. Included is useful default order settings, but we wanted to ensure you, the user, has control over the order settings for your own equity and trading.
These strategies are created, tailored, tested, and actively used by me.
It is up to you to do your own due diligence when testing these strategies on your exchange, and for your use, and PrismBot bears no responsibility for losses from the use of these strategies.
These strategies employ a variety of methods. Notable inclusions are other live strategies of mine including but not limited to:
ADX + MACD
RSI
Consolidations
Bull Bear Power
Volume Calculations
Open Interest Data
All of these setups include trend trading methods intended to maximize profitability in strong trending markets, and filters deployed to prevent failures in consolidation, though nothing is failproof.
You can control your leverage, quantity calculations, and other order settings. However, all other strategy input parameters are controlled by the strategy selectors.
Some strategies use 1.5 to 1 Risk to Reward ratio while others use 1:1.
How we execute trades for each strategy:
For 10m and 45m
we use a variety of settings for a Normalized MACD and ADX indicator. The thesis is we detect Normalized MACD crossovers at specific values and only allow trading of the strategy when the ADX is above a specific value.
For 15m, 1H, and 45m
we utilize the RSI crossovers of overbought and oversold and use the RSI moving average to filter trades. The thesis is we detect overbought for long and oversold for short.
For each strategy we use additional filters such as Bull Bear Power, Volume Flow, and Open Interest calculations to simply validate a trade.
Automatic Mode
In automatic mode, we detect your timeframe and current coin chart to decide one of the strategies from our database. If you want to manually select a different strategy or try the strategies on different cryptocurrencies, you can disable automatic mode entirely.

SOPR Candles OscillatorThe Spent Output Profit Ratio (SOPR) is computed by dividing the realized value (in USD) divided by the value at creation (USD) of a spent output. Or simply: price sold / price paid. This metric was created by Renato Shirakashi.
The indicator provides insight into macro market sentiment, profitability and losses taken over a particular time-frame. It reflects the degree of realized profit for all coins moved on-chain.
SOPR is measured by taking the ratio between the fiat value at the time of UTXO creation, and the fiat value when the UTXO is spent.
In this indicator, I have essentially created an index that measures SOPR value on any given day. This is visually displayed as an oscillator.
SOPR values greater than 0 implies that the coins moved that day are, on average, selling at a profit (price sold is greater than the price paid).
SOPR value less than 0 implies that the coins moved that day are, on average, selling at a loss (price sold is less than the price paid).
You have the ability to see the SOPR of BTC , ETH and LTC. You can also smooth the SOPR using an EMA or SMA of your choice. I have added colored bars to the chart to make it easier to visualize SOPR and it's relation to price action.
Thank you to both TradingView and Glassnode for adding all the on-chain data.

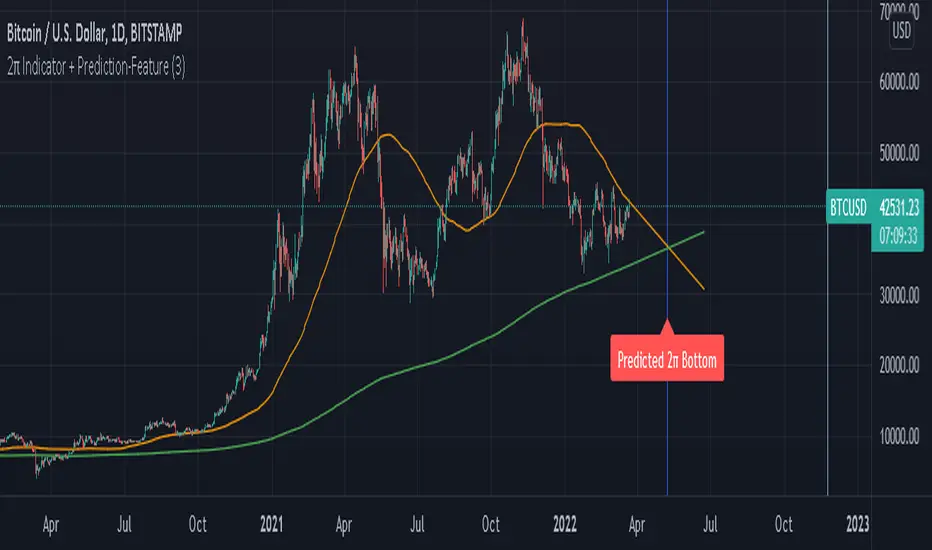
2π Indicator including Prediction-FeaturePI Cycle indicator is very good on finding potential tops.
PI cycle uses the 350MA/111MA which equals around 3,14
Using the 700MA its very obvious that we can spot potential Bottoms.
We are also using the 111MA, so 700MA/111MA equals to 6,30 which is ~ 2π.
I also built in a Prediction feature so we could speculate on a potential Bottom in the future.
Obviously the prediction might change over time if price is more volatily it changes the outcome.
Use Daily chart for best results.
ETH Gravity OscillatorThis indicator is a deviation of a Center of Gravity Oscillator corrected for the diminishing returns of Ethereum.
I've set up this indicator for it to be used on the weekly timeframe . The indicator oscillates between 0 and 10, where 0 indicates oversold conditions and 10 indicates overbought conditions. What is interesting is that it is not particularly ideal for identifying market cycle tops, but generally picks out the most euphoric region in the initial parabolic rally. Good to potentially keep in mind if there is a second bounce to the peak!
The indicator plots in any ETH charts. It paints in all time frames, but Weekly time frame is the correct one to interpret the 'official' read of it.
Made at the request of a kind commenter. If you would like to request different derivations of this script be sure to let me know!

[Joy] AladdinDirectly used for entertainment purposes in figuring out the market trend:
Sell/bearish sign: I open a short position on the candle's close. I am bearish on the instrument.
Buy/bullish sign: I open a long position on the candle's close. I am bullish on the instrument.
Red circle: If I run a long position, I take at least 50% unrealized profit into a realized profit on the close candle. I might even convert some portion of the underlying spot into stable coins. I am essentially taking profit along the way as the trend is developing.
Green circle: If I am running a bearish short position, I take at least 50% unrealized profit into a realized profit on the candle's close. I am essentially taking profit along the way as the trend is developing.
Below are used for indications only:
Down Arrows: It is not directly used in opening/closing positions. When the down arrow finishes and the candle close, it sometimes indicates a local top. It does not mean the macro trend has changed.
Up Arrows: It is not directly used in opening/closing positions. When the up arrow finishes and the candle close, it sometimes indicates a local bottom. It does not mean the macro trend has changed.
Red Crosses: It indicates a squeeze may be incoming. When the red crosses finish, the price may move significantly in any one direction. It does not say which direction. It only gives me caution.
Experimental - Below Work in Progress may be from the config only:
>> Jasmine - Tweak of Aladdin
>> Candle color - Logic is different from Aladdin
>> Background color - Logic is different from Aladdin
FAQs
Q: Does it use some EMA /MA/Ichimoku/Parabolic SAR, etc? Does it use any indicator with tweaked settings?
Answer: No.
Q: What does it mostly use?
Answer: Volume and gradual flow of non-interrupted data. The logic depends on the correlation between volume , price bars and the wicks.
Q: Can you make it free or make it open source?
Answer: There is no free lunch in this world. I will never reveal or share the source code or make it free for all!
Q: Do you provide ongoing support for the indicator?
Answer: Yes, I will continue updating the indicator as long as I can. However it depends entirely on me. I may stop updating as well.
Q: Are the bullish /buy & the bearish /sell markers automatic?
Answer: Yes. I do not control it!
Q: Is this financial advice?
Answer: Any views expressed by the indicator are personal entertainment views & shouldn't form a basis for making investment decisions, nor be construed as a recommendation or advice to engage in investment transactions. It is not financial advice. I highly recommend not even think of using this for actual real-life trading with real money. Neither I nor the indicator is responsible for any misuses, including any profit/loss. There is no warranty on this entertainment product

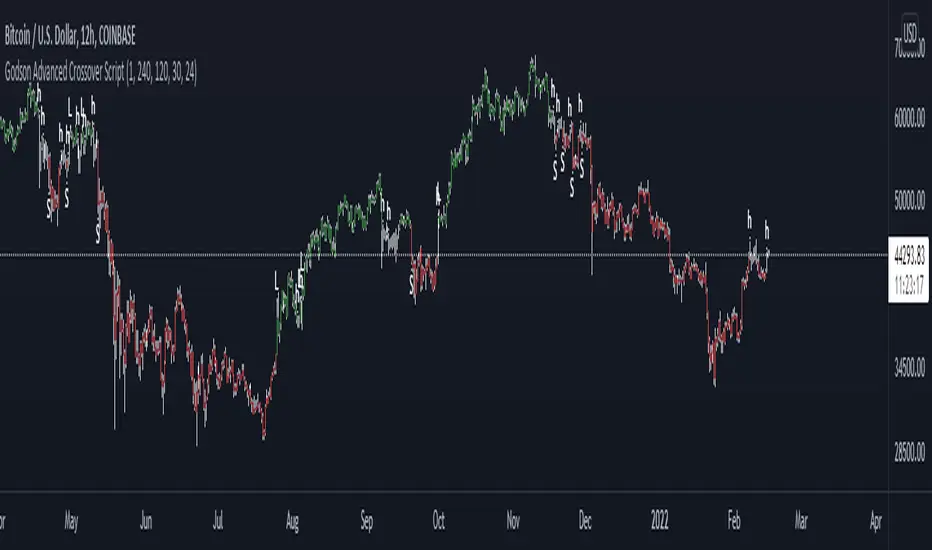
Godson Advanced Crossover ScriptThe Godson Advanced Crossover Script is advanced because it does two things
1: as a trend following indicator the script uses 2 VWAP ema's offset by 1 day(this is adjustable) and an ATR upper and lower band to find entries into larger trends.
2: it also allows you to setup alerts on a lower timeframe that follow a higher timeframe for example, if the 12hr is bearish(candles are red), you can trade shorts only in the 15min timeframe.
The script produces 3 signals
L: this is a long signal, this is signaled when the ema's crossover and the candle breakouts of the ATR bands, if the signal agrees with the upper trend
S: this is a short signal, it signals when the ema's crossunder and the candle breaks down of the ATR bands, if the signal agrees with the upper trend
H: this is for anything in-between, A is for apple, H is for Hedge.
you can set the upper trend timeframe to the same as the lower trend if you want all signals to alert
you can also turn the lines on or off if you need to visualize things
i will update this script as we progress
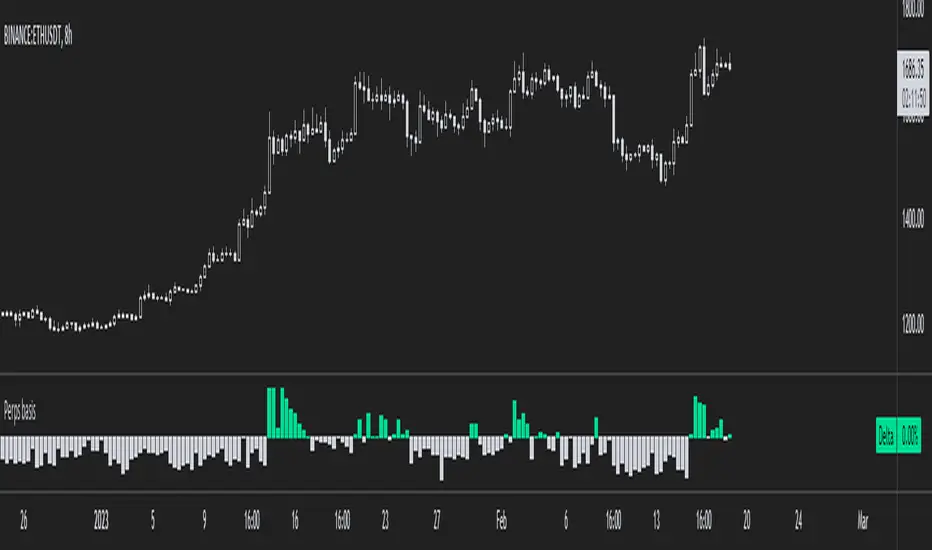
Ethereum Perpetual Swaps BasisThis is a simplified version of my Aggregated Perpetual Swaps Basis script.
Click the image to see more details on that indicator.
This version works only for ethereum (the older script works for BTC and ETH) and a bunch of code has been trimmed down.
The purpose of this is to make the indicator a lot faster .
When I published the old one I noticed that it always took a long time to load which is incredibly frustrating to me.
I guess I propped too much stuff in one indicator.
So that's why I'm basically cutting it up into two, more code efficient pieces, but it does the same thing.
People who have access to the old indicator will also get access to this one.
Here's a list of contracts that I used to make the perps and spot indices.
These will be updated if needed (in case an exchange loses relevancy for example).
Perps:
Binance USDT margin
Binance coin margin
Bybit USDT margin
Bybit coin margin
FTX perp
Spot:
Coinbase USD
Bitfinex USD
FTX USD
Binance USDT
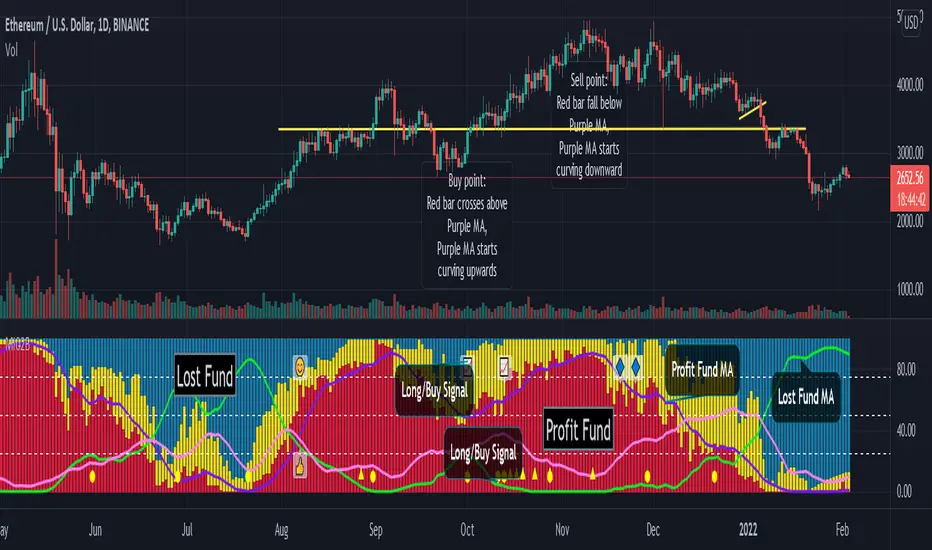
Smart Money Flow Pro (Dual Mode: MCD & MCDX) MI02bSmart Money Flow Pro (MI02b) indicator shows Buyer / Seller activities by calculating series of Price & Volume data, over a certain period of time.
It analyses Institutional fund possible behavior from the pool of data derived from price volume movement every trading day.
RED bar represents percentage of stock holders are currently in profit.
Purple line is RED bar's moving average.
Green bar represents percentage of stock holders are currently in loss.
Lime Green line is Green bar's moving average.
Yellow bar represents percentage of daily traders (buy & sell at the same day).
Pink line is Yellow bar's moving average.
RED bar > 50% shows institution fund has in control, uptrend is likely easier to continue.
BLUE bar > 50% shows retailer fund is stucked inside, downtrend is likely easier to continue.
Crossing of moving average lines indicates changing of trend (reversal sign):
1) Purple line up-crossed Green line - UPTREND
2) Green line up-crossed Purple line - DOWNTREND
Smart Money Flow Pro includes 6 Long/Buy signals (🔺, ⭕️, 👍, 😊, 📈, 🔷)
Each signals comes with individual alert setting.
Disclaimer:
This script indicator is solely for the purpose of education / opinion sharing only, and should not be construed as investment advice or recommendations to buy or sell any security.
Get your trade advise from a legit broker, you are responsible on your own trade.
Thank you.
CRC.i Bollinger Bands ®This script is yet another variant of the famous Bollinger Bands® TA tool used to track price volatility as it deviates from the mean of a security using standard deviations (positive &negative). Built for my own personal preferences. But perhaps you might like it, too.
Includes
+ Chart Lines: price, upper and lower bands
+ User Options: SMA length, stdev value
+ Heads up Display (HUD) with TARGET's and other related stats
Bugs? Comments? Requests? Ping me @calmrat

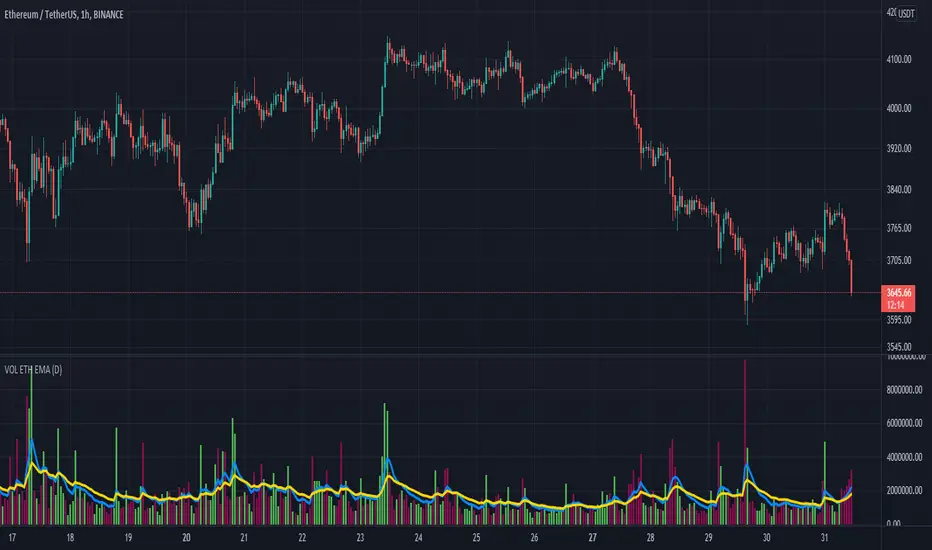
Performante's Average Ethereum Volume Indicator EMAThis indicator takes the volume from the biggest exchanges and plots the average volume. Exchanges incorporated in this average include Bitfinex, Coinbase, Bitstamp, Bitmex, Kraken, Binance, Bithumb, Flyer, OkEx, and CEX. The chart also has two Exponential Moving Averages (9-candle EMA & 21-candle EMA) added onto the volume pane to better understand relative volume. Thank you Julio and Mitch for this indicator
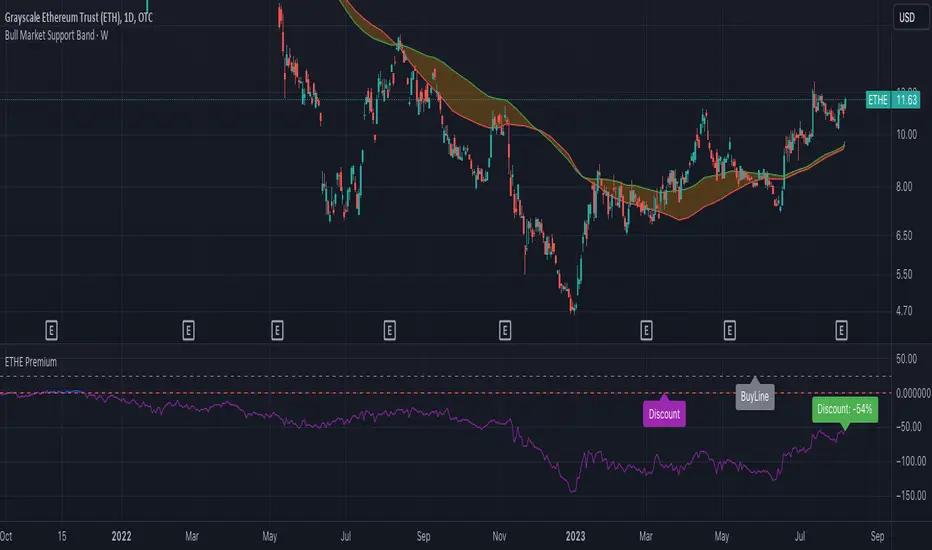
ETHE PremiumShows the premium/discount for Grayscale ETHE vs. the fractional amount of ETH per share held.
Triple CSWhat this indicator does:
This indicator will be scanning for ranges of extremity.
It measures multiple underlying factors in the financial markets like measuring levels of strength using RSI, momentum using Stochastics and extreme ranges using Bollinger Bands.
What is "extreme range" criteria: ranges above 70 or below 30 on RSI and Stoch are considered extreme, as well as moments of extreme volatility exceeding overbought and oversold levels on BBs.
All monitored data is to be plotted in a horizontal row, providing information about oversold, overbought and mid-range market conditions. This data will either meet the criteria simultaneously and plot a Red or Green indication or it will miss one or more requirements, plotting Gray indications.
This indicator is a real-time indicator, meaning it's updating live and due to this tracking in real-time, indications not yet 'printed' can give false readings. For performance purposes, it is best practice to allow all indication plots to 'print', meaning if a plot ever changes in color, it's best to allow that candle to fully close , ticking to 0:00 before confirming the accuracy of the indicator's findings.
How it works:
This indicator scans multiple sources of data simultaneously. When appropriate conditions within a trading range are met, the indicator will update it's color.
The indicator will plot Gray , Green , and Red indications which can be explained below.
-
Grey plots : No indication of full extremity, meaning one or more conditions being tracked has not met requirements, suggesting price is likely in mid-range.
-
Green plots : Extremity level lows have been simultaneously met, data indicates extreme oversold conditions are likely present.
-
Red plots : Extremity level highs have been simultaneously met, data indicates extreme overbought conditions are likely present.
What market will this indicator work on?
Stocks > Forex > Crypto
All the above are supported by this indicator.
Charts with more history have more data for the indicator to utilize. (Lack of data can result in poor performance.)
- This indicator performs best on 4H, 12H, D, and W timeframes, although you can use this indicator on any timeframe TradingView supports.
This indicator was created to find ranges of extreme trade which can help traders be more confident in their timing with the market.
Trading can be difficult, let an algorithm scan the market and monitor for early signs of volatility changes.
Past performance does not guarantee future results. Please do your due diligence when placing trades.

NSDT Fracking CryptoThis indicator is part of our Fracking series of indicators and is specifically designed for scalping Crypto. It looks for a particular price action pattern/sequence then displays levels and a label on the chart to show a potential entry, target, and stop based on that analysis. Basically enter long through the green zones and short through the red zones. The target levels are not guaranteed to be hit, but are a good guide with high potential. Pivot Point levels were added for additional confirmation of potential key levels.
Trading is risking and you can lose money. Trade at your own discretion and risk. This indicator is only providing potential scalping zones based on recent price action.

Dominion - Bitcoin Altcoin Dominance [mutantdog]A simple and easy reference tool displaying a plot of the market cap dominance values for several significant cryptocurrencies.
The most widely used of these is bitcoin dominance (the top indicator shown above) which calculates the total market cap of bitcoin in relation to the total cryptocurrency market cap, displayed as a percentage. This is commonly used by traders to assess the strength of bitcoin in relation to the broader crypto market; increasing values being indicative of larger bitcoin moves and decreasing values often indicative of potential altcoin cycles. Likewise, ethereum dominance (the bottom indicator shown above) is frequently used as a means to indicate the strength of ethereum in relation to the broader crypto market.
Included options for marketcap dominance values are:
Bitcoin : CRYPTOCAP:BTC.D
Ethereum : CRYPTOCAP:ETH.D
Total DeFi (a composite of multiple top defi tokens): CRYPTOCAP:TOTALDEFI.D
Stablecoins (shows the combined dominance values for usdt and usdc): CRYPTOCAP:USDT.D + CRYPTOCAP:USDC.D
Flippening (shows the difference between bitcoin and ethereum dominance values): CRYPTOCAP:BTC.D - CRYPTOCAP:ETH.D
When used in combination with each other, these can provide a good overview of the general flow of capital within the crypto market.
Additional functionality:
up to three optional moving averages with a choice of SMA, EMA, WMA and RMA for each.
multi timeframe selector
alert condition presets for various moving average crosses.
Please be aware that, while useful as reference, dominance calculations are known to repaint frequently. As such the use of this indicator and its alerts should require caution.

WaveTecs StrategyWelcome to the Backtesting version of "WaveTecs Strategy", the indicator itself is an invite-only script called "WaveTecs Indicator" on TradingView.
WaveTecs Strategy
WaveTecs is a Strategy that combines Wave Trend Oscillator and verifies wave momentum by using RSI and Stochastic Oscillator Values.
What is Wave Trend?
One of the most effective indicators in identifying swings is the Wave Trend indicator. Wave Trend plots waves using highs and lows between an upper band and a lower band. It looks for the opening and closing of a new wave trend movement as well as overbought and oversold areas.
How does this modified strategy work?
By using RSI and Stochastic values we are able to verify Wave inflection points to determine if there is a suitable amount of momentum to ride the swing and make profitable trades. Positions are taken or closed based on the rising or falling momentum.
Each value input can be adjusted to best suit the type of market you are trading in. By using the strategy we can optimize these value inputs to yield greater net profits. I have found the RSI and Stochastic values hugely impact entries and exits regarding trades.
For Long conditions:
- RSI & Stochastic needs to be increasing and moving out of oversold conditions to show positive momentum.
- Falling momentum results in a sell signal. I have found RSI less than 65 to be sufficient in most markets however this can be adjusted at any time to yield different results depending on your comfort level.
For Short conditions:
- RSI & Stochastic needs to be decreasing and moving out of overbought conditions to show negative momentum.
Generally, Wave Trend Strategies only take trades that are outside of the bands. This strategy allows trades inside and outside of the bands, which can be selected under the input section title "Aggressive Trading". Trading in this mode is more frequent as signals are often. Due to volatility in crypto markets, I have defaulted the source for Wave Trend waves to be Open/High/Low/Close Average which yielded great results. High/Low/Close average works very well for all other securities, and can easily be adjusted through the drop-down menu inside the inputs.
Works for all types of markets. Parameters can be adjusted but not required as indicator values are standard in the industry.
The default parameters are set to those typically used in the markets currently. However, I have found that if you adjust you to adjust the parameters based on your asset and time frame desired you will yield different results.
----------------
For example:
----------------
ETHUSDT - 4 HR, results are shown below
Wave Trend Parameters:
Aggressive Trading: Yes
Channel Length: 12
Average Length: 24
Overbought Top: 90
Overbought Bottom: 75
Oversold Bottom: -90
Oversold Top: -55
Source: hlc3
Strategy Type:
Trade Direction: Long Only
Stochastic Inputs:
Stoch Length: 18
Smoother %K: 5
Moving Average %K: 4
%K Lower Limit: 21
%K Upper Limit: 80
%K Crossunder Sell: 80
Relative Strength Index Inputs:
RSI Lower Limit: 30
RSI Upper Limit: 70
RSI Sell Value: 68
==================
WaveTecs Features
==================
Profitable Trading Strategy;
Aggressive Trading feature for more trades, with earlier entries and exits;
Customizable inputs to fine-tune your trades;
Buy & Sell Alerts (Indicator Only);
Overlay indicator only to show alerts, WaveTecs Strategy needed to see Wave Trend;
Bot Integration through webhooks;
Two different strategy modes: Long Trades Only or Long & Short Trades
Adding new features & updates whenever possible.
Add both WaveTecs Indicator and WaveTecs Strategy to your chart. WaveTecs Indicator only plots Buy & Sell Alerts, whereas WaveTecs Strategy lets you see what the strategy is doing.

MyAggVolumeETHAggregated spot ETH volume.
Color coded by high or lower volume.
Includes indication of X periods (100) High volume and lowest volume.
supertrend strategyHI,
today I have finished to study another strategy, this time I have done a supertrend with a positive backtest untill 2015 in ETH / BTC pair.
It is very simple to understand and there are only 4 parameters:
The first 2 parameters are about supertrend u can change it as u want.
The last 2 parameters are about trailing stop and target profit, personally I use target 9.6% and trail 8%.
That's all, this is a very simple and profittable strategy.
My personal setting are 4,7,8,9.6
For info write me in private
Please press like, comment or follow :)
