Ethereum (Mata Wang Kripto)
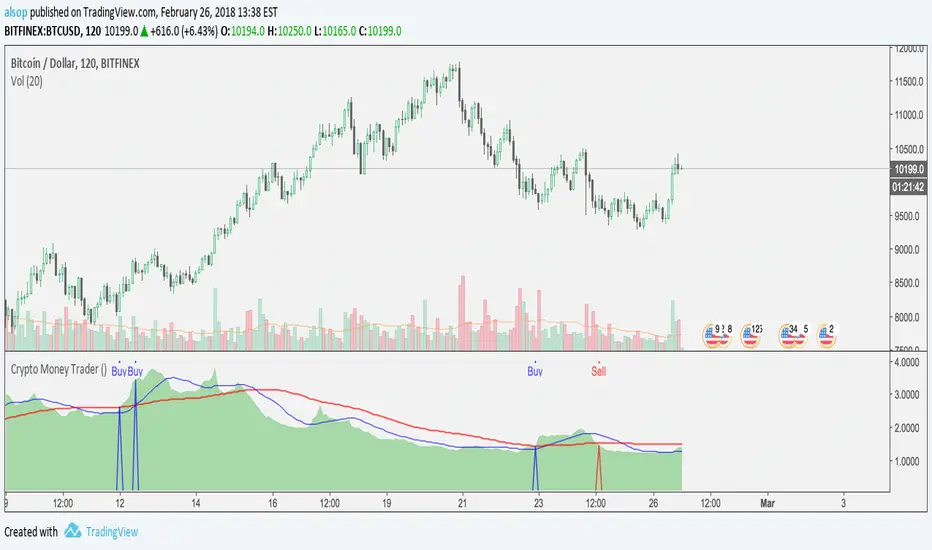
Crypto Money Trader - Indicator for Buy and Sell SignalsThis is it... the one that many have been waiting for.
We have taken everything we have learned from the Crypto Money Index and Crypto Money Bot and combined it into the best indicator possible for trading crypto currencies. This version also includes logic for shorts (sell) and another criteria for longs (buys).
The code is cleaner as well so there is less signal noise and more precise entries.
Before we released this script, we did backtesting on all the current supported USD pairs for optimal results.
Here is one set of results for BTC on 2 hour chats using $5,000 starting balance, 1 trade at once maximum, and 1 contract size:
www.cryptosignalsbot.com
Net Profit: $25,582, 511.64%
Total Trades: 17
Percent Profitable: 70.59%
Profit Factor: 4.304
Maximum Downdraw: $6,629
AvgTrade: $1,504.82, 30.1%
These results get even crazier when you get into settings where you can have 4 trades at once - beyond 700% return... crazy...
The indicator also includes alerts that you can setup so you are aware when a Buy or Sell signal is triggered. Just set an indicator alert for the Trigger Buy or Trigger Sell greater then a value of 0 and you will always know when it is time to look at the charts.
--== STRATEGY ==--
You can combine this indicator with other indicators in your strategy. Many of our most successful users of our previous scripts do just that as it helps them tune a perfect time for an entry.
Personally, we use the indicator and simple trendline entries. When a Buy or Sell triggers, draw a trendline and support / resistance lines and enter on a breakout. That's it.
Please note: this is not a "buy it or sell it now" kind of indicator. Sometimes it will signal a few hours early before a move.
--== SUPPORTED PAIRS ==--
We are always adding pairs, but as of February, 2018 this is our supported USD based pairs: BTC, ETH, LTC, XRP, NEO, BCH, IOT, EOS, BTG, ETC, ETP, OMG, EDO, ZEC, XMR, TRX, SAN, DSH, SNG
--== TELEGRAM CHANNEL ==--
All subscribers to this indicator will get access to our Exclusive Telegram Group where all the signals are analyzed and posted for you to see how we are playing the calls. You can either use this to learn how we use the indicator, or to trade from (at your own risk of course).
The alerts are all posted in this channel automatically and only the timeframes with the highest returns from extensive backtests are posted here automatically. However, we will sometimes post analysis on other timeframes as well.
--== BONUS ==--
As a subscriber, not only do you get this amazing indicator, but as a subscriber you will get access to our Crypto Money Index and the Crypto Money Bot
--== ACCESS ==--
Access is simple, go to our new website and register: Crypto Signals Bot
We will work to get you access to everything as quickly as possible. If you have any issues or questions, use the contact form on the website.
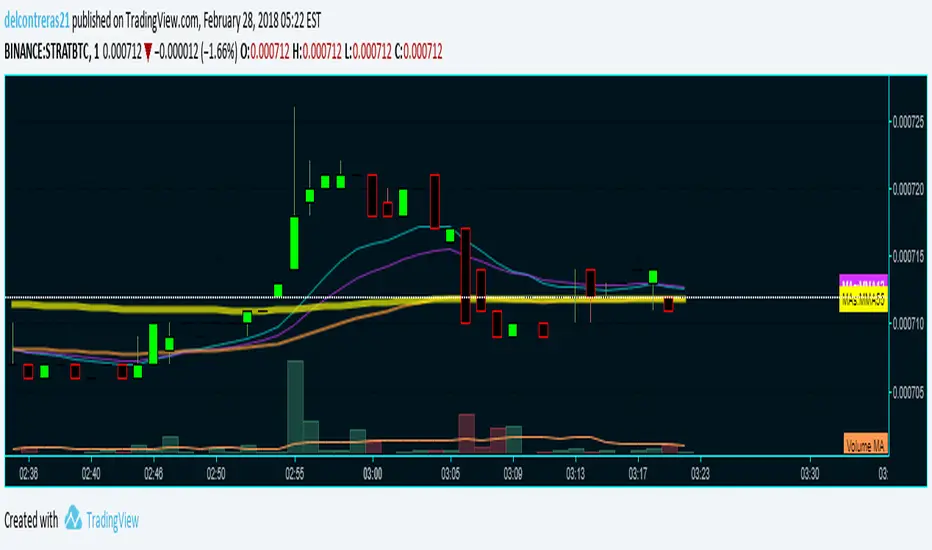
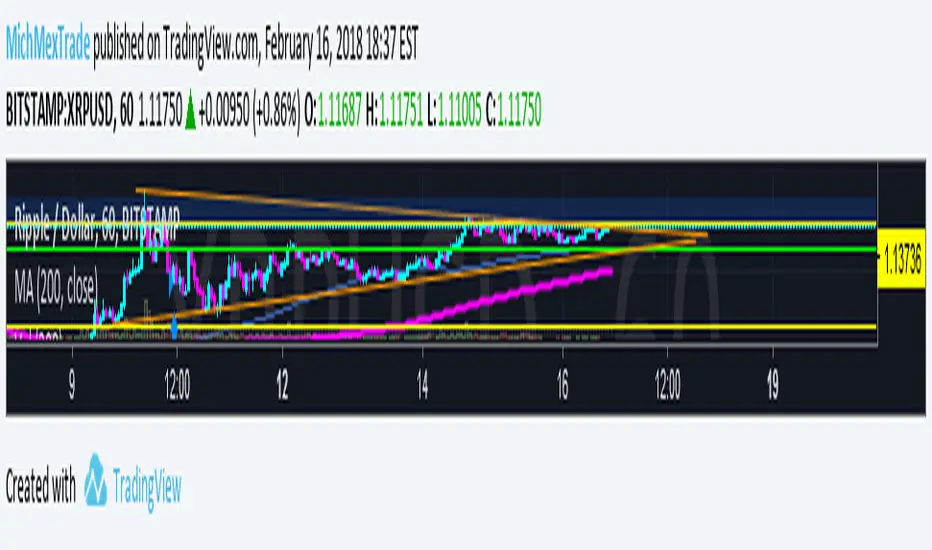
MA Cross CriptoEXLSimple Buy and Sell indicator for Cryuptos
Works way better:
XRPUSD - H1
BTCUSD - H4
ETHUSD - H4
With enough patience this indicator can make you good money!
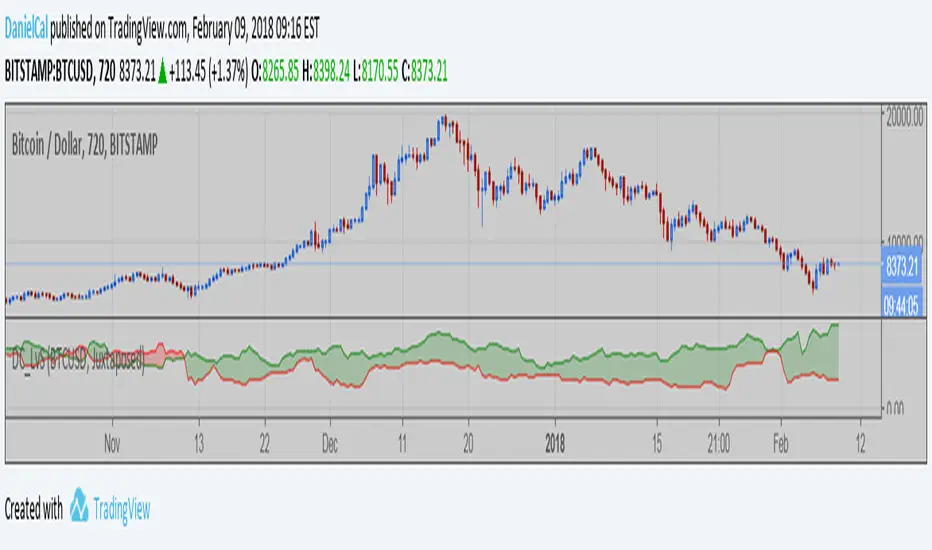
Margin Longs vs Shorts for BTC ETH & all Bitfinex pairs
Two modes of use...
a) The script detect chart symbol and show corresponding Bitfinex Longs & Shorts (if data exist).
b) You select BTCUSD or ETHUSD Bitfinex Longs & Shorts to show on any chart.
Two comparison views...
a) Juxtaposed: longs and shorts in same direction, side by side. (My preferred view)
b) Counterposed: longs and shorts in opposite polarity, separated by zero line. Another line is plotted representing the difference.
Crypto IchimokuIchimoku Cloud with settings recommended for crypto by trader IAmSatoshi. Includes a handy checkbox to double inputs, and alerts that can be set for when the price crosses the bottom or top of the cloud.
This script also includes an ichimoku signal count. The signal count is an UNWEIGHTED sum of positive or negative ichimoku signals with the greatest total being shown in either green(long>short) or red(short>long) or white(0, long==short). The signal count is only shown when their is a new signal or a signal is no longer valid.
If you use a major portion of the code please cite me. If you like the script and make a bunch of money using it, feel free to donate using the crypto addresses below.
BTC: 34uVepgjGJAKqf9i3mfdq8AG1dzTthjCgb
ETH: 0x71B15Beb6AF985853B5fC80205ddb3595C51B63e
LTC: MVzvSu53K5qPfjiQn4nk9D6WVLJKCMzXHJ
DASH: XoKVDBnhiyPvJeyRdpHjcWu1WtVjCbhP68
XMR: 46jnYGp7v5vCSAV8pzGXPbWM7YFiZNB4eaFCHsezitQ46KM1E6FgPM9ZaYJEfDVk5zdKoPQ7vw27ke34jMxERogvJDQhfQW

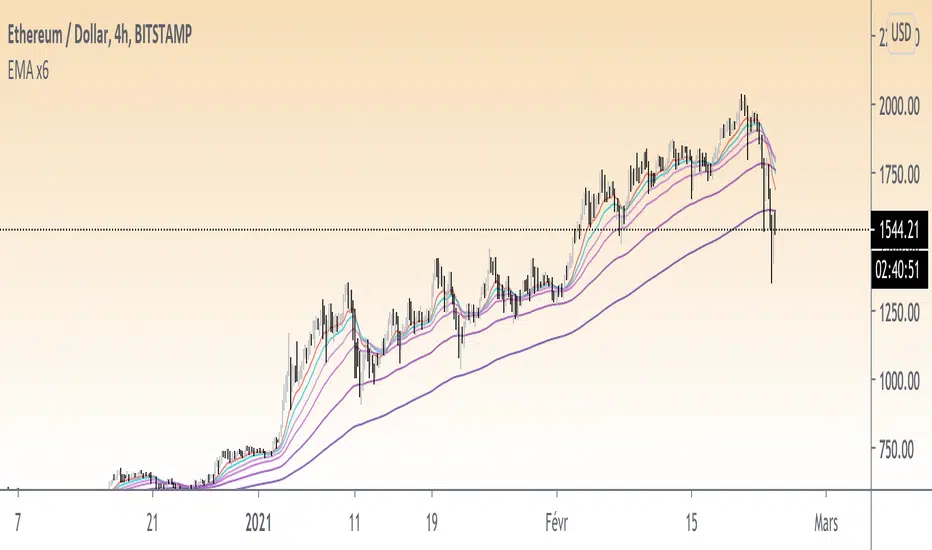
Multi EMAI really like to work with EMAs, but each time you use the "buit-in" one, you use one more slot in your indicators allowed.
So I built this simple one, 4 EMA in one indicator, and easy to use as following;
-displays 4 EMAs
-choose your EMA lenghts. bases are 20;50;100;200
-choose your color and other options as needed.
Hope you will enjoy it, and I will appreciate your feedback, and improvement suggestions.
Khaos-Crypto-TraderThis indicator has been developed to trade crypto-currencies, but can also be used to trade forex, stocks, and futures.
This Indicator is a full trading system that offers setups with Entries, Targets and Stops. This indicator is very accurate because it uses advanced setup detection and filtering logic.
The setup is triggered if the price passes the blue dot. Do not enter the trade unless price passes the blue dot. Each setup has 3 possible targets, which are dots colored green for longs and red for shorts.
The initial stop is the green square for longs, or the red square for shorts.
You can use the base-line (which is the dark blue line with dots) to manage the trade. One strategy would be if you enter a trade long, and reach the first target, you can take some profits, but still let the some of the position run, where a bar closing below the blue line, would stop out your remaining position.
To summarize:
Blue Dot = Entry Trigger
Green Dots = Long Targets (3 of them, for different price targets: target 1, 2 and 3)
Green Square = Long Stop Price
Red Dots = Short Targets (3 of them, for different price targets: target 1, 2 and 3)
Red Square = Short Stop Price
The great thing about this indicator is that its universal, there are no settings necessary -- just put it on the chart and it finds high probability setups and paints it on the chart as they occur. There is NO Repainting with this indicator.
Of course, you can add other indicators if you wish, and even add this indicator to your existing trading system.
Again, this indicator does NOT repaint.
Once a setup is found, the indicator draws the targets and stop at the setup bar close.
Setup Alerts are fully supported, via email, sms, and desktop notification.
LEGAL STUFF:
Risk Disclosure
Futures , forex, stock, crypto and derivative trading contains substantial risk and is not for every investor. An investor could potentially lose all or more than the initial investment. Risk capital is money that can be lost without jeopardizing ones’ financial security or life style. Only risk capital should be used for trading and only those with sufficient risk capital should consider trading. Past performance is not necessarily indicative of future results
Hypothetical Performance Disclosure
Hypothetical performance results have many inherent limitations, some of which are described below. no representation is being made that any account will or is likely to achieve profits or losses similar to those shown; in fact, there are frequently sharp differences between hypothetical performance results and the actual results subsequently achieved by any particular trading program. One of the limitations of hypothetical performance results is that they are generally prepared with the benefit of hindsight. In addition, hypothetical trading does not involve financial risk, and no hypothetical trading record can completely account for the impact of financial risk of actual trading. for example, the ability to withstand losses or to adhere to a particular trading program in spite of trading losses are material points which can also adversely affect actual trading results. There are numerous other factors related to the markets in general or to the implementation of any specific trading program which cannot be fully accounted for in the preparation of hypothetical performance results and all which can adversely affect trading results

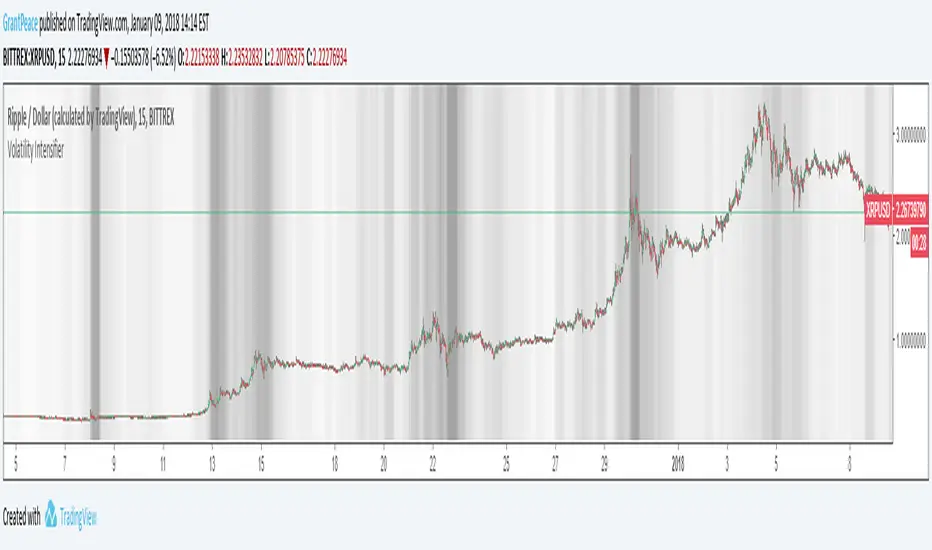
Volatility IntensifierThe background becomes increasingly dark during periods of high volatility.
...and yes, it can get completely black!
This makes it easier to identify areas that are "hot" with price action and appealing to trade.
Follow and comment to be added to the access to this indicator granted every Monday.
Like for more indicators! Thanks to all of my followers, you are the real MVP <3
To clarify; No, this indicator is based off of volatility, NOT volume :)
Bias Indicator (BI) 乖離率What is the Bias Indicator (BI)?
The Bias Indicator is basically based on the share price opening range

CMARSI Strategy (on ETHUSD) Seems working goodthere it is, it's using the Connor RSI with little variations.
C onnor M oving A verage RSI

Best Holy Grail Indicator V3Thanks to everyone that has been contacting me about the holy grail project, your comments and feedback have made this project much more rewarding. I'm excited for your further feedback. Here is Version 3.
How to use:
At the heart of this projects is a new kind of moving average that I have been developing. As such it is reasonable to think of these lines as highly enhanced and finely tuned moving averages. Their slopes, crossovers, spreads, and behaviors are all meaningful, just as in other moving averages. What is special about these is that if you trade their price crossovers, it almost never generates a real loss, just consistent profits. In trending markets these lines can give you all you need to know about trend entry/exit and details inbetween, effectively letting you get in/out at the top/bottom. In a ranging market they will show you ideal lines of mean reversion, and how to play them.
Description (Upgrades from V2), there are 3 huge improvements from V2:
1) It follows the price better: In the inputs window there is now a box called “Responsiveness”, it can have values from 0 to 5. At 0 Version 3 looks a lot like V2. When you turn up the responsiveness the lines follow closer when they should, and repel themselves when they should be distant. Unfortunately the lines are no longer as smooth, but it isn’t much of a problem. When you turn this up the lines can generate losses if you blindly use the crossover, this is because the slopes of these lines now have more meaning as they focus on the trend, and not how price moves right around it. This can also give very powerful signals if all 5 lines crossover in the same place. Mess with it.
2) There are too many neutral entries: Now every trade can be closed profitably! I posted an idea a few weeks back about “smart execution traces”, it is an intelligently suggested stop loss. The way you set it is in the inputs window at “Smart Execution Baseline”. If you are using crossover signals from Line 4, then set this to 4, if you use line 3 then set it to 3, ect… Unfortunately the lines are also not so smooth, but this can be a very helpful tool. If you play with it you can easily get a feeling for it.
3) Flipping between timeframes is now easier: Here you can bring a line in from another time frame. In the input window there is a box “Line from other timeframe?”. Here you can select the line you are interested in. Next you have to choose which timeframe you are interested it, you can choose this in the “timeframe multiplier” box. This multiplies you current time frame to get the desired one. If you are on the hourly charts and are interest in line 4 on the 6 hour charts, you first choose line 4, then in the timeframe multiplier you enter 6 to see the 6 hour red line in the 1 hour time frame. Likewise if you are still in the 1 hour and want to see the 15 minute red line, simply multiply by 0.25 (which is 1/4). Due to the limitations of pinescript it is easier to see smaller timeframes, getting a higher timeframe line requires more data. If you don’t want to consult another timeframe leave both of these at 0 to cut down on computational time.
After enough inquiries, the source code is now for sale.
If you are making money with this system and want to share it, here are my addresses. If you donated and want to see some of the indicators I am currently working on just message me so I can privately tag you in.
ETH: 0xcf1ca127d9cefb5efbe9557fa09a05cf4daea6c1
ZEC: t1dSFhH9jkG1z9AdGA27e2UqCMLdA2Y1or1
LTC: LQ1cssjU3dhqSa9K85ErqZYuRAPLfGKivA
BCH: 15zwnh2t2nM2bufnuPv12hJvJhFrU8iSFk
Please feel free to write in further questions in the comments below. Hope this makes some of you rich, happy trading!

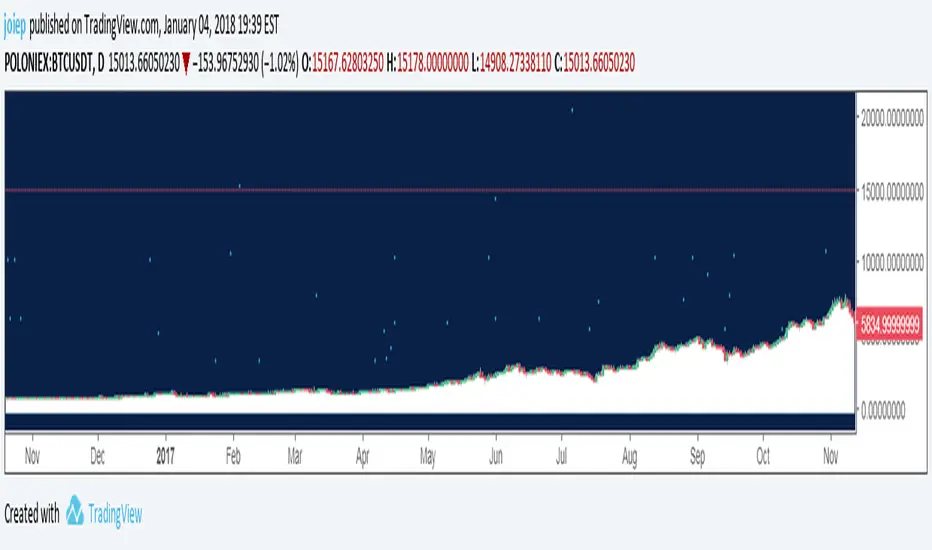
Cryptotutor CrossThe cryptotutors cross is a lagging indicator that can help detect a change in the trend. For example, it can help detecting an upwards or downwards movement of Bitcoin (on 1H), which can save you a lot of money when you are in altcoins.

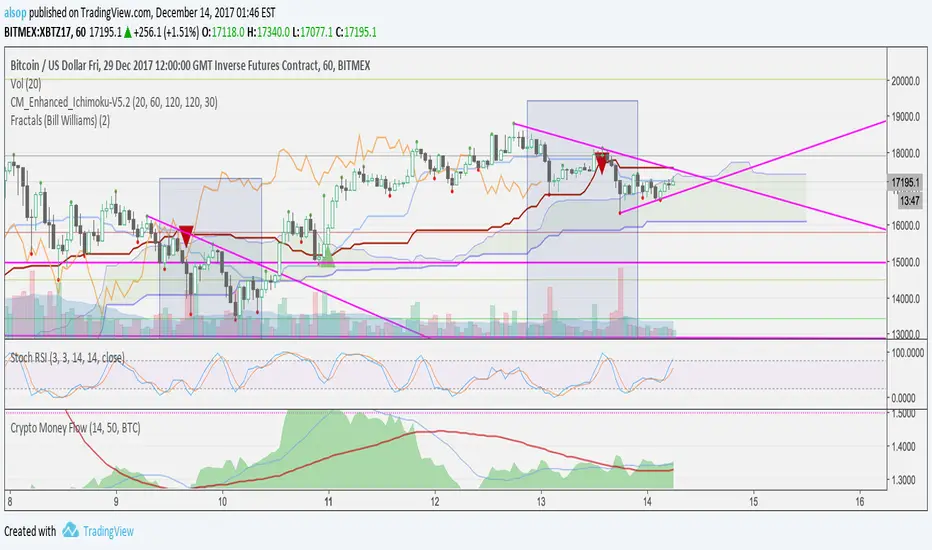
Crypto Money Flow RatioThis indicator shows you the movement of buyers and sellers in the market. Combined with other indicators like Stochastic RSI it can be a very powerful early indicator to buy and exit.
In this example, there are two moving averages applied to the indicator (at the bottom). Once the Fast crosses the Slow and the area is above both - this tells you the major market players are accumulating and you should be looking to long.
In addition, Stochastic RSI is also oversold and Ichimoku shows price above the cloud - all confluence on a long trade. As you can see, in the next hour price rocketed.
This size of move isn't always common, and this move may have been due to news. Even if so, people were aware and started buying and you could see it happen.
Another example here with DASH.
In this example, you can see there was a previous bull move that we applied a fib to and had a 38% retracement. We bought on the indicator cross and ratio above averages with a target of a 38% extension. It hit almost exactly and we closed out.
To apply this to other currencies, change the settings. For example, for ETHUSD - change the setting from BTC to ETH.
BITFINEX:BTCUSD
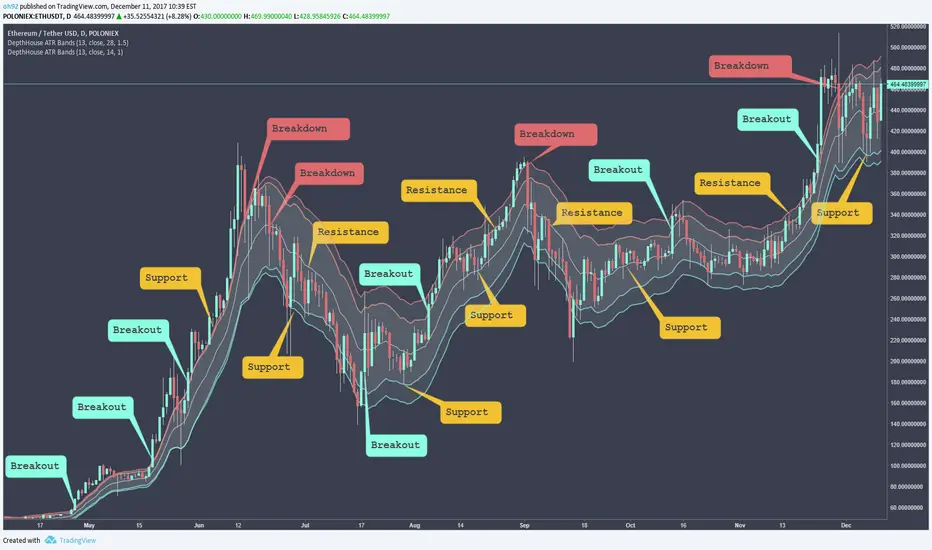
DepthHouse - ATR BandsDepthHouse ATR Bands is a FREE INDICATOR
Similar to the well-known Bollinger Bands.
Instead of using the standard deviation formula, ATR Bands determines the size of the bands based on the adjustable average range.
IF you use this FREE Indicator:
Please like and comment!
Check out my channel on YouTube! youtu.be
Bitcoin and Ethereum Donations are always appreciated :)
BTC : 1MLnVPqebcFTqYEVAKm9dSCRWhyNDmAb5W
ETH : 0xEEcD7Ce6E22AfA6083074c4CCd326Be0b1C932d9
How to use:
The bands tighten while the markets’ range becomes lower, and widens as its' range becomes broader. Giving the indicator a loaded spring effect.
A break outside of the bands in either direction indicates a possible breakout.
All 3 bands serve as possible support and/or resistance. Meaning breaks back into the bands could indicate a reversal, or end of the breakout.
This indicator is completely customizable, so compiling multiple sized bands on top of each other may create a strong competitive edge.
--
IF YOU SUBSCRIBED
This indicator was intended to be available for purchase Jan 2018.
However, with recent change of mind I have decided to make it free to use.
IF you previously subscribed. I greatly appreciate your interest and I hope you enjoy this now FREE indicator!
Once again, thank you!
DepthHouse - Moving Average ChannelsThe indicator Moving Average Channels was created for experimental purposes due to the parabolic moves BTC has made in the recent past.
How it works:
The basis, or center line, is a standard moving average that is set by the user.
The bands are then a customizable percentage of the basis.
Which based on the settings, could serve as possible support and resistance.
DepthHouse – Moving Average Channels has been published for you all to see and try for yourselves.
Maybe this indicator has uses elsewhere? If you find something feel free to post it in the comments below!
If you like this indicator, please drop a like or comment!
They are very much appreciated!
Be sure to go to my profile and check out my other indicators!

DepthHouse - MaxADX LayoverThis indicator takes our MaxADX a step further by giving possible trend change signals.
MaxADX combines directional information and smoothed moving averages to help traders indicate trend reversals and strengthening trends. As you can see in the chart above this indicator makes it very easy to spot trend reversals in trending markets.
How to use MaxADX Oscillator:
The top circles represent the immediate trend. Used as very early indication of trend changes and/or reversals
The solid line just below that represents the general trend direction. Green meaning up white red meaning down.
The histogram below that represents the general trend strength. A change in that indicate a reversal or a breakout in either direction.
The MaxADX Layover:
The layover then calculates three variables above, and determines the possible direction with symbols and/or bar colors which can easily be turned on or off.
Where this indicator falls short unfortunately, is its use in ranging markets.
Which leaves this as a great indicator for all beginners and professionals who prefer to trade in volatile markets such as cryptocurrencies.
This indicator will be free until January,1st 2018 – see how to get below
--
DepthHouse's MaxADX is 1 of 3 indicators that will be available for purchase via subscription come Jan 2018.
This indicator package will come with the following 3 indicators:
:: MaxADX ::
:: Premium oscillator to help spot forming trends and reversals.
:: MaxADX Signals ::
:: Taking MaxADX a step farther by creating an overlay that show possible trend strengthening and reversals via bar colors and shapes.
:: ATRBands ::
:: Like Bollinger Bands , this indicator is uses to help spot breakouts, and overbought/sold areas.
--
How to get:
To qualify for the trial period which ends January, 1st 2018, please go to the link in my bio and click subscribe!
You will then be sent directions for your account to be added to the whitelist.
If you have already subscribed, you will be added to the list shortly.
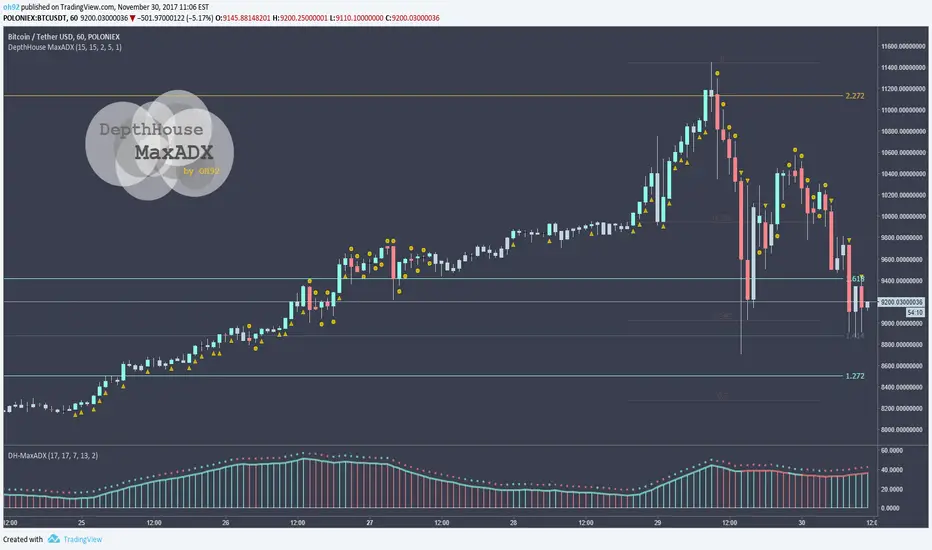
DepthHouse-MaxADXDepthHouse's MaxADX is 1 of 3 indicators that will be available for purchase via subscription come Jan 2018.
This indicator combines the use of directional information and smoothed moving averages to help traders indicate trend reversals and strengthening trends. As you can see in the chart above this indicator makes it very easy to spot trend reversals in trending markets.
Where this indicator falls short unfortunately, is its use in ranging markets.
This is a great indicator for all beginners and professionals who prefer to trade in volatile markets such as cryptocurrencies.
This indicator package will come with 3 indicators:
MaxADX
Premium oscillator to help spot forming trends and reversals.
MaxADX Signals
Taking MaxADX a step farther by creating an overlay that show possible trend strengthening and reversals via bar colors and shapes.
ATRBands
Like Bollinger Bands, this indicator is uses to help spot breakouts, and overbought/sold areas.
How to get:
To qualify for the trial period which ends January, 1st 2018, please go to the link in my bio and click subscribe!
You will then be sent directions for your account to be added to the whitelist.

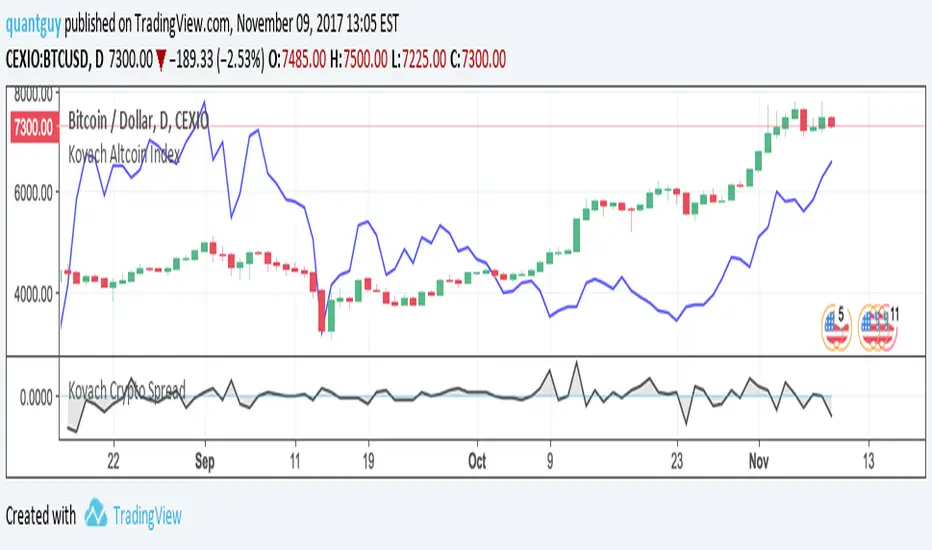
Kovach Altcoin IndexCombined with the Kovach Crypto Spread, these two indicators can help visualize asset flows from Bitcoin to Altcoins and vice versa. For example, now we have a bit of a pullback in Bitcoin due to the Segwit2x fork cancellation. We can clearly see, using the Altcoin index, that Altcoins are rallying from investors pulling out of Bitcoin.
This is further confirmed with the Kovach Crypto Spread indicator, which measures the spread in returns between Bitcoin and the top Altcoins.
Both of these scripts weight Altcoins proportional to their market capitalization, and this is updated weekly so that you constantly have up-to-date parameters, and the indicators adequately reflect the markets in real time.
Check out these indicators as well as the Kovach Momentum Indicators and the Reversals indicator at quantguy.net
The Love B♥tPrivate invite only script - currently "LIVE TESTING".
Back test results look great. Doesn't repaint. A lot of people might be saying, why use H.A. and all that and its not reliable etc.
The current testing you see of NEO is using 1% commission rate to account for the price difference and also the usual 0.25% commission rate.
Also, sometimes with H.A., you will buy lower than listed price or buy higher than listed price. However, with the testing I have done, it averages out.
I recommend using anywhere between 1-4 hour charts.
The strategy is using a combination of few different indicators along with moving averages.

Bitfinex ETH Margin traders- BitfinexAfter good reception of BTC Margin trader indicators, I present to you the ETH margin trader info for Bitfinex exchange.
Hope it helps people.

BFXLS - Compare styleDisplays BitFinex longs and shorts on your chart in the same was as if you add them by using TradingView's "compare" function - major advantage is that this works for all pairs that BitFinex supports without having to manually set up your chart each time.

Crypto-Adjusted Parabolic Stop and Reverse (CAPSAR)Finally, a more accurate PSAR is here!
This PSAR will show up , and stick around when a majority of the Crypto-Currencies in the index below conform in the same direction.
The CAPSAR can be applied to any Crypto-currency and ANY time-frame!
This Crypto-Index makes up over 90% of the Crypto-Currency market cap (total global Crypto investment).
Bitcoin
Ethereum
Bitcoin Cash
Ripple
Litecoin
Nemcoin
Thick Blue lines beneath the price indicate a change in direction, and momentum up.
Thick Red lines above the price indicate a change in direction, and momentum down.
This indicators holds three editable parameters:
1. "Start" - The starting value for the Acceleration Factor (.02 is the Default).
2. "Increment" = The increment in which the Acceleration Factor will move (.02 is Default).
3. "Max" - The maximum value of the Acceleration Factor (.20 is the Default)
