Momentum Percentage %A Percentage Momentum Indicator (oscillator) is a technical indicator which shows the trend direction and measures the pace of the price fluctuation by comparing current and past values. Normalized to be bounded to oscillate between 0 and 100 percent of recent price variation. As is, it average true range of an instrument can be easily compared to any other because of absolute percentage variation and not prices itselves.
The benefits of Percentage Momentum
It indicates volatility
It ideal to compare fluctuation and volatility between other assets
In assets that changes btw a large range of prices like crypto it's the best way to work with momentum.
It's the right way to work with algotrading.
Percentage

PercentagefromEMAEMA (Exponential moving average) often acts as dynamic support and resistance and trend detector and the further price is away from ema the more it has chance to reverse, hence percentage levels gives a range to exit your trades.
*choose your favourite timeframe and EMA length , alter percentages as you wish to generate Take profit levels
thank you..
Happy Trading.

Auto Support & Resistance From Option Strike Price + PercentagesAUTO SUPPORT AND RESISTANCE FROM OPTIONS STRIKE PRICES WITH PERCENTAGE GAPS
This is an auto support and resistance level indicator that uses options strike prices or psychological numbers as the relevant levels. Set your starting level or strike price and input the options strike price gaps for that ticker and 15 lines in either direction will automatically populate on the chart. It also has a table in the bottom right corner that tells you how far the current price is from the next closest support and resistance levels.
Everything is easily customizable in the indicator input settings including turning the lines on/off, turning the percentage gaps table on/off, setting the options strike price gaps, setting the starting level, setting the position of the percentage gaps table, changing support and resistance line colors all at once and updating the linewidth of all of the support and resistance lines at once.
***HOW TO USE***
First, go into the indicator settings and set the starting level to use. If you are trading SPY and it is near 450, then set your starting level at 450. If you are trading SQQQ and it is near 38, set your starting level to 38. If you are trading crypto, set your levels to the nearest psychological or round number such as 40,000 for BTC or 2,500 for ETH or 16.50 for LINK.
Second, set your options strike price gaps. If you are trading SPY, this will be 2.5. If you are trading SQQQ this number would be 1. If you are trading crypto, try using psychological price levels instead of strike prices, such as 500, 1000 or 5000 for BTC and 100, 250 or 500 for ETH. For small priced cryptos, use decimals such as .25, .50, etc.
Once these inputs are filled in, 15 levels in each direction will automatically populate on the chart for you.
If price is above a level, it will paint green. If price is below a level it will paint red. These colors represent support and resistance visually for you on the chart and will change dynamically as price moves above or below these levels. These colors can be customized in the indicator input settings to change all lines by only updating one color.
There is a table of percentage gap updates that will tell you in real time how far away the price is from the nearest support and resistance lines so you always know your risk to reward ratios. Each label will also be colored the same as the corresponding support or resistance line as a visual aid.
***MARKETS***
This indicator can be used as a signal on all markets, including stocks, crypto, futures and forex.
***TIMEFRAMES***
This support and resistance indicator can be used on all timeframes.
***TIPS***
Try using numerous indicators of ours on your chart so you can instantly see the bullish or bearish trend of multiple indicators in real time without having to analyze the data. Some of our favorites are our Auto Fibonacci, Directional Movement Index, Volume Profile, Momentum and Money Flow Index in combination with this auto support and resistance indicator. They all have real time Bullish and Bearish labels as well so you can immediately understand each indicator's trend.

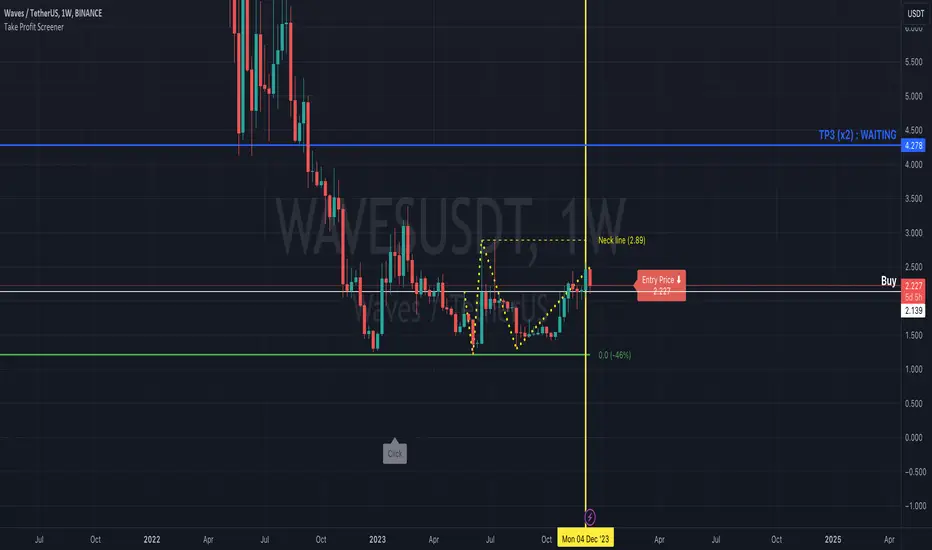
Take Profit ScreenerI'm going to introduce you to the Take Profit Screener tool.
It allows you to manually scan your watchlist to determine at a glance the assets that have the best profitability potential.
It is a 2 in 1 tool that allows you to :
identify where your Take Profit ratios are located whether you are in SHAD or Cycle Strategy
identify the potential reward percentages when approaching the key Fibonacci levels
Before you start using it, you need to:
sort your watchlist according to the price (Last) in order to have price ranges more or less close to each other when jumping from a symbol to another
disable the Auto Scale and Magnet feature
select your first symbol
display the tool (the indicator more exactly)
The settings dialog box is organised in 3 sections:
Strategy : By setting this section, you will answer the question " Where do my Take Profit ratios stand in relation to my entry price, and according to Risk Management Strategy adopted (SHAD or Cycle)? "
Fibonacci : By setting this section, you will answer the question " What percentage gain can I expect as I approach one of the key Fibonacci levels? "
Layout : This is the settings for the look and feel
Strategy Section
Active : This part of the indicator won't display on your chart if unchecked
Type : Choose between SHAD or Cycle Strategy. When choosing SHAD, you can select 2, 4, 8 or 16 SHAD Levels. When choosing Cycle, you can enter whatever ratio value you wish in the Strategy Ratio (Cycle only) input.
SHAD xNN : When choosing SHAD Strategy, you should select at least one level and more if need be.
Strategy Ratio (Cycle only) : When choosing Strategy Type Cycle, you can enter whatever ratio value you wish there.
Freeze Entry Price & Value : Leave it unchecked whenever the current price of the asset is located within your desired area (i.e. Reload Zone) while attempting to estimate its potential reward. Conversely, keep it checked whenever the current price of the asset is outside your desired area, but you need to anticipate the potential reward of this asset if its price reaches a certain level, your Entry price. Enter this price there and check the box.
Show price : If checked, both Take Profit ratio and Price are displayed. If unchecked, then price is hidden.
Extend Line : If checked, then lines showing Take Profit levels extend to the left.
Label Offset : If checked, then the label that displays Take Profit ratio and price shift to the right by a value that ranges from 0 to 100 candles.
Label Style : You can choose between Right or Top. This will determine the orientation of the label.
Fibonacci Section
Active : This part of the indicator won't display on your chart if unchecked
Type : Choose between SHAD or Cycle Strategy. When choosing SHAD, you can select 2, 4, 8 or 16 SHAD Levels. When choosing Cycle, you can enter whatever ratio value you wish in the Strategy Ratio (Cycle only) input.
SHAD xNN : When choosing SHAD Strategy, you should select at least one level and more if need be.
Strategy Ratio (Cycle only) : When choosing Strategy Type Cycle, you can enter whatever ratio value you wish there.
Freeze Entry Price : Leave it unchecked whenever the current price of the asset is located within your desired area (i.e. Reload Zone) while attempting to estimate its potential reward. Conversely, keep it checked whenever the current price of the asset is outside your desired area, but you need to anticipate the potential reward of this asset if its price reaches a certain level, your Entry price. Enter this price there and check the box.
Color : You can define the color of Fibonacci line levels
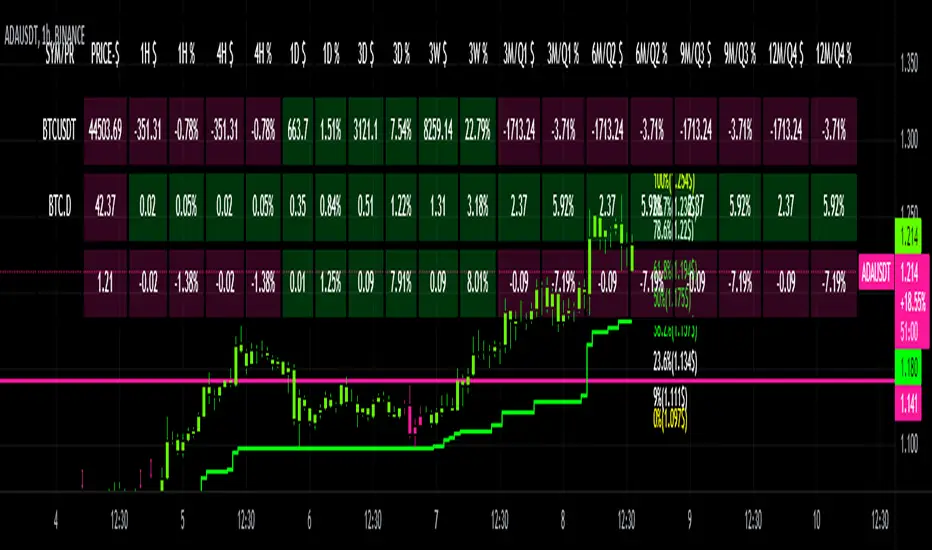
CRYPTO DASHBOARD Gs₿A Simple Crypto Dashboard/Screener which indicates the Price and percentage changes for the Given Period of time i.e for 1 Hr ,4 Hrs, 1 Day, 3 Days, 3 Weeks and 3 - 12 Months. By Default it displays #BTC and its Dominance and current trading pair Price and % changes.
Percentage Change ToolHere is a script that will allow you to see the percentage change from any entry to the current price. You will manually enter the price you bought at in the indicator price menu. The indicator will calculate and display the percentage difference(change) between the buy price and current price, in REAL TIME.
See Screenshot (TOP_RIGHT) for indicator.
Double Click on the Yellow Block and insert your entry price. Click OK. Indicator will display percentage.

Moving average percent measureit's just an average moving multiplied by a percentage. this is good for measuring the acceleration of price movements

Percentage Levels by TimeframePlots the positive and negative percentage levels from a selection of timeframes and sources for any ticker. You can use this within a pullback trading system. For example, if you historically look at the average pullback of large cap stocks and ETF's, you can use this indicator to plot the levels it could pullback to for an entry to go long. It can be used as potential targets when trading a ticker short. Another use for this is to backtest the set percentage targets using TradingView's bar replay feature to see how ETF's and large cap stocks have reacted at these levels. Note: This is intended to be used at timeframes equal to higher than the chart's as it may cause re-painting issues.
Currently percentage levels are statically set to 1, 3, 5, 10, 15, 20, 25, and 30% levels above and below the chosen source (open, high, low, close). You can also display the data based on timeframes from Daily (1D) all the way up to Yearly (12M)
*Not financial advice but in my opinion the current percentage levels set (see above) are best used for ETF's and Large Cap Stocks.
Jan 2
Release Notes: Added the ability to select the historical bars to look back when plotting levels
Jan 2
Release Notes: To get a better display or proper resolution on your charts, change the view settings to "Scale Price Chart Only"
Jan 2
Release Notes: To add % labels for this indicator on the price axis, change your chart settings to include "Indicator Name Label" & "Indicator Last Value". You can find this under the Label section after hitting the gear icon in the bottom right of your chart.
Jan 2
Release Notes: Added: Custom Line Plot Extension Settings. Ideally both values should be equal to display optimal extended lines. To return to a base setting: '1' = Historical Lookback & '0' = Offset Lines. Also note this is dependent on the timeframe you are viewing on the chart.
Jan 2
Release Notes: Removed indicator from example chart that was not needed.
Jan 2
Release Notes: Updated some comments in the Pine Script
Jan 2
Release Notes: Update: Added commentary and instructions in the indicator settings to address recommended line plot settings for Stocks/ETF's vs Futures
Jan 2
Release Notes: Changed title from "Calculation Method" to "Calculation Source"
Jan 4 2021
Normal use of security() dictates that it only be used at timeframes equal to or higher than the chart's as it may cause re-painting

[mdeacey] EMA% Channel + BB Range StrategyThis strategy is based off the users selection of an EMA and percentage defined channel. The strategy longs when a red "reversal candle" (that exceeds the averages of 3 and 9 above the EMA 3) is found until such time that either the price goes outside the Bollinger Band or the green reversal candle is found. The same but opposite process for shorts. If the price begins trending and moves outside the channel all trades are exited to prevent loss.
For trending markets the sister strategy (" EMA% Channel + Bollinger Band Trending Strategy") should instead be used.
The obvious fallback to this strategy is that:
- If the bands are too wide we don't have a good definition of trending vs ranging and the price can move up/down significantly and trend whilst remaining within the ranging channel. We try to mitigate this through use of a stoploss defined by ATR and a pretty tight channel. This is a tightrope exercise as making the percentage channels tighter misses earlier entries in optimal cases. Change the parameters to find an EMA and percentages to find the best R/R in your case.
Potential further iteration:
- It would be good to see if the R/R changes positively if we only allow shorts above the EMA and longs below it.
All options are configurable and code open source. Happy trading!

[mdeacey] EMA% Channel + Bollinger Band Trending StrategyThis strategy is based off the users selection of an EMA and percentage defined middle, upper and lower channels. The strategy longs if the price crosses the middle to upper channel until such time that a "reversal candle" (that exceeds the averages of 3 and 9 above the EMA 3) is found – and then shorts that reversal candle in the hope the price will change state from trending to ranging and move back to the middle channel. The same but opposite process for shorts.
The two obvious fallbacks to this strategy are that:
- Once trending the price can continue upwards. We try to mitigate this through use of a stoploss defined by ATR.
- Certain percentage thresholds can trigger a long/short with not much room to move before coming back to the middle channel. This is a tightrope exercise as making the percentage channels tighter misses earlier entries in more optimal cases. Change the parameters to find an EMA and percentages to find the best R/R.
All options are configurable and code open source. Happy trading!

Bar Percent CompleteThis is an example script for checking how far the current bar has progressed towards it's completed state. This works for any time frame, eliminating extra logic calls and conversions for each timeframe.period. It is not intended to be a standalone indicator, but rather as a resource for additional logic triggers on the real time bar of a pine script.
The main caveat is that pine script calculations occur on a per-tick basis. This means that the completion percentage can exceed the percentage threshold before any logic is executed. This happens when the next tick occurs after the threshold. The relevance then will depend on the activity of the underlying asset. Longer time frames on low activity assets will likely be more relevant than their shorter time frame counterparts.

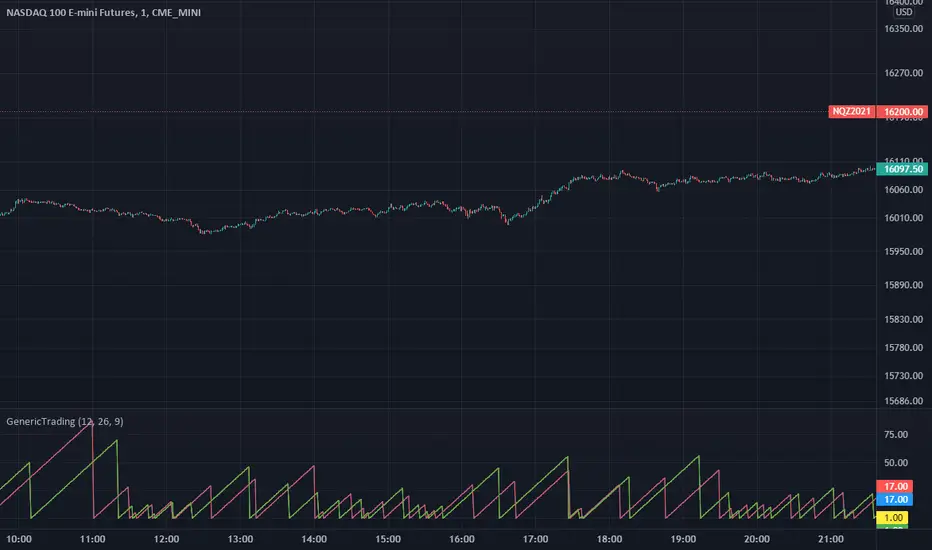
GenericTradingLibrary "GenericTrading"
This library aims to collect rare but useful operations for
get_most_recent_long_or_short_position_closed_index() : returns most recent long/short closed bar index.
get_most_recent_long_or_short_position_open_index() : returns most recent long/short closed bar index.
These two functions designed to help to speed up the coding for strategies that contains "re-enter" logic.
These two functions also could applies in the situations where time-count is needed in your condition.
BBW EMA RIBBON+BB%B+EMA BUY/SELL SignalsBINANCE:BTCUSDT
* * * TESTED ON BTCUSDT 4H CHART * * *
The indicator gives signals based on possible ENTRY/EXIT zones (calculated using an ema ribbon of the BBW) and BB%B oversold/overbought conditions, also a 200 EMA filter is used to trade following the major trend.
ENTRY/EXIT zones can be used as a confirmation on other strategies (green zones suggest a possible entry for a long in an uptrend and for a short in a downtrend, red zones suggest a possible exit for long & short)
Only LONG signals are given.
Signals are divided in 3 categories based on their strenght:
- Weak BUY/SELL (green/red circles on chart)
- normal BUY/SELL (green/red triangles with "BUY" or "SELL" text on chart)
- strong BUY/SELL (green/red labels with "STRONG BUY" or "STRONG SELL" text on chart)
You can use signals from the same category as triggers for entering or exiting a trade or you can try using signals from different categories
All indicators settings can be costumized
Possible EXTRY/EXIT zones can be turned ON/OFF
Every signal label can be turned ON/OFF
EMA that changes color based on last candle close can be turned ON/OFF
Alerts can be set for:
- General Signals (every signal will trigger it)
- Weak Signals (only weak signals will trigger it)
- Normal Signals (only normal signals will trigger it)
- Strong Signals (only strong signals will trigger it)
There are 3 BB%B Oversold & 3 BB%B Overbought value presets:
- BASIC (default values)
- LOW (slightly lower values from default)
- HIGH (slightly higher values from default)
Tips:
Use BB%B OS LOW preset to find entries at a better price
Use BB%B OS HIGH preset to find entries faster
Use BB%B OB LOW preset to find exits faster
Use BB%B OB HIGH preset to find exits at a better price
There are 3 Filters already included:
- A checkbox to toggle ON/OFF the use of Heikin Ashi candels to detect trades
- A checkbox to toggle ON/OFF the use of an ema filter for the ribbon that tries to reduce the number of false signals on over-extended price movements
- A checkbox to toggle ON/OFF the use of an ema filter that tries to reduce the number of false signals when price crosses the moving average many times consecutively

All-Time High with Percentage Drops for ETF's and Large CapsPlots the percentage drop levels from the All-Time High of any ticker. You can use this within a pullback trading system. For example, if you historically look at the average pullback of large cap stocks and ETF's, you can use this indicator to plot the levels it could pullback to for an entry to go long. It can be used as potential targets when trading a ticker short. Another use for this is to backtest the set percentage targets using TradingView's bar replay feature to see how ETF's and large cap stocks have reacted at these levels.
Currently percentage levels are statically set to 1, 2, 3, 5, 7, 10, & 20% levels below the All-Time High.
*Not financial advice but in my opinion the current percentage levels set (see above) are best used for ETF's and Large Cap Stocks.

Profit Percentage TrackerThis script provides a quick and easy way to visualize profits in a chart, based on the given entry date and price.
Optionally, alerts can be sent when profits cross up the given " profit unit ".
In short:
Tracks how much profit one could take based on the input " entry date " and the input " entry price "
These inputs are interactive (www.tradingview.com)
Displays the result in a label on top of the last candle
(Optional) Sends alerts based on the given " profit unit ", that is: if ' 0.5 ' is given, then an alert is triggered every time the profit is raised by that number
(Be careful with low values, as TradingView could stop an alert if it triggers too much.)
For alerts to be displayed, a " script alert " must be created right after the script was added to the chart:
- www.tradingview.com
(Choose ' Profits ' as condition and ' Any alert() function call ')
Good to know: if you check " Notify on app ", alerts can be delivered directly to your phone:
i.imgur.com
Prerequirements :
The chart's timezone has to be set to " Exchange " (this is required in order to support the alert's logic):
- kodify.net

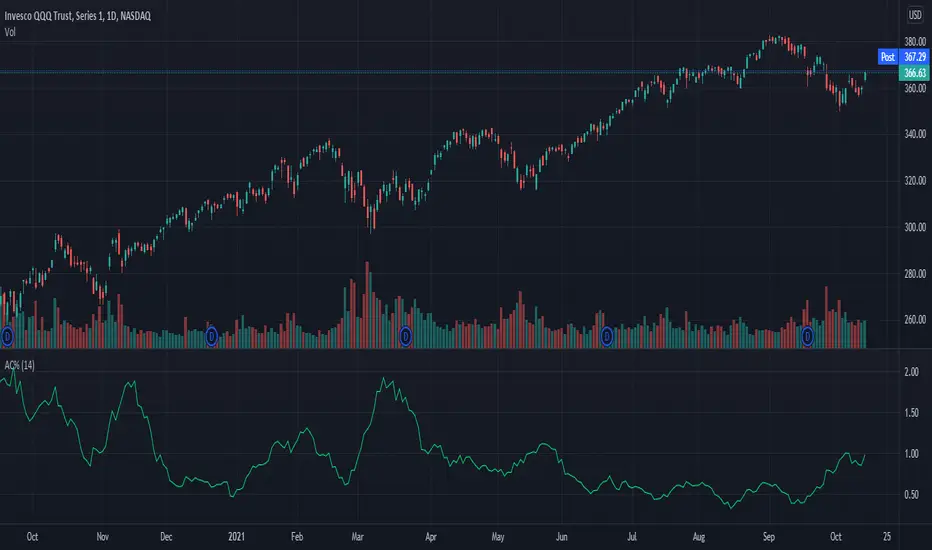
Average Change % (14-day)Simple script which calculates and shows the average change in a percentage format over a 14-day period.
Created due to the fact I couldn't find a percentage measure of average change when searching for it.
I have very little coding experience in Pine or otherwise so feel free to take and edit the script to make it a bit more user friendly.
Gain/StopLoss Percentage LinesGain/StopLoss Percentage Lines is a quick way to enter your Entry Price in to a stock and track the percentage of gain or loss at the 5% and 10% markers.
Click on the gear settings icon and type in your entry price. The percentage is defaulted to 5%. You can change this to a different percentage at this screen. Note that whatever number you enter will be doubled for the upper and lower lines. For instance, if you want to set your first red line stop loss and green gain line at 2.5%, your two other upper and lower green and red lines will be at 5%.
However, this will not change the text on the tab marker.
To change the tab text, go in to the Pine Editor and change the green text that says "5% Gain" and "5% Loss" to your new percentages.

Zendog Bar PercentageThis script will add text to bars showing the price change of the bar as a percentage, both for open/close and high/low.
It can be used together with Rate of Change to better get an idea of how the price moved at a previous point in time.
Script uses labels for text, as there is a maximum limit of 500 labels if you want to study price movement for a specific timeframe, you can limit the timeframe from the script settings. Keep in mind that labels are applied to the last 500 candles of any timeframe.
Script also displays statistics for max changes in the selected time period, for both green and red candles both as percentage and base currency absolute value.
Uses:
- Study the behavior of an asset under previous market conditions, black swan events a.s.o.
- Calculate leverage position risk versus extreme price movements
Example: ZENUSDT pumped ~35% on 15 Sep 2021 in the first seconds after the news on getting listed on Coinbase so shorts with 3x leverage would have been liquidated.

Simple Watchlist with % Change Screener & AlertsHi fellow traders..
TV has generously increased the number of alerts!!
A Simple Watchlist with heatmap based on % change on daily timeframe.
Gives % change and RSI
you can set the percentage in the input box and then set alerts on your favorite watchlist.
Alerts also include days high and low..
Simple Table and array based code.
set for scrip close >10 can be easily changed in line 43..
Hope you Like it!

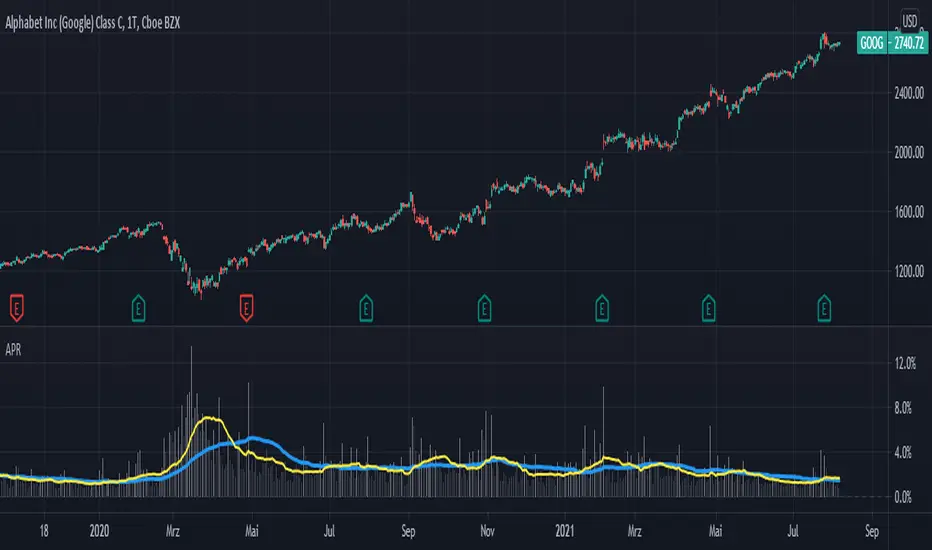
Averange Percentage RangeThis Indicator displays the two different Averange Percentage Range (APR) and the Percentage Range of the current bar.
If the long term APR is over the short term it indicates a lower volatility otherwise a higher.
You can set the calculation method, rising for (highest/lowest-1)*-100 or falling for (lowest/highest-1)*-100.
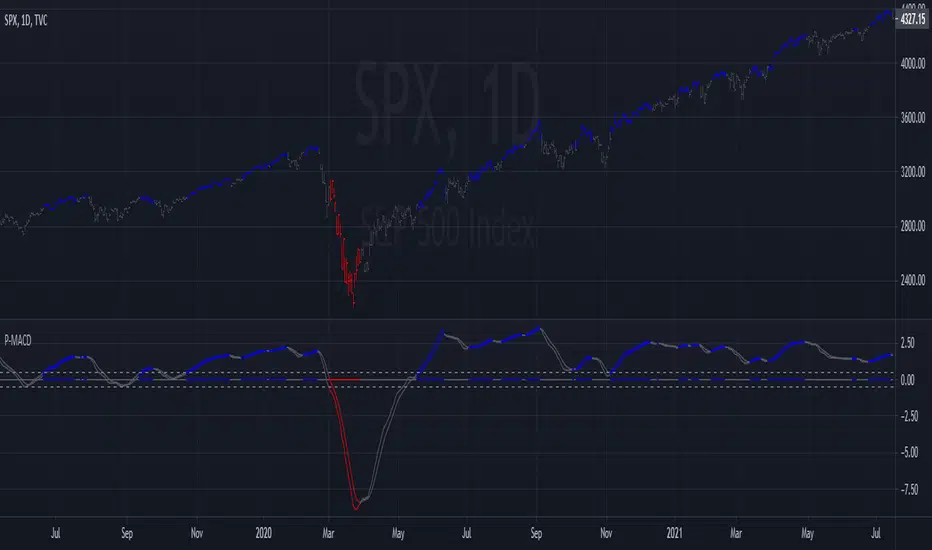
Percentage MACD Enhanced 3This MACD is calculated using percentage above or below the zero line for consistency and compatibility across different stocks and markets. The price bars are colored when MACD is above/below extreme levels and crossed in that direction. The intention is to use this setting on a longer time frame and trade only in the direction the bars are colored. This setting is also a powerful way to take profits! As usual, my scripts are public for scrutiny and to adjust for your personal needs.
Screener Price Percentage ChangeA screener that displays price percentage change in actual chart timeframe and the default Daily, Weekly and Monthly.
The actual time frame also displays last value percentage change.
For example, if actual timeframe is "Monthly, it is going to display also the last "previous Monthly percentage price change.
Can select 3 more assets to display.
Full control of Panel position and size.
A modified version of @Mohamed3nan
Para el Shiaks

Momentum Performance This Indicator displays the momentum (performance) of the symbol in percent.
You can compare the performance with other symbols.
The default benchmarks are the S&P 500, the MSCI World and the FTSE All World EX US.
The default length corresponds to one year in the timeframes monthly, weekly and daily.
In intraday the default length is 200, but you can also set your own setting.
You have also the opportunity to display a average momentum performance of the main symbol.
