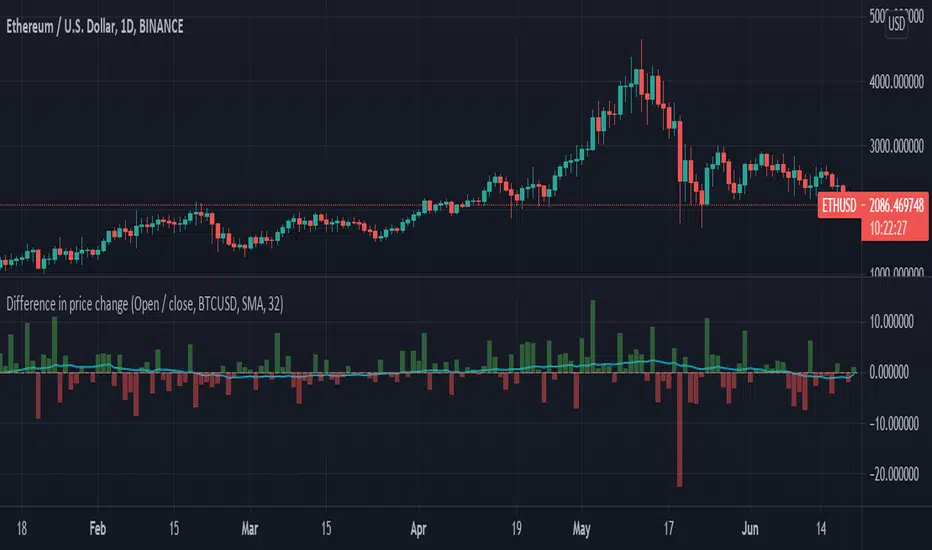
INDICES against BTC & ETHThe idea is the following; you can easily chart the FTX perp indices against (currently) two baselines, ETH & BTC.
I always choose ETH since it is way harder to outperform ETH at the moment. Doing this helps me see certain trends and/or fractal that might happen again in the future.
Since I already made D.A.M (Defi against Majors / Pricing Defi categories against BTC & ETH: ) I came across the idea of doing the same thing but with the perp indices that FTX offer. At first, I wanted to add this to D.A.M but it has no place in this indicator since this will not only look at Defi but the macro market as a whole.
The indicator currently only looks at the following indexes (weighting can be found here: https:// help. ftx. com/hc/en-us/articles/360027668812-Index-Calculation) :
DRGN: THE DRAGON INDEX
ARPA, BTM, IOST, NEO, NULS, ONT, QTUM, TRX, VET
ALT: ALTCOIN INDEX
BCH, BNB, EOS, ETH, LTC, XRP, TRX, DOT, LINK, ADA
MID: THE MID CAP INDEX
ALGO, ATOM, BAT, CRO, DASH, DCR, DOGE, HT, IOTA, LEO, NEO, OKB, ONT, QTUM, VET, XEM, XLM, XMR, XTZ, ZEC, ZRX, OMG, COMP, BSV, FTT, YFI, UNI, SNX, MKR, AAVE
SHIT: THE SHITCOIN INDEX
AE, AION, ARDR, ARPA, BCD, BEAM, BTG, BTM, BTS, BTT, CHZ, CKB, DGB, ELF, ENJ, GNT, GRIN, GT, HBAR, HC, ICX, IOST, KMD, KNC, LAMB, LRC, LSK, MANA, MATIC, MCO, NANO, NULS, OMG, POWR, PUNDIX, REN, REP, RVN, SC, SNT, STEEM, THETA, TOMO, VSYS, WAVES, XVG, XZC, ZEN, ZIL, ZRX
PRIV: THE PRIVACY INDEX
BEAM, DCR, GRIN, KMD, XMR, XVG, XZC, ZEC, ZEN
DEFI: THE DECENTRALIZED FINANCE INDEX
KNC, MKR, ZRX, REN, REP, SNX, COMP, TOMO, RUNE, CRV, DOT, LINK, MTA, SOL, CREAM, BAND, SRM, SUSHI, SWRV, AVAX, YFI, UNI, WNXM, AAVE, BAL
Percentage
Safe Scalpy Stop Loss. Percentage from price visualizer.This is my first script I have published so bear with me.
I have thrown this together so you can easily see on the chart where -0.5%, -1% and -2% would be from the last candle close. I also replicated these to show positive values in case you are shorting.
I have also added a custom value setting so you can set the line at whatever percentage value you like and included an adjustable recent higher high and higher low finder to help create a recent range as it seems to work well in tandem for scalping range based price movement.
You can turn all these things on and off in the settings on the style checkboxes.
I felt the need to make this because I like to scalp trade with leverage like a total degen from time to time. Often the setups happen very quickly. It is difficult to calculate where to set a stop loss in a hurry so I keep a fixed account size/lev and just vary the position percentage size based on the percentage of the stop loss from the current price.
Sometimes when switching from a lower volatility chart to high volatility one it is easy to get caught out by quickly entering a scalp trade only to find you made your position way too big or you shouldn't have entered at all. You thought it was only moving 0.2% per candle instead of 3%. Whoops. Rekt.
This indicator is all about trying to help me avoid that with a visual clue to back up the bad maths I do quickly in my head.
I often hide it and only show it when I'm ready to enter a position to double check my SL and entry are set in a sensible area.
I thought I would publish it in case someone else finds such a simple tool handy.
Apologies if there is already something out there that does this job. I couldn't find it.
See you all on the moon.
Moving Average Percentage Hunter by HassonyaIn this indicator study, we aim to capture the moving averages to which the bar close is closest. The indicator shows the moving averages, which are closest to the percentage value we selected, on the label. It indicates the names of the closest averages at the top of the label with a (near) note next to them. If none of the averages are close to the specified percentage value, there will be a no nearness warning. The indicator supports the heikin ashi candles. For this setting, check the I'm using heikin ashi candles box.
Thanks to this feature of the indicator, you will be able to see bar proximity to the moving averages you use continuously. You can make purchases and sales by using this feature to your advantage. This way you can easily catch reaction turns.
If you want, you can turn off moving averages in the settings section. You can open it whenever you need. You can do this in the show moving averages box. Appears if you check it, disappears if you uncheck it.
There are 5 moving average options. SMA, EMA, WMA, TMA and HullMA moving averages. Moving average names and values in the list are dynamically adjusted. When you change the settings, the moving average names and values in the list will change automatically. At the bottom of the settings, you can determine the lengths of the moving averages yourself. In the next update, each moving average will have a different average option.
You can enter percentage values, fractional figures. for example (3.5, 5.2 vb.) The indicator will show you the value you give and the proximity of the value below that value. You can adjust this setting in MA Percentage Nearness.
More detailed options will be available in the next update. Range of values, options below, above, and so on.
In the settings section, there is a Show distance option. If you check this option, you can continuously see the percentage values of the distance to the moving averages on the label. For this feature, you have to check the show distance box.
The alarm feature will come in the next update.
Thanks for support. Good Luck.
Candle Percent Volatility by AllenlkThis indicator gives you the percentage movement of each candle. Measurements are taken between the candle High point and Low point, and also between the Open and Close and calculated in percent %. From there it smooths out the data with a moving average. This gives you an idea of how much volatility is within each candle given the time resolution of the chart.
I like to use this information as a way to turn off a strategy, or select a proper time resolution for a strategy. If each candle has less than 2.5% Volatility most strategies will typically buy and sell rapidly at prices that are too close together, potentially losing money. During those times it seems best to either temporarily turn off the strategy, change the time resolution or switch to another strategy.
Date-selected Synch and Compare Script Module [yoxxx]This Script is a Convenience Script Module for calculations based or started on a fix time / date.
(In difference to bar_index-based where the reference point is shifting from bar to bar, thus is dynamic).
Purpose examples:
- Comparison by start date
- Time driven studies or strategies
- Measuring from Date of Interest
The script also contains a date input box with the feature of auto-converting the default time to local user time (a newer feature of Tradingview which too me a lot of research to find; so here integrated).
Last not least it the module gives you a ready to go example for multi security comparison on percentage scale with a free selectable start date.
Enjoy
Yoxxx
P.S:. For further notes look at the script code.
They are concerning usage and how avoiding some strange display issues.
Percentage Or Point Bar CalculatorHello Everyone This Indicator Base on Bar (Candle)
How to work its indicator?
➤This indicator calculating Every Bar Percentage Or Point with any Time Frame For eg: if you want to 50 Percentage above or below bar
Indicator Feature
➤ Long Signal with Alert
➤ Short Signal with Alert
➤ You can add Custom Point
➤ You can add Custom Percentage
Coming soon Feature
Take Profit
Stop Lose
Trailing Stoplose
Important: This Indicator we are using for Automation Trading if You Want This Indicator Access, Please Contact me PM on Tradingview
CryptoDon's Buy and Sell Targets Version 1.1This script is str1nger All-time high and percentage drops script with some small mods, such as the previous candles high and low prices.
This script helps me target buy and sell zones based on what percentage the price has dropped.
This is revision #2
Updated as of 2-10-21
CryptoDon's Buy and Sell TargetsThis script is str1nger All-time high and percentage drops script with some small mods, such as the previous candles high and low prices.
This script helps me target buy and sell zones based on what percentage the price has dropped.
Previous Close To Current High Percentage Per CandleGet the percentage of previous candle price to current high candle price.
This script will make your life easier to get percentage without you calculating it.
Hope you enjoy the tool and let me know if there is any feedback or improvement request.
Thank you very much. :D
--------------------------------
Formula:
Previous To High Percentage Per Candle = (high - previous / previous) * 100%
--------------------------------
Monthly SeasonalitySimple indicator designed as filter so you can easily see how the currency or asset performed during each month historically.
Can used to identify a possible month to enter or exit a trade in. For best results use in combination with another indicator or candle pattern to signal an entry in a historically bullish month
*This indicator is designed to be used only on the monthly chart.
Percentage Relative StrengthA relative strength indicator that compares your main symbol (one on your chart) strength to another symbol by percentage.
The result is plotted as a histogram showing which symbol is rising or falling more in percentage.
In case your chart symbol is TSLA (Tesla) and the indicator 'Symbol to compare' is SPX:
GREEN area (above zero) means TSLA is rising more than the SPX.
RED area (below zero) means TSLA is falling more than the SPX.
To these who wants to understand calculation, it's pretty straightforward.
For each asset we calculate everyday percentage change based on previous close and current close.
We take main asset (chart symbol) percentage and subtract it from percent of change of the symbol we want to compare to.
Result are smoothed by SMA (Simple Moving Average)
You can select different indexes or cfds such as S&P500 (SPX), NASDAQ 100 (NSX), RUSSELL 2000 (RUT) and NASDAQ (IXIC).
Default is S&P 500 (SPX).
Enjoy and Like if you like.
DisplayPriceMoveThresholds-by-STTAEnglish
Name: DisplayPriceMoveThresholds-by-STTA
- This study shows symbols in chart where a defined price movement percent threshold between a configurabele range of current bar and historic bar is exceeded.
- This information can be used to backtest possible PUT and CALL strike distances for option trading.
- User can configure if rising or falling or both price movements shall be displayed.
- This study can be used with all symbols and all time periods.
- A Extended functionality can be selected, where all price movements will be displayed in chart
German
- Dieser Indikator zeigt im Chart Symbole an, wenn der Preis bestimmte konfigurierbare Prozent-Schwellen zwischen zwei Kerzen mit konfigurierbarem Abstand überschreitet.
- Diese Information kann beim Optionshandel nützlich sein, wenn passende Strike Abstände gewählt werden sollen.
- Der Benutzer kann konfigurieren, ob steigende, fallende oder beide Preisrichtungen ausgewertet werden sollen.
- Dieser Indikator kann für alle Symbole und Zeitperioden verwendet werden
- Eine erweiterte Funktion kann ausgewählt werden, wo alle Preisbewegungen mit Schwellen als zusätzlicher Linienchart gezeichnet wird.
Inputs
- displayed triangle symbols above or below candle in chart window
Settings/Parameter
- Resolution: defines the resolution for calculation
- Source: defines bar value as open, close, high, low
- Direction: specifies price direction
-- UP: evaluates only rising price movements
-- DOWN: evaluates only falling price movements
-- BOTH: evaluates rising and falling price movements
-- ALL: evaluates rising and falling price movements; additionally plots all percentage values and thresholds as linegraph in chart
- Up Threshold in %: Float value of rising price movement threshold in percent: Min Value:0.0
- Down Threshold in %: Float value of falling price movement threshold in percent: Max Value:0.0
Outputs
- Up Threshold Exceeded: triangle symbol in chart above bar
- Down Threshold Exceeded: triangle symbol in chart below bar
- ALL Output:
-- plot of all percentage values as linegraph in chart when Direction ALL is selected
-- Line Up Threshold: plot of Up Threshold horizontal line in chart when Direction ALL is selected
-- Line Down Threshold: plot of Down Threshold horizontal line in chart when Direction ALL is selected
If you are interested to obtain access to this indicator, please send me a message via Tradingview or Signature contact data below this description
Solltest Du Interesse für einen Zugriff auf diesen Indikator haben, sende mir bitte eine Nachricht über Tradingview oder meine Signatur Kontaktdaten unter dieser Beschreibung
Weekly Short Strangle in % terms BandsDraw lines/band or deviation for any Script based on given input %
Generally used for Weekly options strangle/iron condor BANKNIFTY/NIFTY
1) Input % deviation required
2) for every Thursday Closing basis calculates the % distance and draws bands until next Thursday
HeatbandsWhat you see is the 100 day moving average (blue line in the middle) with percentage bands attached to it.
Each color has a 5% range.
The brightest green color is 20%-25% below the 100 day moving average.
The brightest red color is 20%-25% above the 100 day moving average.
The behaviour of the stock price between the bands could give you trading ideas.
The moving average length is adjustable.
The range between the bands is not adjustable (maybe in future updates).
Enjoy:)
hullma percentage linesWhat you see is a hullMA (user defined length) with 4 percentage bands attached to it.
The bands percentage and hullMA length can be adjusted to see how the trading strategy performs.
I implemented only long trades with a crossover from one of the lower bands, when it crosses over a high band
it exits the trade.
Improvement coulde be:
-more percentage bands
-short trades
-trades between bands
Enjoy:)
lineAlertslineAlerts is a powerful tool to define Buys, Sells and Buy-Sell lines for repeating actions.
The possibilities vary from 1 Buy and/or Sell to repetitive Buying and Selling at definable lines from a specified point in time (Year, Month, Day and Hour to begin).
lineAlerts provides:
+ optional StartBuy and optional EndSell
+ in repeat mode: optional definable ending-action (Buy or Sell, which overwrites Stop-Out/Abort)
+ buy- and sell Lines can be angled separately by using non-zero entries in the Angle %perDay parameter
+ configurable Stop Loss (Percentage, Stop-Out/Abort-Only, Flat or Angled like Buy-Sell-Lines)
+ profit calculation and effective alerts can be set further than the beginning time (ActiveAfter#Hours)
+ empty-bar-correction for lower-liquidity pairs on short timescales (automatically on)
+ optional visual extension to the right for currently active buy-sell lines
+ Slippage Max. Percentage parameter, added to order price for Buying, subtracted for Selling
(represented in the Buy-Sell markings and LastPrice lines, also calculated in Profit/Loss percentages)
+ Full Autoview Alerts automation in the Order parameters (for spot trading, this can be replaced with
your own API commands while creating or modifying the TradingView alerts):
- Separate order size entries for Buying and Selling
- Choice between Percentage or absolute Amount for both Buying and Selling
(choose the corresponding alert-drop-down option when creating an alert!)
The timeframe for running lineAlerts depends on the scale (duration) of the defined pattern.
Running on a very small resolution, e.g. 1-5 Min, is suitable for a pattern of a few days to a week at most.
This is because of the limited available historic data. Keeping your pattern lines shorter than a week on these micro-timeframes will produce accurate results/output. A pattern which may last a few weeks or even months can run flawlessly on a 1H resolution for example.
"Once per bar" is the best alert option in any case. To avoid multiple signals within 1 bar in highly volatile times, it is better to create the alert on the 1 or 4 Hour chart in stead of the daily chart for a pattern of multiple weeks for example.
lineAlerts is suitable for any timeframe on any chart which is open 24/7, like most crypto currencies.
My other published indicators contain a handy combination of new and classical indicators and oscillators.
With lineAlerts, the one defining the lines is in complete control. Results might indicate how good one is at defining trade patterns and at defining suitable stop losses, but lineAlerts is not an indicator as such.
lineAlerts is more something like a visually definable price-line alerter with various stop loss and ending options. There will be a video available with some more explaining.
WARNING:
Note that if an Autoview extension is active for the charted exchange and the according TradingView alerts are activated, it works right out of the box, so make sure to have all order decimals right...
GuidoN - December 2019, July 2020
Pivot Points Percentage Differences (W/ High & Low Indicators)This script is really handy for day trading. This works best on low time frames like the 1 minute or the 5 minute .
To understand what pivot points are you can add other pivot point indicators or just look at the color differences below since every-time that changes it's a new pivot point (which represents a known low or known high with high certainty)
The script shows the most recent percentage move up or down for the last known pivot point based on the pivot point setting data.
Pivot points are generated after 20 bars go by default, but you can set this to whatever you wish in the settings . Just click the gear icon for the script to set these.
You can also set how many bars back to look for what was the last highest percentage move (down or up). This will be important for your day trading strategy.
The idea to trading with this is pretty simple.
You look at the highest percentage moves that were made on pivots up or down and if you notice a current move that has trended down or up to the highest percentage, that makes that a safer bet for shorting or longing.
Of course, sometimes, things move greater or less than normal, so you would set stop losses accordingly.
Hope this helps with your day trading for finding good entry and exit points!
EXAMPLE TRADE SCENARIO
You notice the last high for the last 100 bars was 3% . The price recently rose 3% from a known pivot low. You can put a short on this. You noticed that the average price down was 2% , so if the price drops 2% or close to it you can exit your short and go LONG . You set a stop loss above what you put by an extra percentage to be safe.
I will do an experimental strategy version of this idea if people are interested.
ATR %Displays ATR percentage with 2SD. When value is greater than 12% I consider the stock as highly volatile
Fixed Percent Stop Loss & Take Profit %===========
Fixed Percent Stop Loss & Take Profit %
===========
A neat example of how to set up Fixed Stops and Take Profit as a percent of the entry price.
Yup, that's about it!
You can ignore the actual entry/exit orders - they're based on a simple MA cross and are therefore NOT relevant, NOT really profitable and NOT recommended!
You should be using this code as a way of adding Stops and Takes to your own scripts - hope it helps!
-----------
Good Luck and Happy Trading!
Any Security vs. Any Security Change Comparison [BigBitsIO]This script allows you to compare the percentage-based change in the price of any two securities on any given (and supported) timeframe on the chart. This can give you a very simple way to compare any two securities against one another.
Ex: If your base security gained 5%, and the other security gained 3% in a single day, the change comparison would show a green bar of 2% because your base security outgained your other security by 2%.
Features:
- 2 securities to compare. A base and other.
- Shortlist of default securities to choose from.
- Ability to override the default securities list and use any security supported by TradingView. You must use the correct security string to do so.
- Resolution is tied to whatever the current chart is using. This way the view of the indicator always reflects the correct resolution of the chart.
- If either market has a 0% change, it is considered likely closed during that period and will result in a change of 0%, as they shouldn't be compared at that time.
Alts vs Btc percentage changesCatch differences and over-corrections between Alts and Bitcoin via Ftx's indexes
A more visual description : i.imgur.com
Volume %This volume indicator additionally shows in percent how much volume, e.g. in the 1-minute chart, was traded compared to the average daily volume.
Growing or Waning Patterns [Alerts]Example how to color patterns of 3 bodies growing or waning by percentage with or without trend. Also included option for alert triggers. The yellow triangles on the chart denote where the alert triggers will fire.
• Choose Pattern Of Filter: shows bodies growing or waning or both.
• Sample Lengths Of AvgBar: number of recent bars to use for average size.
• BigBar Is Min% Of AvgBar: the minimum percent of average the big bar must be.
• MedBar Is Max% Of BigBar: the maximum percent of big bar the medium bar can be.
• SmlBar Is Max% Of MedBar: the maximum percent of medium bar the small bar can be.
• Repeat Pattern If n Bars: the number of bars to ignore repeat patterns, 1 allows all.
• Trending: on requires the growing or waning patterns to also be trending.
• GrayBars: colors non pattern bodies gray.
NOTICE: This is an example script and not meant to be used as an actual strategy. By using this script or any portion thereof, you acknowledge that you have read and understood that this is for research purposes only and I am not responsible for any financial losses you may incur by using this script!


