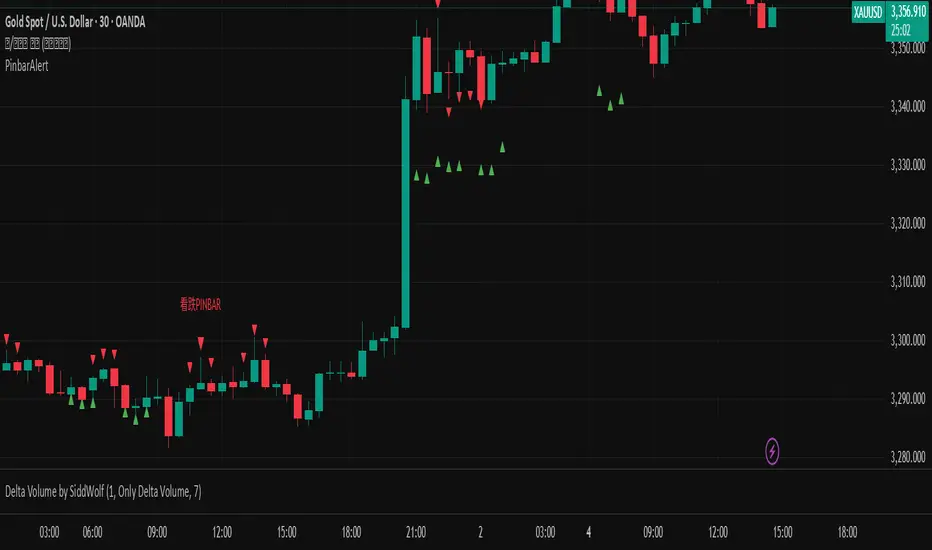
Pinbar signal 顶/底分型 指标Top/Bottom Fractal Indicator is a technical analysis tool used to identify potential reversal points in a market trend. It is based on the concept of fractal patterns, which consist of specific candlestick formations that signal local highs (top fractals) or lows (bottom fractals).
A top fractal typically occurs when the high of a middle candlestick is higher than the highs of the two candles on either side. This formation suggests that upward momentum may be weakening and a downward reversal could follow. Conversely, a bottom fractal forms when the low of a middle candlestick is lower than the lows of the two adjacent candles, indicating a potential shift from a downtrend to an uptrend.
This indicator is commonly used to spot market turning points, determine entry or exit signals, and enhance the reliability of other indicators such as Bollinger Bands or MACD. Because of its clear structure and reliable reversal signals, the Top/Bottom Fractal Indicator is also widely applied in wave theory and price action strategies.
A Pin Bar is a powerful candlestick pattern used in technical analysis to identify potential price reversals or continuations in the market. It is characterized by a small body located at one end of the candle and a long tail or wick on the opposite side, which indicates a strong rejection of price in that direction. A bullish Pin Bar has a long lower wick, showing that sellers pushed the price down but buyers regained control, suggesting a potential upward move. Conversely, a bearish Pin Bar has a long upper wick, indicating that buyers attempted to drive prices higher but were overpowered by sellers, hinting at a possible downward move. For high-probability setups, traders typically look for Pin Bars that form at key support or resistance levels, trendlines, or Fibonacci zones, and they often use them in combination with overall trend direction. Entry strategies include entering at the close of the Pin Bar, on a retracement, or above/below the wick with stop-losses placed beyond the wick’s extreme. When used correctly in the right context, the Pin Bar can be a highly effective signal in a trader’s toolkit.
Cari dalam skrip untuk "TRENDLINES"

Pinbar signalA Pin Bar is a powerful candlestick pattern used in technical analysis to identify potential price reversals or continuations in the market. It is characterized by a small body located at one end of the candle and a long tail or wick on the opposite side, which indicates a strong rejection of price in that direction. A bullish Pin Bar has a long lower wick, showing that sellers pushed the price down but buyers regained control, suggesting a potential upward move. Conversely, a bearish Pin Bar has a long upper wick, indicating that buyers attempted to drive prices higher but were overpowered by sellers, hinting at a possible downward move. For high-probability setups, traders typically look for Pin Bars that form at key support or resistance levels, trendlines, or Fibonacci zones, and they often use them in combination with overall trend direction. Entry strategies include entering at the close of the Pin Bar, on a retracement, or above/below the wick with stop-losses placed beyond the wick’s extreme. When used correctly in the right context, the Pin Bar can be a highly effective signal in a trader’s toolkit.
RAMS TrapMaster ConfluenceOverview:
The TrapMaster Confluence indicator is a tactical multi-factor confirmation system designed to identify high-probability intraday and swing trade setups. It aligns multiple technical signals—momentum, trend, volume, and price action—to generate a clear bias score. By requiring confluence across several dimensions, it filters out weak or noisy signals and highlights trades with broader technical agreement. This tool is tailored for semi-advanced retail traders across equities, futures, and crypto who seek objective, structured confirmations before entering a position.
Confluence Components:
RSI (Relative Strength Index):
Evaluates momentum strength and trend bias. The script dynamically checks for crossovers at the 50 midline and extreme overbought/oversold zones to determine directional pressure.
MACD (Moving Average Convergence Divergence):
Detects momentum shifts using signal line crossovers and MACD histogram polarity. The script uses MACD direction and histogram flips to contribute to bullish or bearish pressure.
SMA 5 vs. SMA 20:
Captures short-term trend shifts via fast–slow moving average crossovers. A rising 5-SMA over a falling 20-SMA supports a bullish thesis and vice versa.
SMA 50 vs. SMA 200:
Used to confirm longer-term trend bias (e.g. golden cross or death cross) and add weight to the broader market structure.
SMA 5 Trend Direction:
Assesses immediate trend slope. An upward or downward slope of the 5-SMA confirms recent price acceleration or deceleration.
Volume Spike:
Flags high-volume price moves, helping validate whether momentum is supported by institutional participation or liquidity interest.
Rising Volume Bars:
Confirms directional strength through consistent increases in volume during trends. Sustained rising volume suggests growing conviction.
VWAP (Volume-Weighted Average Price):
Anchors price to institutional average cost per session. Price above VWAP typically indicates bullish sentiment; below signals bearish sentiment.
Candlestick Confirmation:
Confirms signals using recent price action (e.g. engulfing candles, breakouts with volume). Adds an extra layer of price behavior validation.
Contrarian Mode (Optional):
This feature flips the typical logic to catch high-probability reversal zones. When many signals align in one direction, contrarian mode allows the user to search for exhaustion points in sentiment or momentum, potentially capturing mean reversions.
Each confluence factor contributes a vote to a composite bias count. Users define a threshold (e.g., 4 out of 6 conditions) to trigger a signal. The indicator does not rely on any one signal, but instead rewards alignment across multiple technical aspects.
Signal Generation & Alerts:
When the defined confluence threshold is met, a signal label appears on the chart with directional context (long or short). Alerts can be tied to these signals, allowing the user to be notified in real time when actionable setups occur. The system supports “next candle confirmation,” which delays signal printing until the bar closes, minimizing premature alerts. All labels are limited to the most recent few to reduce chart clutter.
Dashboard Overview:
The optional real-time dashboard shows which confluence components are active on the current candle. This visual panel is customizable, updating dynamically and remaining hidden when no conditions are met. It includes:
Each factor with active/inactive status
Current bullish and bearish score counts
Real-time snapshot of bias development
Customization & Controls:
All components can be toggled on or off. Traders can choose to require stricter or looser confirmation thresholds. Label visibility, signal timing, and dashboard position/size are fully adjustable. This allows the indicator to adapt across timeframes and trading styles — whether scalping or swing trading.
Suggested Use with Trendlines and support and resistance:
TrapMaster becomes significantly more powerful when used alongside manual or automated support/resistance and trendline analysis. Confluence signals occurring near:
major support zones,
resistance levels,
trendline retests.
Fibonacci retracements,
help validate the price’s reaction to those areas. Traders can pre-mark key price zones, then use TrapMaster to confirm entries as momentum builds at those levels. This strengthens conviction and supports timing decisions when structure and indicators align.
Why It’s Different:
Most scripts offer a single signal or simplistic crossover logic. TrapMaster offers multi-dimensional logic that evaluates a comprehensive set of confluence factors—each customizable—with real-time logic that updates on every bar. The built-in dashboard provides a highly readable tactical summary. Its optional contrarian bias engine, dashboard visuals, factor-level customization, and risk-filtering logic (e.g. delayed confirmation and volume context) make it a flexible and advanced system not commonly found in traditional retail indicators.
Disclaimers:
This tool is for educational and analytical use only. It is not intended as trading or financial advice. All trading carries risk, and past performance is not indicative of future results. Always use proper risk management and conduct your own independent analysis before making trading decisions.
Developed by: TRAPPER-RAMS
Jul 24
Release Notes
This is the official update to RAMS TrapMaster Confluence, featuring massive enhancements across visual clarity, confluence accuracy, and real-time alert precision.
What's New:
Accurate Confluence Dashboard
Triple-row layout: Bullish , Bearish , and clear headers
Bull/Bear condition separation for total clarity
SMA 5/20 & 50/200 cross states tracked and displayed
Fully Integrated Alerts
Alerts for 5/20 and 50/200 SMA crosses
Bullish 💸 and Bearish 💰 confluence entry alerts
Instant trigger-ready setup
Visual Label Overhaul
💸 = Buy Signal (normal mode)
💰 = Sell Signal (normal mode)
🧨 = Contrarian Bull Flip
💣 = Contrarian Bear Flip
Cross labels show exact bar: "5/20 X", "50/200 X"
CoolDown & Memory-Efficient Label Logic
• Configurable label cooldown per N bars
• Old signals auto-deleted to prevent overflow
Use Cases:
This update is ideal for traders looking for precision entry timing, while understanding the full bull/bear backdrop in real-time.


ZigZag Based RSIDescription
ZigZag Trend RSI (ZZ-RSI) is an advanced momentum indicator that combines ZigZag-based trend detection with a trend-adjusted RSI to deliver smarter overbought and oversold signals. Unlike traditional RSI that reacts purely to price movement, this indicator adapts its sensitivity based on the prevailing trend structure identified via the ZigZag pattern.
By dynamically adjusting RSI thresholds according to market direction, ZZ-RSI helps filter out false signals and aligns RSI readings with broader trend context—crucial for trend-following strategies, counter-trend entries, and volatility-based timing.
Core Components
ZigZag Pattern Recognition:
Identifies significant swing highs and lows based on price deviation (%) and pivot sensitivity (length). The most recent pivot determines the prevailing trend direction:
🟢 Bullish: last swing is a higher high
🔴 Bearish: last swing is a lower low
⚪ Neutral: no recent significant movement
Trend-Weighted RSI:
Modifies traditional RSI input by emphasizing price changes in the direction of the trend:
In bull trends, upside moves are magnified.
In bear trends, downside moves are emphasized.
Dynamic RSI Zones:
Overbought and Oversold thresholds adapt to the trend:
In uptrends: higher OB and slightly raised OS → tolerate stronger rallies
In downtrends: lower OS and slightly reduced OB → accommodate stronger sell-offs
In neutral: default OB/OS values apply
How to Use
✅ Entries (Reversal or Mean Reversion Traders):
Look for oversold signals (green triangle) in downtrends or neutrals to catch potential reversals.
Look for overbought signals (red triangle) in uptrends or neutrals to fade momentum.
Confirm with price action or volume for higher conviction.
📈 Trend Continuation (Momentum or Trend-Followers):
Use the trend direction label (Bullish / Bearish / Neutral) to align your trades with the broader move.
Combine with moving averages or price structure for entry timing.
Avoid counter-trend signals unless confirmed by divergence or exhaustion.
🧠 Signal Interpretation Table (top right of chart):
Trend: Indicates the current market direction.
RSI: Real-time trend-adjusted RSI value.
Signal: OB/OS/Neutral classification.
Customization Options
ZigZag Length / Deviation %:
Adjust pivot sensitivity and filter out minor noise.
RSI Length:
Controls how fast RSI responds to trend-adjusted price.
Color Settings:
Personalize visual cues for trend direction and OB/OS backgrounds.
Alerts Included
📢 Overbought/oversold conditions
🔄 Trend reversals (bullish or bearish shift)
These alerts are ideal for automated strategies, mobile notifications, or algorithmic workflows.
Ideal For
Traders seeking smarter RSI signals filtered by market structure
Trend-followers and swing traders looking for reliable reversals
Those frustrated with false OB/OS signals in volatile or trending markets
Best Practices
Use in confluence with price structure, trendlines, or S/R levels.
For intraday: consider lowering ZigZag Length and RSI Length.
For higher timeframes: use higher deviation % and smoother RSI to reduce noise.

Marketmap by Logicat📊 Marketmap is truly a "Capital Flow Sensor Indicator" – Uncover the Truth Behind Price Movements
Have you ever been frustrated by sudden market reversals?
Have you been stopped out during fake breakouts or deceptive rallies?
This indicator was born to solve exactly those pain points.
📌 Core Features of the Indicator:
1. Capital Flow Detection
By calculating the interaction between volume and price, this tool identifies the flow of smart money — spotting abnormal volume spikes, accumulation signs, and distribution signals.
2. Automatic Marking of Hidden Order Zones (Smart Money Zones)
It detects footprints of institutional activity and highlights meaningful support/resistance zones, rather than drawing random lines — helping you focus on price levels that truly matter to the market.
3. Volume Analysis of Support/Resistance Zones
Each marked zone includes real-time volume strength analysis, helping to determine whether a zone is likely to hold or break.
4. Interest Zone Detection
The indicator can preemptively identify price zones likely to be revisited, allowing you to distinguish between support retests and continuation setups.
5. Automatic Trendline Drawing
Draws real-time trendlines to help determine directional bias and test points.
6. Live Trend Calculation
Displays a simple real-time strength comparison table between gold and USD.
🧠 More Than Just an Indicator — A Market Structure and Liquidity Engine
It integrates:
Price + Volume Structure
Smart Money Traces
Dynamic Strength of S/R Zones
High Timeframe (HTF) Liquidity Perspective
💡 Recommended For:
Ideal for swing traders, intraday scalpers, and even order flow-focused traders.
Can be paired with trend-following strategies or naked chart trading systems to strengthen entry logic.
🔔 Disclaimer:
This indicator is not a crystal ball. It is a visual tool for highlighting high-probability zones and real transaction footprints.
You remain responsible for risk management and final trading decisions.

Scalper v3.1 [SystemAlphaFX]Scalper v3.1 indicator covers all aspects of this sophisticated trading tool.
Key Features:
Performance Presets - Four optimization levels from Maximum Performance to Full Features
Core Components - Detailed explanation of PAC system, EMAs, and signal systems
Advanced Features - Pivot points, S/R levels, trendlines, and Fibonacci tools
Trading Strategies - Specific entry/exit rules for different approaches
Alert System - Complete setup instructions for all 8 alert types
Optimization Tips - Settings for different timeframes and market conditions
Troubleshooting - Solutions for common performance and signal issues
Notable Features of This Indicator:
Price Action Channel (PAC) - The core system using EMA-based dynamic channels
Multiple Signal Systems - Impulse, TTM, and trend-based confirmations
Performance Optimization - Smart preset system to balance features vs. speed
Comprehensive Alerts - 8 different alert conditions for various trading scenarios
Smart RSI Divergence PRO | Auto Lines + Alerts📌 Purpose
This indicator automatically detects Regular and Hidden RSI Divergences between price action and the RSI oscillator.
It plots divergence lines directly on the chart, labels signals, and includes alerts for automated monitoring.
🧠 How It Works
1. RSI Calculation
RSI is calculated using the selected Source (default: Close) and RSI Length (default: 14).
2. Divergence Detection via Fractals
Swing points on both price and RSI are detected using fractal logic (5-bar patterns).
Regular Divergence:
Bearish: Price forms a higher high, RSI forms a lower high.
Bullish: Price forms a lower low, RSI forms a higher low.
Hidden Divergence:
Bearish: Price forms a lower high, RSI forms a higher high.
Bullish: Price forms a higher low, RSI forms a lower low.
3. Auto Drawing Lines
Lines are drawn automatically between divergence points:
Red = Regular Bearish
Green = Regular Bullish
Orange = Hidden Bearish
Blue = Hidden Bullish
Line width and transparency are adjustable.
4. Labels and Alerts
Labels mark divergence points with up/down arrows.
Alerts trigger for each divergence type.
📈 How to Use
Use Regular Divergences to anticipate trend reversals.
Use Hidden Divergences to confirm trend continuation.
Combine with support/resistance, trendlines, or volume for higher probability setups.
Recommended Timeframes: Works on all timeframes; more reliable on 1h, 4h, and Daily.
Markets: Forex, Crypto, Stocks.
⚙️ Inputs
Source (Close, HL2, etc.)
RSI Length
Toggle Regular / Hidden Divergence visibility
Toggle Lines / Labels
Line Width & Line Transparency
⚠️ Disclaimer
This script is for educational purposes only. It does not constitute financial advice.
Always test thoroughly before using in live trading.

FVG-Bully BearsFVG-Bully Bears Indicator
The FVG-Bully Bears indicator is a powerful tool designed to identify Fair Value Gaps (FVGs) on your TradingView charts. FVGs are price gaps that occur when the market moves sharply, leaving areas where little to no trading activity took place. These gaps often act as key support or resistance zones, making them valuable for traders looking to spot potential reversal or continuation points.
This indicator highlights Bullish FVGs (potential support zones) and Bearish FVGs (potential resistance zones) with customizable boxes and labels, helping you visualize these critical price levels with ease.
Features
Bullish and Bearish FVGs: Detects gaps where price has left untested areas, marking bullish (green) and bearish (red) FVGs.
Customizable Display: Choose to show or hide bullish/bearish FVGs, adjust colors, and control box visibility.
FVG Labels: Optional labels on each FVG box to clearly identify bullish or bearish gaps, with adjustable text size.
Delete Filled FVGs: Automatically removes FVGs once price revisits and fills the gap, keeping your chart clean.
Box Extension: Extend FVG boxes into the future (up to 100 bars) to track unfilled gaps over time.
Performance Optimization: Limits the number of displayed FVG boxes (default: 50) to ensure smooth chart performance.
How It Works
Bullish FVG: Identified when the high of a candle two bars ago is lower than the low of the current candle, indicating a sharp upward move.
Bearish FVG: Identified when the low of a candle two bars ago is higher than the high of the current candle, indicating a sharp downward move.
FVGs are drawn as colored boxes (green for bullish, red for bearish) and can include labels for easy identification.
If enabled, filled FVGs (where price revisits the gap) are deleted to reduce chart clutter.
Settings
FVG Settings
Show Bullish FVGs: Enable/disable bullish FVG boxes (default: enabled).
Show Bearish FVGs: Enable/disable bearish FVG boxes (default: enabled).
Bullish FVG Color: Customize the color and transparency of bullish FVG boxes (default: light green).
Bearish FVG Color: Customize the color and transparency of bearish FVG boxes (default: light red).
Max FVG Boxes: Set the maximum number of FVG boxes displayed (default: 50, range: 1–500).
Extend FVG Boxes (Bars): Extend FVG boxes into the future by a specified number of bars (default: 8, range: 0–100).
Show FVG Labels: Enable/disable text labels on FVG boxes (default: enabled).
Label Size: Choose the size of FVG labels (options: Tiny, Small, Normal, Large, Huge; default: Small).
Delete Filled FVGs: Automatically remove FVGs when price fills the gap (default: enabled).
How to Use
Add the FVG-Bully Bears indicator to your TradingView chart.
Customize the settings to match your trading style (e.g., adjust colors, toggle labels, or change box extensions).
Watch for green (bullish) and red (bearish) FVG boxes:
Bullish FVGs: Potential support zones where price may bounce or consolidate.
Bearish FVGs: Potential resistance zones where price may reverse or stall.
Use FVGs in combination with other indicators (e.g., support/resistance, trendlines) for better trade decisions.
If “Delete Filled FVGs” is enabled, filled gaps will disappear, keeping your chart focused on active FVGs.
Ideal For
Swing Traders: Identify key price zones for entries or exits.
Day Traders: Spot intraday support/resistance levels created by rapid price moves.
Price Action Traders: Use FVGs to confirm market structure and potential reversal points.
Notes
For best performance, keep “Max FVG Boxes” at a reasonable value (e.g., 50) to avoid chart lag.
FVGs are most effective on lower timeframes (e.g., 5m, 15m, 1H) but can be used on any timeframe.
Combine with other tools like volume or trend indicators for a complete trading strategy.
Enjoy trading with FVG-Bully Bears and take advantage of Fair Valu

[Teyo69] T1 Wyckoff Aggressive A/D Setup📘 Overview
The T1 Wyckoff Aggressive A/D Setup is a dual-mode indicator that detects bullish accumulations and bearish distributions using core principles from the Wyckoff Method. It identifies price/volume behavior during Selling/Buying Climaxes, ARs, SOS/SOW, and triggers based on trend structure.
🔍 Features
✅ Automatic detection of:
Automatic Rally (AR)
Automatic Reaction (AR)
Sign of Strength (SOS) or Sign of Weakness (SOW)
🧠 Trend-sensitive logic with linear regression slope filters
⚙️ Configurable options for Reversal vs Trend Following mode
🎯 Smart structure timing filters using barssince() logic
🔊 Volume spike and wide-range candle detection
📊 Visual cues for bullish (green) and bearish (red) backgrounds
🛠 How to Use
Reversal Mode
Triggers early signals after a Climax + AR
Ideal for catching turning points during consolidations
Trend Following Mode
Requires Climax, AR, and confirmation (SOS or SOW)
Waits for structure confirmation before signaling
Use this when you want higher probability trades
⚙️ Configuration
Volume MA Length - Determines baseline volume to detect spikes
Wick % of Candle - Filters candles with long tails for SC/BC
Close Near Threshold - Ensures candles close near high/low
Breakout Lookback - Sets structure breakout level
Structure Threshold - Controls timing window for setups
Signal Option - Switch between Reversal or Trend Following mode
⚠️ Limitations
Doesn't confirm macro structure like full Wyckoff phase labeling (A–E)
May repaint on lower timeframes during volatile candles
Works best when combined with visual range recognition and market context
🧠 Advanced Tips
Use in confluence with:
Volume Profile ranges
Trendlines and supply/demand areas
Ideal timeframes: 8H to 1D for crypto and forex markets
Combine this with LPS/UTAD patterns for refined entries
📝 Notes
SC/AR/SOS = Bullish
BC/AR/SOW = Bearish
Trend coloring adapts background (green = rising slope, red = falling slope)
🛡️ Disclaimer
This tool is a market structure guide, not financial advice. Past behavior does not guarantee future performance. Always use proper risk management.

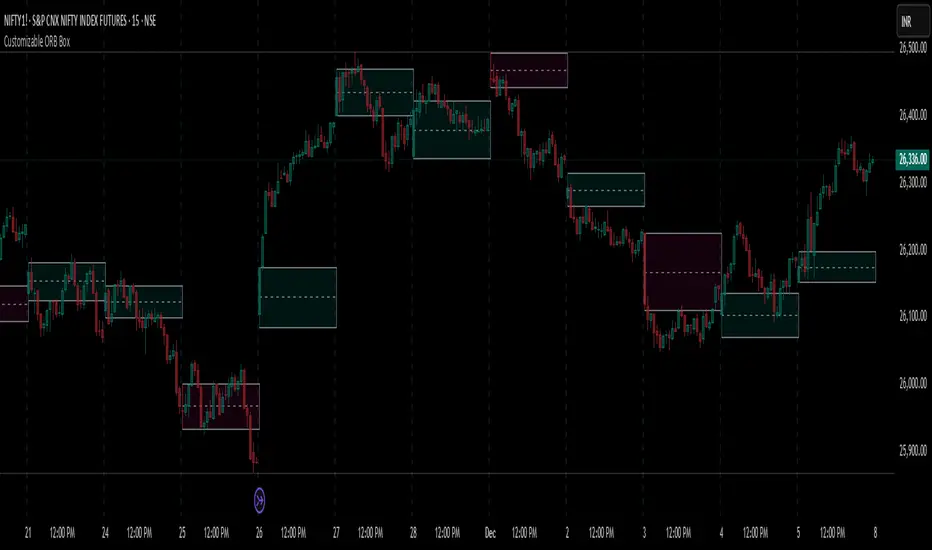
Customizable ORB BoxCustomizable ORB Box
📘 Description
A powerful and flexible Opening Range Breakout (ORB) visualization tool designed for intraday traders. This indicator plots the opening range using either the first candle or a user-defined custom timeframe, and updates in real time.
🔧 Key Features
First Candle Mode – Plots the high/low range of the first candle of each new trading day.
Custom Timeframe Mode – Builds the ORB box live over a chosen duration (e.g., 5, 15, 30 minutes) and finalizes it after the timeframe completes.
Dynamic Box Colors – Bullish and bearish color themes based on range closure direction.
Multi-Day Plotting – Displays ORB boxes across all days, not just today.
Alerts Included – Triggers when price breaks above or below the ORB range.
No repainting – Stable and historical-friendly behavior.
🕒 ETH Compatibility
This indicator respects your TradingView chart settings:
✅ If ETH is enabled, ORB begins with the first ETH candle.
✅ If ETH is disabled, ORB begins with Regular Trading Hours (RTH).
Tip: Control this via the chart’s ⚙️ “Session” settings for your instrument.
💡 How to Use
Use First Candle Mode for classic ORB strategy setups (quick early structure).
Use Custom Timeframe Mode on smaller timeframes (e.g., 3min) for dynamic range-building.
Combine with volume, VWAP, trendlines, or price action for breakout confirmation.
JXMJXRS - Anchor Bias ToolThe Anchor Bias Tool is a precision-based market structure tool designed to help traders visually quantify bias from any significant market event. Rather than relying on subjective trendlines or reactive signals, this tool lets you define a specific candle. Typically tied to a news event, breakout, or key swing point and then monitor how price behaves from that point forward.
You set an anchor candle using a specific date and time (UTC). The tool draws a horizontal anchor line at the closing price of that candle, calculates real-time price deviation from that level as a percentage, and then identifies whether price is in a bullish, bearish, or neutral zone based on how far it has moved from the anchor. This creates a clear, objective method for assessing whether the market is following through on an event or fading it.
Anchor Time (UTC) -
Define the exact candle you want to anchor from typically a reaction to a news event, breakout, or structural shift. All bias calculations begin from this candle’s closing price.
Bias Threshold (%) -
Sets how far price must move away from the anchor to be considered a valid directional bias. For example, 2.0% means price must be at least 2% above or below the anchor to enter bullish or bearish territory.
Show Bias Zones -
Toggles visual background shading on the chart. Green represents bullish bias, red for bearish. Helping you quickly identify where the market stands relative to the anchor.
Show Bias Labels -
Enables or disables the live label showing current bias (Bullish, Bearish, or Neutral) along with the real-time % deviation from the anchor level

Zero Lag MTF On Balance Volume Oscillator by CoffeeShopCryptoIntroducing the Zero Lag Multi Timeframe On Balance Volume Oscillator — the next evolution in volume trading.
Imagine tracking both your trading timeframe and any higher timeframe volume in real time, with absolutely zero lag and no waiting for candles to close.
Whether you’re comparing a 1-minute chart to a 2-hour chart, or a 5-minute to a daily, you’ll instantly see how volume is shifting across timeframes — live, as it happens.
This unique oscillator reveals volume divergences, confirms breakouts, and shows you exactly when buyers or sellers are in control by oscillating around a zero line — with no repainting, ever.
Don’t let delayed tools make you miss the move. Stay ahead of the market with the Zero Lag Multi Timeframe OBV Oscillator — and trade with volume on your side.
(OBV) was created by Joe Granville and introduced in his 1963 book Granville's New Key To Stock Market Profits.
The indicator is significant in history because it was one of the first known indicators to account for positive and negative volume flow.
However the concept and method most people use for today is simply observing a singular current timeframe chart of volume.
The purpose of this volume indicator is to tell you when both the higher timeframe volume and lower timeframe volume are moving in accordance with each other so you have a more clear understanding of the broad picture of the market movement.
This indicator uses the same basic concept of OBV but plots it as an oscillator.
Volume Divergence
What is a Volume Divergence:
A volume divergence takes place when the spread between the HTF and LTF volume isnt reaching higher highs or lower lows while price is reaching higher highs and lower lows. This is more accurate than noting divergence peaks from other indicators like the RSI or MACD because those are giving you an average but the OBV in its "RAW" setting is giving you actual bullish or bearish volume spikes per candle.
How to trade a Volume Divergence:
When you note either a bullish or bearish volume divergence you need to switch to a divergence trading strategy.
BULLISH DIVERGENCE STRATEGY
1.Zone out the range of candles that caused the divergence
2. If this is a bullish divergence, find the swing high on the volume between point A and B and mark that price level
3. This level should play out as a new support level for price.
4. Let the price break and retest this level
OR
BEARISH DIVERGENCE STRATEGY
1.Zone out the range of candles that caused the divergence
2. If this is a bearish divergence, find the swing low on the volume between point A and B and mark that price level
3. This level should play out as a new resistance level for price.
4. Let the price break and retest this level.
Confirming Trendline Breaks
While following short term trendlines on price, you can detect when price trends are broken.
If volume still supports the previous trend when the trendline is broken, you wait for price to react to a previous support or resistance level, or you want for price to retrace to a fair value gap and follow the trend that follows the supporting volume.
Confirming Trend Direction
Confirming a trend direction means that both the high timeframe and low timeframe trend agree with each other while price is moving away from a previously tested support or resistance area. Once price moves out of these key levels and the oscillator confirms a particular direction, you have the start of your new trend and are open for trades.
Volume Smoothing Settings
You can look at Volume in different ways. Commonly you want to smooth it to match your trading style. So if price is trending between range levels, you want to see HOW its trending. If your go to is to use an EMA, SMA, WMA, or other smoothing style, then set the ZLMTF OBV to match this in the "smoothing settings.
Here are the different ways you can set it and how it appears on the chart.
Raw Volume
This gives you the Raw volume calculations with no smoothing taking place.
(Commonly you would use this as price intercepts key levels.
SMA Smoothed Volume
This gives you the Raw volume smoothed over an SMA calculation which you would watch if you commonly use Smoothed Moving Averages on your chart while price is not near a support or resistance area.
Other Smoothing Outputs
You also have the ability to choose between EMA, SMMA, WMA, and VWAM types of smoothing to compare to the smoothing you use on your chart.

IU Inside/Harami candlestick patternDESCRIPTION
The IU Inside/Harami Candlestick Pattern indicator is designed to detect bullish and bearish inside bar formations, also known as Harami patterns. This tool gives users flexibility by allowing pattern detection based on candle wicks, bodies, or a combination of both. It highlights detected patterns using colored boxes and optional text labels on the chart, helping traders quickly identify areas of consolidation and potential reversals.
USER INPUTS :
Pattern Recognition Based on =
Choose between "Wicks", "Body", or "Both" to determine how the inside candle pattern is identified.
Show Box =
Toggle the appearance of colored boxes that highlight the pattern zone.
Show Text =
Toggle on-screen labels for "Bullish Inside" or "Bearish Inside" when patterns are detected.
INDICATOR LOGIC :
Bullish Inside Bar (Harami) is detected when:
* The current candle's high is lower and low is higher than the previous candle (wick-based),
* or the current candle’s open and close are inside the previous candle’s body (body-based),
* and the current candle is bullish while the previous is bearish.
Bearish Inside Bar (Harami) is detected when:
* The current candle's high is lower and low is higher than the previous candle (wick-based),
* or the current candle’s open and close are inside the previous candle’s body (body-based),
* and the current candle is bearish while the previous is bullish.
The user can choose wick-based, body-based, or both logics for pattern confirmation.
Boxes are drawn between the highs and lows of the pattern, and alert messages are generated upon confirmation.
Optional labels show the pattern name for quick visual identification.
WHY IT IS UNIQUE :
Offers three different logic modes: wick-based, body-based, or combined.
Highlights patterns visually with customizable boxes and labels.
Includes built-in alerts for immediate notifications.
Uses clean and transparent plotting without repainting.
HOW USER CAN BENEFIT FROM IT :
Receive real-time alerts when Inside/Harami patterns are formed.
Use the boxes and text labels to spot price compression zones and breakout potential.
Combine it with other tools like trendlines or support/resistance for enhanced accuracy.
Suitable for scalpers, swing traders, and price action traders looking to trade inside bar breakouts or reversals.
DISCLAIMER :
This indicator is not financial advice, it's for educational purposes only highlighting the power of coding( pine script) in TradingView, I am not a SEBI-registered advisor. Trading and investing involve risk, and you should consult with a qualified financial advisor before making any trading decisions. I do not guarantee profits or take responsibility for any losses you may incur.

Momentum Regression [BackQuant]Momentum Regression
The Momentum Regression is an advanced statistical indicator built to empower quants, strategists, and technically inclined traders with a robust visual and quantitative framework for analyzing momentum effects in financial markets. Unlike traditional momentum indicators that rely on raw price movements or moving averages, this tool leverages a volatility-adjusted linear regression model (y ~ x) to uncover and validate momentum behavior over a user-defined lookback window.
Purpose & Design Philosophy
Momentum is a core anomaly in quantitative finance — an effect where assets that have performed well (or poorly) continue to do so over short to medium-term horizons. However, this effect can be noisy, regime-dependent, and sometimes spurious.
The Momentum Regression is designed as a pre-strategy analytical tool to help you filter and verify whether statistically meaningful and tradable momentum exists in a given asset. Its architecture includes:
Volatility normalization to account for differences in scale and distribution.
Regression analysis to model the relationship between past and present standardized returns.
Deviation bands to highlight overbought/oversold zones around the predicted trendline.
Statistical summary tables to assess the reliability of the detected momentum.
Core Concepts and Calculations
The model uses the following:
Independent variable (x): The volatility-adjusted return over the chosen momentum period.
Dependent variable (y): The 1-bar lagged log return, also adjusted for volatility.
A simple linear regression is performed over a large lookback window (default: 1000 bars), which reveals the slope and intercept of the momentum line. These values are then used to construct:
A predicted momentum trendline across time.
Upper and lower deviation bands , representing ±n standard deviations of the regression residuals (errors).
These visual elements help traders judge how far current returns deviate from the modeled momentum trend, similar to Bollinger Bands but derived from a regression model rather than a moving average.
Key Metrics Provided
On each update, the indicator dynamically displays:
Momentum Slope (β₁): Indicates trend direction and strength. A higher absolute value implies a stronger effect.
Intercept (β₀): The predicted return when x = 0.
Pearson’s R: Correlation coefficient between x and y.
R² (Coefficient of Determination): Indicates how well the regression line explains the variance in y.
Standard Error of Residuals: Measures dispersion around the trendline.
t-Statistic of β₁: Used to evaluate statistical significance of the momentum slope.
These statistics are presented in a top-right summary table for immediate interpretation. A bottom-right signal table also summarizes key takeaways with visual indicators.
Features and Inputs
✅ Volatility-Adjusted Momentum : Reduces distortions from noisy price spikes.
✅ Custom Lookback Control : Set the number of bars to analyze regression.
✅ Extendable Trendlines : For continuous visualization into the future.
✅ Deviation Bands : Optional ±σ multipliers to detect abnormal price action.
✅ Contextual Tables : Help determine strength, direction, and significance of momentum.
✅ Separate Pane Design : Cleanly isolates statistical momentum from price chart.
How It Helps Traders
📉 Quantitative Strategy Validation:
Use the regression results to confirm whether a momentum-based strategy is worth pursuing on a specific asset or timeframe.
🔍 Regime Detection:
Track when momentum breaks down or reverses. Slope changes, drops in R², or weak t-stats can signal regime shifts.
📊 Trade Filtering:
Avoid false positives by entering trades only when momentum is both statistically significant and directionally favorable.
📈 Backtest Preparation:
Before running costly simulations, use this tool to pre-screen assets for exploitable return structures.
When to Use It
Before building or deploying a momentum strategy : Test if momentum exists and is statistically reliable.
During market transitions : Detect early signs of fading strength or reversal.
As part of an edge-stacking framework : Combine with other filters such as volatility compression, volume surges, or macro filters.
Conclusion
The Momentum Regression indicator offers a powerful fusion of statistical analysis and visual interpretation. By combining volatility-adjusted returns with real-time linear regression modeling, it helps quantify and qualify one of the most studied and traded anomalies in finance: momentum.

Contrarian RSIContrarian RSI Indicator
Pairs nicely with Contrarian 100 MA (optional hide/unhide buy/sell signals)
Description
The Contrarian RSI is a momentum-based technical indicator designed to identify potential reversal points in price action by combining a unique RSI calculation with a predictive range model inspired by the "Contrarian 5 Levels" logic. Unlike traditional RSI, which measures price momentum based solely on price changes, this indicator integrates a smoothed, weighted momentum calculation and predictive price ranges to generate contrarian signals. It is particularly suited for traders looking to capture reversals in trending or range-bound markets.
This indicator is versatile and can be used across various timeframes, though it performs best on higher timeframes (e.g., 1H, 4H, or Daily) due to reduced noise and more reliable signals. Lower timeframes may require additional testing and careful parameter tuning to optimize performance.
How It Works
The Contrarian RSI combines two primary components:
Predictive Ranges (5 Levels Logic): This calculates a smoothed price average that adapts to market volatility using an ATR-based mechanism. It helps identify significant price levels that act as potential support or resistance zones.
Contrarian RSI Calculation: A modified RSI calculation that uses weighted momentum from the predictive ranges to measure buying and selling pressure. The result is smoothed and paired with a user-defined moving average to generate clear signals.
The indicator generates buy (long) and sell (exit) signals based on crossovers and crossunders of user-defined overbought and oversold levels, making it ideal for contrarian trading strategies.
Calculation Overview
Predictive Ranges (5 Levels Logic):
Uses a custom function (pred_ranges) to calculate a dynamic price average (avg) based on the ATR (Average True Range) multiplied by a user-defined factor (mult).
The average adjusts only when the price moves beyond the ATR threshold, ensuring responsiveness to significant price changes while filtering out noise.
This calculation is performed on a user-specified timeframe (tf5Levels) for multi-timeframe analysis.
Contrarian RSI:
Compares consecutive predictive range values to calculate gains (g) and losses (l) over a user-defined period (crsiLength).
Applies a Gaussian weighting function (weight = math.exp(-math.pow(i / crsiLength, 2))) to prioritize recent price movements.
Computes a "wave ratio" (net_momentum / total_energy) to normalize momentum, which is then scaled to a 0–100 range (qrsi = 50 + 50 * wave_ratio).
Smooths the result with a 2-period EMA (qrsi_smoothed) for stability.
Moving Average:
Applies a user-selected moving average (SMA, EMA, WMA, SMMA, or VWMA) with a customizable length (maLength) to the smoothed RSI (qrsi_smoothed) to generate the final indicator value (qrsi_ma).
Signal Generation:
Long Entry: Triggered when qrsi_ma crosses above the oversold level (oversoldLevel, default: 1).
Long Exit: Triggered when qrsi_ma crosses below the overbought level (overboughtLevel, default: 99).
Entry and Exit Rules
Long Entry: Enter a long position when the Contrarian RSI (qrsi_ma) crosses above the oversold level (default: 1). This suggests the asset is potentially oversold and due for a reversal.
Long Exit: Exit the long position when the Contrarian RSI (qrsi_ma) crosses below the overbought level (default: 99), indicating a potential overbought condition and a reversal to the downside.
Customization: Adjust overboughtLevel and oversoldLevel to fine-tune sensitivity. Lower timeframes may benefit from tighter levels (e.g., 20 for oversold, 80 for overbought), while higher timeframes can use extreme levels (e.g., 1 and 99) for stronger reversals.
Timeframe Considerations
Higher Timeframes (Recommended): The indicator is optimized for higher timeframes (e.g., 1H, 4H, Daily) due to its reliance on predictive ranges and smoothed momentum, which perform best with less market noise. These timeframes typically yield more reliable reversal signals.
Lower Timeframes: The indicator can be used on lower timeframes (e.g., 5M, 15M), but signals may be noisier and require additional confirmation (e.g., from price action or other indicators). Extensive backtesting and parameter optimization (e.g., adjusting crsiLength, maLength, or mult) are recommended for lower timeframes.
Inputs
Contrarian RSI Length (crsiLength): Length for RSI momentum calculation (default: 5).
RSI MA Length (maLength): Length of the moving average applied to the RSI (default: 1, effectively no MA).
MA Type (maType): Choose from SMA, EMA, WMA, SMMA, or VWMA (default: SMA).
Overbought Level (overboughtLevel): Upper threshold for exit signals (default: 99).
Oversold Level (oversoldLevel): Lower threshold for entry signals (default: 1).
Plot Signals on Main Chart (plotOnChart): Toggle to display signals on the price chart or the indicator panel (default: false).
Plotted on Lower:
Plotted on Chart:
5 Levels Length (length5Levels): Length for predictive range calculation (default: 200).
Factor (mult): ATR multiplier for predictive ranges (default: 6.0).
5 Levels Timeframe (tf5Levels): Timeframe for predictive range calculation (default: chart timeframe).
Visuals
Contrarian RSI MA: Plotted as a yellow line, representing the smoothed Contrarian RSI with the applied moving average.
Overbought/Oversold Lines: Red line for overbought (default: 99) and green line for oversold (default: 1).
Signals: Blue circles for long entries, white circles for long exits. Signals can be plotted on the main chart (plotOnChart = true) or the indicator panel (plotOnChart = false).
Usage Notes
Use the indicator in conjunction with other tools (e.g., support/resistance, trendlines, or volume) to confirm signals.
Test extensively on your chosen timeframe and asset to optimize parameters like crsiLength, maLength, and mult.
Be cautious with lower timeframes, as false signals may occur due to market noise.
The indicator is designed for contrarian strategies, so it works best in markets with clear reversal patterns.
Disclaimer
This indicator is provided for educational and informational purposes only. Always conduct thorough backtesting and risk management before using any indicator in live trading. The author is not responsible for any financial losses incurred.

Bollinger Bands Entry/Exit ThresholdsBollinger Bands Entry/Exit Thresholds
Author of enhancements: chuckaschultz
Inspired and adapted from the original 'Bollinger Bands Breakout Oscillator' by LuxAlgo
Overview
Pairs nicely with Contrarian 100 MA
The Bollinger Bands Entry/Exit Thresholds is a powerful momentum-based indicator designed to help traders identify potential entry and exit points in trending or breakout markets. By leveraging Bollinger Bands, this indicator quantifies price deviations from the bands to generate bullish and bearish momentum signals, displayed as an oscillator. It includes customizable entry and exit signals based on user-defined thresholds, with visual cues plotted either on the oscillator panel or directly on the price chart.
This indicator is ideal for traders looking to capture breakout opportunities or confirm trend strength, with flexible settings to adapt to various markets and trading styles.
How It Works
The Bollinger Bands Entry/Exit Thresholds calculates two key metrics:
Bullish Momentum (Bull): Measures the extent to which the price exceeds the upper Bollinger Band, expressed as a percentage (0–100).
Bearish Momentum (Bear): Measures the extent to which the price falls below the lower Bollinger Band, also expressed as a percentage (0–100).
The indicator generates:
Long Entry Signals: Triggered when the bearish momentum (bear) crosses below a user-defined Long Threshold (default: 40). This suggests weakening bearish pressure, potentially indicating a reversal or breakout to the upside.
Exit Signals: Triggered when the bullish momentum (bull) crosses below a user-defined Sell Threshold (default: 80), indicating a potential reduction in bullish momentum and a signal to exit long positions.
Signals are visualized as tiny colored dots:
Long Entry: Blue dots, plotted either at the bottom of the oscillator or below the price bar (depending on user settings).
Exit Signal: White dots, plotted either at the top of the oscillator or above the price bar.
Calculation Methodology
Bollinger Bands:
A user-defined Length (default: 14) is used to calculate an Exponential Moving Average (EMA) of the source price (default: close).
Standard deviation is computed over the same length, multiplied by a user-defined Multiplier (default: 1.0).
Upper Band = EMA + (Standard Deviation × Multiplier)
Lower Band = EMA - (Standard Deviation × Multiplier)
Bull and Bear Momentum:
For each bar in the lookback period (length), the indicator calculates:
Bullish Momentum: The sum of positive deviations of the price above the upper band, normalized by the total absolute deviation from the upper band, scaled to a 0–100 range.
Bearish Momentum: The sum of positive deviations of the price below the lower band, normalized by the total absolute deviation from the lower band, scaled to a 0–100 range.
Formula:
bull = (sum of max(price - upper, 0) / sum of abs(price - upper)) * 100
bear = (sum of max(lower - price, 0) / sum of abs(lower - price)) * 100
Signal Generation:
Long Entry: Triggered when bear crosses below the Long Threshold.
Exit: Triggered when bull crosses below the Sell Threshold.
Settings
Length: Lookback period for EMA and standard deviation (default: 14).
Multiplier: Multiplier for standard deviation to adjust Bollinger Band width (default: 1.0).
Source: Input price data (default: close).
Long Threshold: Bearish momentum level below which a long entry signal is generated (default: 40).
Sell Threshold: Bullish momentum level below which an exit signal is generated (default: 80).
Plot Signals on Main Chart: Option to display entry/exit signals on the price chart instead of the oscillator panel (default: false).
Style:
Bullish Color: Color for bullish momentum plot (default: #f23645).
Bearish Color: Color for bearish momentum plot (default: #089981).
Visual Features
Bull and Bear Plots: Displayed as colored lines with gradient fills for visual clarity.
Midline: Horizontal line at 50 for reference.
Threshold Lines: Dashed green line for Long Threshold and dashed red line for Sell Threshold.
Signal Dots:
Long Entry: Tiny blue dots (below price bar or at oscillator bottom).
Exit: Tiny white dots (above price bar or at oscillator top).
How to Use
Add to Chart: Apply the indicator to your TradingView chart.
Adjust Settings: Customize the Length, Multiplier, Long Threshold, and Sell Threshold to suit your trading strategy.
Interpret Signals:
Enter a long position when a blue dot appears, indicating bearish momentum dropping below the Long Threshold.
Exit the long position when a white dot appears, indicating bullish momentum dropping below the Sell Threshold.
Toggle Plot Location: Enable Plot Signals on Main Chart to display signals on the price chart for easier integration with price action analysis.
Combine with Other Tools: Use alongside other indicators (e.g., trendlines, support/resistance) to confirm signals.
Notes
This indicator is inspired by LuxAlgo’s Bollinger Bands Breakout Oscillator but has been enhanced with customizable entry/exit thresholds and signal plotting options.
Best used in conjunction with other technical analysis tools to filter false signals, especially in choppy or range-bound markets.
Adjust the Multiplier to make the Bollinger Bands wider or narrower, affecting the sensitivity of the momentum calculations.
Disclaimer
This indicator is provided for educational and informational purposes only.

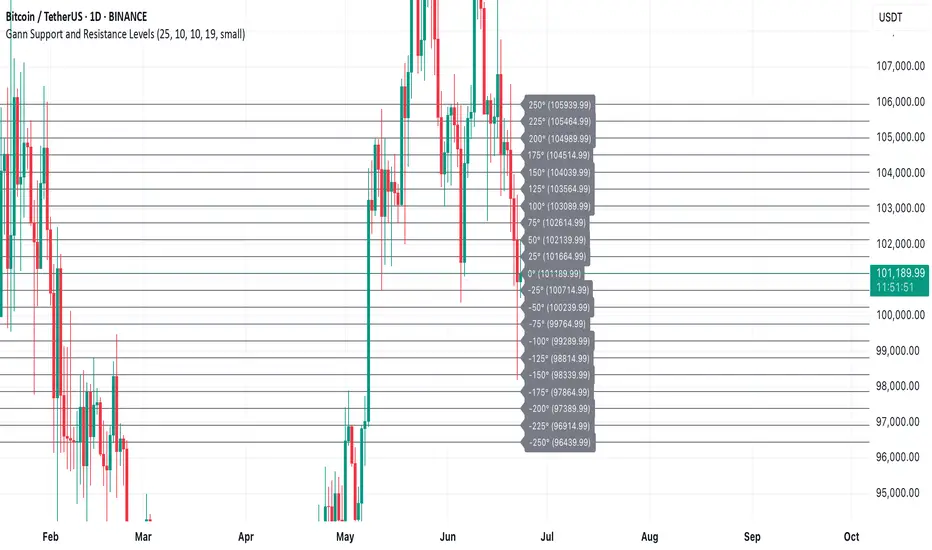
Gann Support and Resistance LevelsThis indicator plots dynamic Gann Degree Levels as potential support and resistance zones around the current market price. You can fully customize the Gann degree step (e.g., 45°, 30°, 90°), the number of levels above and below the price, and the price movement per degree to fine-tune the levels to your strategy.
Key Features:
✅ Dynamic levels update automatically with the live price
✅ Adjustable degree intervals (Gann steps)
✅ User control over how many levels to display above and below
✅ Fully customizable label size, label color, and text color for mobile-friendly visibility
✅ Clean visual design for easy chart analysis
How to Use:
Gann levels can act as potential support and resistance zones.
Watch for price reactions at major degrees like 0°, 90°, 180°, and 270°.
Can be combined with other technical tools like price action, trendlines, or Gann fans for deeper analysis.
📌 This tool is perfect for traders using Gann theory, grid-based strategies, or those looking to enhance their visual trading setups with structured levels.
Cumulative Volume Delta📊 Indicator Name:
Cumulative Volume Delta (CVD) + Candle Divergence (Color DIfference)
📌 Purpose:
This indicator visualizes volume delta over a user-defined time anchor and highlights divergence between volume-based momentum and price movement. It's especially useful for identifying potential reversals, fakeouts, or hidden buying/selling pressure.
🔍 How It Works:
1. Volume Delta Calculation (CVD Candles):
The script uses ta.requestVolumeDelta() to approximate volume delta data over a chosen anchor period (e.g., 1D).
Volume delta = Buy Volume – Sell Volume
Each candle on the CVD chart represents changes in cumulative volume delta, with OHLC-style values:
openVolume: cumulative delta at the start of the bar
lastVolume: cumulative delta at the end of the bar
maxVolume, minVolume: intra-bar high and low
2. Visual Representation (CVD Candles):
Green/Teal candle: Delta is increasing (buying pressure dominates)
Red candle: Delta is decreasing (selling pressure dominates)
3. Divergence Detection:
The script compares the direction of the price candle with the direction of the CVD candle:
Price Up + CVD Down → Possible hidden selling (bearish divergence)
Price Down + CVD Up → Possible hidden buying (bullish divergence)
4. Color Highlighting:
Orange candle on the CVD chart signals divergence between price and volume delta.
This color override helps you quickly spot potential discrepancies between price movement and underlying volume pressure.
5. Alerting:
An alertcondition is added so you can receive a notification whenever a divergence occurs.
⚙️ User Inputs:
Anchor period (e.g., 1D): Timeframe over which the CVD is anchored.
Use custom timeframe: Allows you to override and define the internal lower timeframe used for volume estimation (e.g., 1-min).
📈 How to Use It:
✅ Bullish Divergence (Price down, CVD up)
This may indicate:
Buyers absorbing selling pressure.
A potential reversal to the upside.
Hidden accumulation.
🚫 Bearish Divergence (Price up, CVD down)
This may indicate:
Sellers stepping in despite upward price.
A potential reversal to the downside.
Hidden distribution.
🧠 Trading Insights:
CVD is often used by order flow traders or those analyzing market depth and volume imbalances.
This version lets you visually align price action with underlying volume, improving decision-making.
The divergence signal can be combined with other technical tools like support/resistance, candlestick patterns, or trendlines for confirmation.

Demand Index (Hybrid Sibbet) by TradeQUODemand Index (Hybrid Sibbet) by TradeQUO \
\Overview\
The Demand Index (DI) was introduced by James Sibbet in the early 1990s to gauge “real” buying versus selling pressure by combining price‐change information with volume intensity. Unlike pure price‐based oscillators (e.g. RSI or MACD), the DI highlights moves backed by above‐average volume—helping traders distinguish genuine demand/supply from false breakouts or low‐liquidity noise.
\Calculation\
\
\ \Step 1: Weighted Price (P)\
For each bar t, compute a weighted price:
```
Pₜ = Hₜ + Lₜ + 2·Cₜ
```
where Hₜ=High, Lₜ=Low, Cₜ=Close of bar t.
Also compute Pₜ₋₁ for the prior bar.
\ \Step 2: Raw Range (R)\
Calculate the two‐bar range:
```
Rₜ = max(Hₜ, Hₜ₋₁) – min(Lₜ, Lₜ₋₁)
```
This Rₜ is used indirectly in the exponential dampener below.
\ \Step 3: Normalize Volume (VolNorm)\
Compute an EMA of volume over n₁ bars (e.g. n₁=13):
```
EMA_Volₜ = EMA(Volume, n₁)ₜ
```
Then
```
VolNormₜ = Volumeₜ / EMA_Volₜ
```
If EMA\_Volₜ ≈ 0, set VolNormₜ to a small default (e.g. 0.0001) to avoid division‐by‐zero.
\ \Step 4: BuyPower vs. SellPower\
Calculate “raw” BuyPowerₜ and SellPowerₜ depending on whether Pₜ > Pₜ₋₁ (bullish) or Pₜ < Pₜ₋₁ (bearish). Use an exponential dampener factor Dₜ to moderate extreme moves when true range is small. Specifically:
• If Pₜ > Pₜ₋₁,
```
BuyPowerₜ = (VolNormₜ) / exp
```
otherwise
```
BuyPowerₜ = VolNormₜ.
```
• If Pₜ < Pₜ₋₁,
```
SellPowerₜ = (VolNormₜ) / exp
```
otherwise
```
SellPowerₜ = VolNormₜ.
```
Here, H₀ and L₀ are the very first bar’s High/Low—used to calibrate the scale of the dampening. If the denominator of the exponential is near zero, substitute a small epsilon (e.g. 1e-10).
\ \Step 5: Smooth Buy/Sell Power\
Apply a short EMA (n₂ bars, typically n₂=2) to each:
```
EMA_Buyₜ = EMA(BuyPower, n₂)ₜ
EMA_Sellₜ = EMA(SellPower, n₂)ₜ
```
\ \Step 6: Raw Demand Index (DI\_raw)\
```
DI_rawₜ = EMA_Buyₜ – EMA_Sellₜ
```
A positive DI\_raw indicates that buying force (normalized by volume) exceeds selling force; a negative value indicates the opposite.
\ \Step 7: Optional EMA Smoothing on DI (DI)\
To reduce choppiness, compute an EMA over DI\_raw (n₃ bars, e.g. n₃ = 1–5):
```
DIₜ = EMA(DI_raw, n₃)ₜ.
```
If n₃ = 1, DI = DI\_raw (no further smoothing).
\
\Interpretation\
\
\ \Crossing Zero Line\
• DI\_raw (or DI) crossing from below to above zero signals that cumulative buying pressure (over the chosen smoothing window) has overcome selling pressure—potential Long signal.
• Crossing from above to below zero signals dominant selling pressure—potential Short signal.
\ \DI\_raw vs. DI (EMA)\
• When DI\_raw > DI (the EMA of DI\_raw), bullish momentum is accelerating.
• When DI\_raw < DI, bullish momentum is weakening (or bearish acceleration).
\ \Divergences\
• If price makes new highs while DI fails to make higher highs (DI\_raw or DI declining), this hints at weakening buying power (“bearish divergence”), possibly preceding a reversal.
• If price makes new lows while DI fails to make lower lows (“bullish divergence”), this may signal waning selling pressure and a potential bounce.
\ \Volume Confirmation\
• A strong price move without a corresponding rise in DI often indicates low‐volume “fake” moves.
• Conversely, a modest price move with a large DI spike suggests true institutional participation—often a more reliable breakout.
\
\Usage Notes & Warnings\
\
\ \Never Use DI in Isolation\
It is a \filter\ and \confirmation\ tool—combine with price‐action (trendlines, support/resistance, candlestick patterns) and risk management (stop‐losses) before executing trades.
\ \Parameter Selection\
• \Vol EMA length (n₁)\: Commonly 13–20 bars. Shorter → more responsive to volume spikes, but noisier.
• \Buy/Sell EMA length (n₂)\: Typically 2 bars for fast smoothing.
• \DI smoothing (n₃)\: Usually 1 (no smoothing) or 3–5 for moderate smoothing. Long DI\_EMA (e.g. 20–50) gives a slower signal.
\ \Market Adaptation\
Works well in liquid futures, indices, and heavily traded stocks. In thinly traded or highly erratic markets, adjust n₁ upward (e.g., 20–30) to reduce noise.
---
\In Summary\
The Demand Index (James Sibbet) uses a three‐stage smoothing (volume → Buy/Sell Power → DI) to reveal true demand/supply imbalance. By combining normalized volume with price change, Sibbet’s DI helps traders identify momentum backed by real participation—filtering out “empty” moves and spotting early divergences. Always confirm DI signals with price action and sound risk controls before trading.

Adaptive Volume‐Demand‐Index (AVDI)Demand Index (according to James Sibbet) – Short Description
The Demand Index (DI) was developed by James Sibbet to measure real “buying” vs. “selling” strength (Demand vs. Supply) using price and volume data. It is not a standalone trading signal, but rather a filter and trend confirmer that should always be used together with chart structure and additional indicators.
---
\ 1. Calculation Basis\
1. Volume Normalization
$$
\text{normVol}_t
= \frac{\text{Volume}_t}{\mathrm{EMA}(\text{Volume},\,n_{\text{Vol}})_t}
\quad(\text{e.g., }n_{\text{Vol}} = 13)
$$
This smooths out extremely high volume spikes and compares them to the average (≈ 1 means “average volume”).
2. Price Factor
$$
\text{priceFactor}_t
= \frac{\text{Close}_t - \text{Open}_t}{\text{Open}_t}.
$$
Positive values for bullish bars, negative for bearish bars.
3. Component per Bar
$$
\text{component}_t
= \text{normVol}_t \times \text{priceFactor}_t.
$$
If volume is above average (> 1) and the price rises slightly, this yields a noticeably positive value; conversely if the price falls.
4. Raw DI (Rolling Sum)
Over a window of \$w\$ bars (e.g., 20):
$$
\text{RawDI}_t
= \sum_{i=0}^{w-1} \text{component}_{\,t-i}.
$$
Alternatively, recursively for \$t \ge w\$:
$$
\text{RawDI}_t
= \text{RawDI}_{t-1}
+ \text{component}_t
- \text{component}_{\,t-w}.
$$
5. Optional EMA Smoothing
An EMA over RawDI (e.g., \$n\_{\text{DI}} = 50\$) reduces short-term fluctuations and highlights medium-term trends:
$$
\text{EMA\_DI}_t
= \mathrm{EMA}(\text{RawDI},\,n_{\text{DI}})_t.
$$
6.Zero Line
Handy guideline:
RawDI > 0: Accumulated buying power dominates.
RawDI < 0: Accumulated selling power dominates.
2. Interpretation & Application
Crossing Zero
RawDI above zero → Indication of increasing buying pressure (potential long signal).
RawDI below zero → Indication of increasing selling pressure (potential short signal).
Not to be used alone for entry—always confirm with price action.
RawDI vs. EMA_DI
RawDI > EMA\_DI → Acceleration of demand.
RawDI < EMA\_DI → Weakening of demand.
Divergences
Price makes a new high, RawDI does not make a higher high → potential weakness in the uptrend.
Price makes a new low, RawDI does not make a lower low → potential exhaustion of the downtrend.
3. Typical Signals (for Beginners)
\ 1. Long Setup\
RawDI crosses zero from below,
RawDI > EMA\_DI (acceleration),
Price closes above a short-term swing high or resistance.
Stop-Loss: just below the last swing low, Take-Profit/Trailing: on reversal signals or fixed R\:R.
2. Short Setup
RawDI crosses zero from above,
RawDI < EMA\_DI (increased selling pressure),
Price closes below a short-term swing low or support.
Stop-Loss: just above the last swing high.
---
4. Notes and Parameters
Recommended Values (Beginners):
Volume EMA (n₍Vol₎) = 13
RawDI window (w) = 20
EMA over DI (n₍DI₎) = 50 (medium-term) or 1 (no smoothing)
Attention:\
NEVER use in isolation. Always in combination with price action analysis (trendlines, support/resistance, candlestick patterns).
Especially during volatile news phases, RawDI can fluctuate strongly → EMA\_DI helps to avoid false signals.
---
Conclusion The Demand Index by James Sibbet is a powerful filter to assess price movements by their volume backing. It shows whether a rally is truly driven by demand or merely a short-term volume anomaly. In combination with classic chart analysis and risk management, it helps to identify robust entry points and potential trend reversals earlier.

Gann Single SwingGann Single Swing Indicator
The Gann Single Swing indicator is a sophisticated tool rooted in the geometric and cyclical market analysis principles pioneered by William Delbert Gann. Designed for traders who value deep market structure analysis, this indicator leverages the interplay of price and time to identify key support and resistance zones, potential reversal points, and critical price-time synchronization areas. Its unique approach makes it an invaluable instrument for those employing Gann-based methodologies or seeking a systematic way to decode complex market dynamics.
What It Does
The Gann Single Swing indicator is built to pinpoint high-probability zones for price action, such as support and resistance levels, where traders can logically initiate long or short positions. By analyzing a user-defined price swing (a move between two selected points, such as a local high and low), the indicator constructs a geometric framework that reveals hidden patterns in market movements. It identifies:
Support and Resistance Zones: Key price levels where the market is likely to reverse or consolidate.
Temporal Reversal Zones: Specific time periods where price reversals are more probable due to time-price resonance.
Price-Time Synchronization Points: Areas where price and time align to signal potential market turning points.
How It Works
The indicator’s algorithm is grounded in Gann’s geometric principles, focusing on the relationship between price movements and time cycles. Here’s a high-level overview of its process:
Swing Selection: Traders select two key points on the chart (e.g., a local minimum and maximum) to define a price swing.
Channel Construction: The swing is encapsulated within a dynamic channel, forming the foundation of the geometric model.
Gann Fan Application: A Gann Fan is applied to the channel to calculate critical angles, representing the balance between price and time. These angles help identify resonant points that align with the channel’s central axis.
Squared Channel Analysis: The algorithm creates “squared” channels, geometrically derived sub-structures, analyzed for intersections and alignments to project external support and resistance zones beyond the base swing.
Internal Zone Mapping: Within the base swing, a reverse Gann Fan maps internal zones, highlighting areas of price-time convergence that may act as dynamic support or resistance.
Zone Projection: The indicator synthesizes these calculations to plot precise zones of support, resistance, and potential reversals, both spatially (price levels) and temporally (time-based zones).
While the exact mathematical formulations remain proprietary, the indicator relies on time-tested Gann techniques, such as angle-based analysis and cyclical resonance, to deliver actionable insights.
How to Use It
Select the Swing: Identify two significant points on the chart (e.g., a recent high and low) to define the swing. These points serve as the anchor for the indicator’s calculations.
Interpret the Zones: The indicator plots support and resistance zones (both price-based and time-based). Look for price action near these zones to identify potential entry or exit points.
Combine with Other Tools: For best results, use alongside other Gann-based tools (e.g., Gann Squares or Time Cycles) or traditional technical analysis (e.g., trendlines, Fibonacci levels) to confirm signals.
Monitor Temporal Zones: Pay attention to time-based reversal zones, as they may indicate when a price move is likely to occur, enhancing trade timing.
Why It’s Unique
Unlike conventional indicators that rely on moving averages, RSI, or other common metrics, the Gann Single Swing indicator offers a proprietary blend of Gann’s geometric and cyclical principles. Its ability to integrate price and time into a cohesive model sets it apart, providing traders with a deeper understanding of market structure. The indicator does not use public domain code or standard technical indicators, ensuring originality and value for traders seeking advanced tools.
Who It’s For
This indicator is ideal for:
Traders familiar with Gann’s methodologies who want to automate and enhance their geometric analysis.
Advanced traders looking to uncover hidden market patterns through price-time relationships.
Those seeking a robust, non-traditional tool for identifying high-probability trade setups.
The Gann Single Swing indicator is not a black-box forecasting tool but a powerful framework for dissecting market behavior. By combining user-defined inputs with sophisticated geometric calculations, it empowers traders to make informed decisions based on the timeless principles of Gann’s market philosophy.

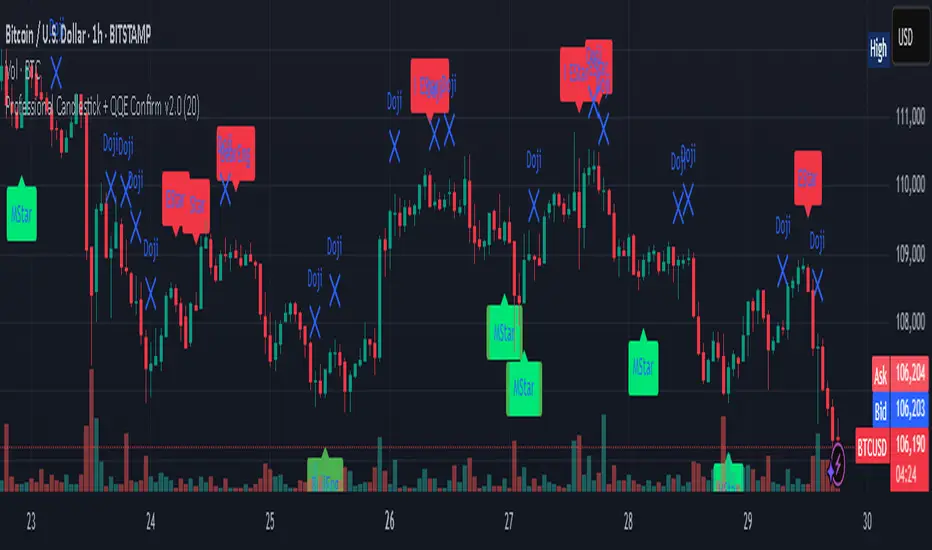
Professional Candlestick + QQE Confirm v2.0 Professional Candlestick + QQE Confirm v1.0
This script combines powerful candlestick pattern detection with QQE momentum confirmation to improve signal reliability for swing trading and trend entries.
🔍 What It Does:
- Detects high-probability candlestick patterns (e.g. Pin Bars, Engulfing, Morning/Evening Stars)
- Confirms signals with the QQE indicator to reduce false entries
- Highlights buy/sell zones using combined logic
⚙️ Key Features:
- Multiple candlestick patterns, each toggleable
- QQE filtering to confirm valid breakouts or reversals
- Signal labels with strength grading
- Optional alert settings
📊 Best Use:
- Works well on 1H, 4H, and Daily charts
- Combine with trendlines or support/resistance for stronger entries
- Avoids signals in sideways/choppy markets
---
This is a tool for traders who want to filter out weak candlestick signals using a trusted momentum indicator (QQE) for more accurate entries.