Key Session LevelsKey Session Levels - Indicator Guide
Created by: MecarderoAurum
Why This Indicator Exists: An Overview
The "Key Session Levels" indicator is a comprehensive tool for day traders that automatically plots the most critical price levels from the current premarket and the previous two full trading days. These levels are watched by countless traders and often act as significant areas of support and resistance.
This indicator provides a clear, objective map of these key zones, helping traders anticipate potential turning points, identify areas of confluence, and make more informed trading decisions without having to manually draw and manage these lines every day.
Features & How to Use Them
This indicator plots several types of important historical levels on your chart. Each one is fully customizable.
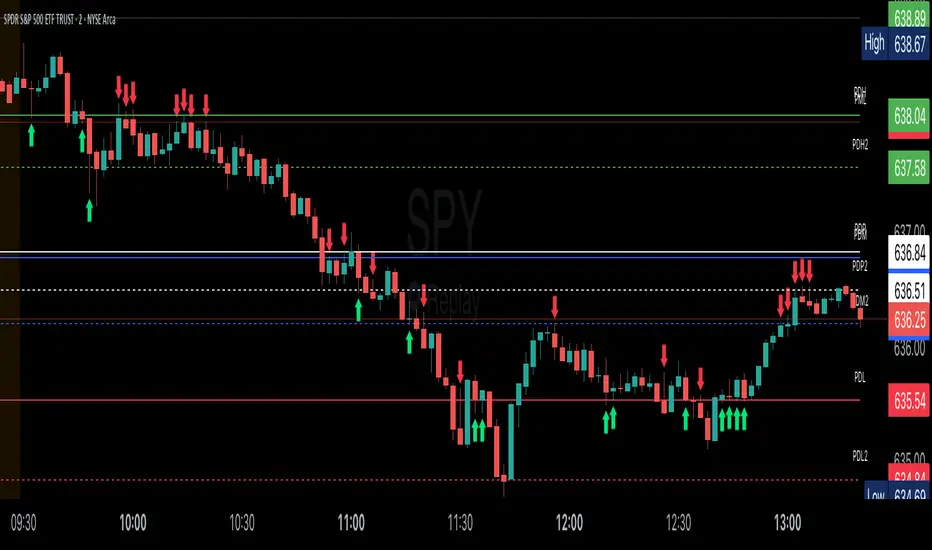
1. Premarket Levels (PMH / PML)
What they are: The highest (PMH) and lowest (PML) prices reached during the current day's premarket session (04:00 - 09:30 ET).
Why they matter: The premarket high and low are the first significant levels established for the trading day. They often act as initial support or resistance once the market opens.
How to use them: In the settings under "Premarket Levels," you can toggle the visibility of the PMH and PML, and customize their color, line style, and width.
2. Prior Day Levels (PDH / PDL / PDM / PDP)
What they are: The key price points from the previous full trading day.
PDH: Prior Day High
PDL: Prior Day Low
PDM: Prior Day Midpoint (the exact middle of the PDH and PDL)
PDP: Prior Day Pivot (a classic pivot point calculation)
Why they matter: These are often the most important levels for the current trading day. The market frequently tests the previous day's high and low.
How to use them: Under the "Prior Day" settings, you can enable or disable each of these four levels and customize their appearance.
3. 2-Day Prior Levels (PDH2 / PDL2 / etc.)
What they are: The same set of key levels (High, Low, Mid, Pivot) from two trading days ago.
Why they matter: These levels can still be highly relevant, especially if the market is trading within a multi-day range or returning to test a significant prior level.
How to use them: Under the "2-Day Prior" settings, you can customize the visibility and style of these levels. They are styled with more transparency by default to distinguish them from the more recent prior day's levels.
4. General Settings
Days of History: This setting allows you to control how many past days of historical lines are kept on your chart. This is excellent for back-testing strategies and seeing how price has reacted to these levels in the past.
Label Settings: You can customize the color and size of the on-chart labels (e.g., "PDH," "PML") for better visibility.
Sample Strategy: The Key Level Rejection
This strategy focuses on using the indicator's levels to identify potential reversals at key areas of support or resistance.
Identify a Key Level: Watch as the price approaches a significant level plotted by the indicator, such as the Prior Day High (PDH) or the Premarket Low (PML).
Look for Rejection: Do not trade simply because the price touches the level. Wait for a price action signal that confirms the level is holding. This could be a bearish engulfing candle or a shooting star pattern at a resistance level like PDH, or a bullish hammer or morning star pattern at a support level like PML.
Entry: Once you see a clear rejection candle, enter a trade in the direction of the rejection. For a bearish rejection at the PDH, you would enter a short position.
Stop-Loss: A logical place for a stop-loss is just above the high of the rejection candle (for a short trade) or just below the low of the rejection candle (for a long trade). This defines your risk clearly.
Profit Target: Your first profit target could be the next key level plotted by the indicator. For example, if you shorted a rejection at the PDH, your first target might be the Premarket High (PMH) or the day's opening price.
Penunjuk Pine Script®