[blackcat] L2 Composite SMA and BIAS ScalperLevel: 2
Background
A simple moving average (SMA) calculates the average of a selected price range, usually closing prices, based on the number of periods in that range. A simple moving average is a technical indicator that can be used to determine whether an asset price is holding a bull, a bear, or is reversing.
The bias shows the moving average rate of deviation. Also known as the rate of deviation, or y-value for short, is an indicator that reflects the degree of deviation between the price and the SMA over a given period by calculating the percentage difference between the market index or the closing price and a moving average to allow for receive that the price reverses or recovers due to a deviation from the moving average trend with strong fluctuations and the price moves within the normal fluctuation range Build credibility to continue the original potential.
Function
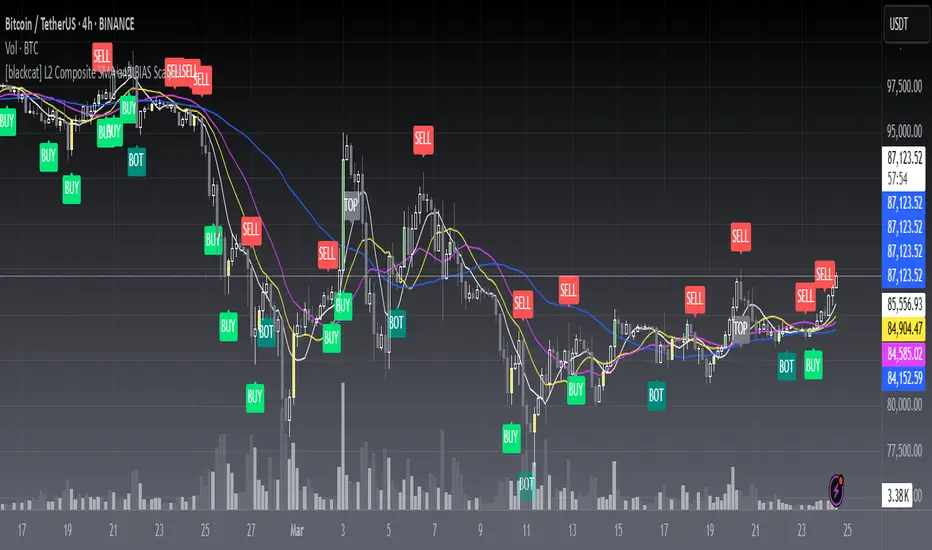
L2 Composite SMA and BIAS Scalper is mainly based on a cluster of simple moving averages and their bias values to produce long and short entry points. Three different strategy to generate long and short entries are demostrated together. That is why this is called "Composite".
Key Signal
botsig --> indicating bottom zone
topsig --> indicating top zone
buysigI --> long entry type I
buysigII --> long entry type II
buysigIII --> long entry type III
selsigI --> short entry type I
selsigII --> short entry type II
selsigIII --> short entry type III
Pros and Cons
Pros:
1. common sma(), rsi() and bias() are utizlied to generate exact long and short entries
2. alerts for bottom and top zones
Cons:
1. SMA parameters may need optimization for specific trading pairs
2. No stop loss or take profit scheme is introduced.
Remarks
This is promising but need efforts to refine it.
Readme
In real life, I am a prolific inventor. I have successfully applied for more than 60 international and regional patents in the past 12 years. But in the past two years or so, I have tried to transfer my creativity to the development of trading strategies. Tradingview is the ideal platform for me. I am selecting and contributing some of the hundreds of scripts to publish in Tradingview community. Welcome everyone to interact with me to discuss these interesting pine scripts.
The scripts posted are categorized into 5 levels according to my efforts or manhours put into these works.
Level 1 : interesting script snippets or distinctive improvement from classic indicators or strategy. Level 1 scripts can usually appear in more complex indicators as a function module or element.
Level 2 : composite indicator/strategy. By selecting or combining several independent or dependent functions or sub indicators in proper way, the composite script exhibits a resonance phenomenon which can filter out noise or fake trading signal to enhance trading confidence level.
Level 3 : comprehensive indicator/strategy. They are simple trading systems based on my strategies. They are commonly containing several or all of entry signal, close signal, stop loss, take profit, re-entry, risk management, and position sizing techniques. Even some interesting fundamental and mass psychological aspects are incorporated.
Level 4 : script snippets or functions that do not disclose source code. Interesting element that can reveal market laws and work as raw material for indicators and strategies. If you find Level 1~2 scripts are helpful, Level 4 is a private version that took me far more efforts to develop.
Level 5 : indicator/strategy that do not disclose source code. private version of Level 3 script with my accumulated script processing skills or a large number of custom functions. I had a private function library built in past two years. Level 5 scripts use many of them to achieve private trading strategy.
Penunjuk Pine Script®