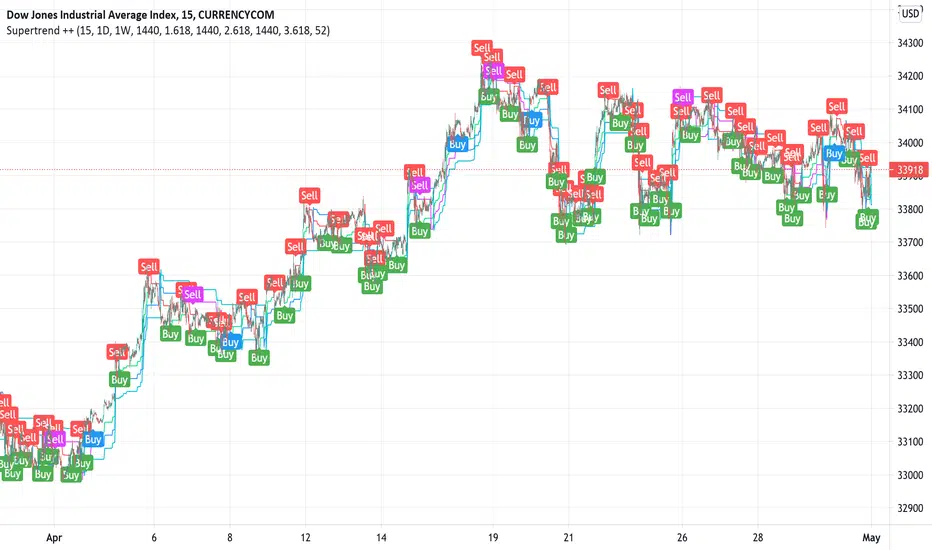
The Zone Trades v1.0The Zone is mention in New Trading Dimensions by Bill Williams,PhD.
The Zone is used for Entry Signal
Green Zone are painting Green Bars when Awesome Oscillator (AO) and Accelerater/Decelerator (AC) are both increasing.
Red Zone are painting Red Bars when Awesome Oscillator (AO) and Accelerater/Decelerator (AC) are both decreasing.
Gray Zone are painting Gray Bars AO and AC in difference changing
Gray Zone are indicate the indecision between bulls and bears.
Bill Williams, PhD. mention that Green Zone or Red Zone usually happen 6-8 bars Continuously.
The First Bar that change to be Green or Red color is the Signal Bar.
Entry Signal is the second bar in the same color as the Signal bar happen with Volume
Price go higher the high of previous Green Bar is Buy Signal. Entry Buy (Long) and place Stop at 1 tick lower the Low of previous bar.
Price go ;ower the Low of previous Red Bars is Sell Signal. Entry Sell (Short) and place Stop at 1 tick higher the High of previous bar.
Do not Entry if Green Bars or Red Bars completed 5 bars continuously.
Cari dalam skrip untuk "entry"
The Zone Trades v1.0The Zone v.1.0
The Zone is mention in New Trading Dimensions by Bill Williams,PhD. The Zone is used for Entry Signal of Both Long and Short side.
Green Zone are painting Green Bars when Awesome Oscillator (AO) and Accelerater/Decelerator (AC) are both increasing.
Red Zone are painting Red Bars when Awesome Oscillator (AO) and Accelerater/Decelerator (AC) are both decreasing.
Gray Zone are painting Gray Bars AO and AC in difference changing. Gray Zone are indicate the indecision between bulls and bears.
Bill Williams, PhD. mention that Green Zone or Red Zone usually happen 6-8 bars Continuously.
The First Bar that change to be Green or Red color is the Signal Bar.
Entry Signal is the second bar in the same color as the Signal bar happen with Volume
Price go higher the high of previous Green Bar is Buy Signal. Entry Buy (Long) and place Stop at 1 tick lower the Low of previous bar.
Price go ;ower the Low of previous Red Bars is Sell Signal. Entry Sell (Short) and place Stop at 1 tick higher the High of previous bar.
Do not Entry if Green Bars or Red Bars completed 5 bars continuously.
Madrid Trend TradingMadrid Trend Trading is an indicator that shows Momentum direction and strength based on a given trend (pair of MA's). It is useful to detect the direction of the trend, Momentum divergences with the trend and possible trend reversals.
Parameters
1. Fast MA Length
2. Slow MA Length
3. Signal Length
Trading with MTT
1. MTT > 0 and increasing (Lime) : Long position
2. MTT > 0 and decreasing (Green) : entry/exit long position, take profits or plan an entry
3. MTT < 0 and decreasing (Red) : Short position
4. MTT <0 and increasing (Maroon) : entry/exit short position, take profits or plan entry
This shows the market waves, it's a good indicator for swing trading since it shows the change of direction of the trend, signals profit areas and entry/exit regions. Change in the direction of the trend can be spotted by the cross over the zero line or by trend divergences, H-H in the trend and L-H in the MTT indicator means a downtrend is close. L-L in the trend and H-L in the indicator means an uptrend is forming.
There is a bar in the zero line that shows the momentum direction, simple, green it's increasing, red, it's decreasing.
This indicator is meant to be a companion of the MTS indicator. When combined MTS shows the direction and strength of the trend, meanwhile MTT shows if the trend is weakening, gaining strength, confirms continuation or warns a reversal.
What I look from my indicators is to create a tool that filters out as much noise as possible without losing much sensitivity, they have to be easy to tune and simple to analyze, so I normally use contrasting colors, using cold colors for long positions and warm colors for short positions. I try to use the least possible number of parameters and the defaults have been set after several months of testing in Beta mode against hundreds of charts before publishing them.
I hope this effort can help you to have a simpler point of view of the market.
CANX SMC Levels, Traps & MS © CanxStixTrader
This indicator helps spot inducements and Smart Money Traps as well as basic support and resistance levels on your chosen time frame. Updated to include market structure to help identify valid zones and when to place your trades.
Using four of the most significant points in price action
1. Breakouts
2. False Breakouts (Traps)
3. Back Checks
4. Market Structure
I always go on about price action on my channels because this alone can help identify valid and invalid positions. If these three points are properly identified they can be some of the most significant points of movement in the price and bring significant gains to traders.
Breakouts
Breakouts can bring significant moves in price as the market swings after key levels are breached. This entry type can bring large moves and if momentum is on your side at those key levels.
False Breakouts
Also known as a bull trap or a bear trap, false breakouts can lead to swift and significant reversal of what looks like a key area break then becomes a large and sudden move to the opposite side. When a key level breakout fails to hold, parties entering to capitalize on the breakout can get left holding or forcing them to exit at a loss, which can double the force of pressure on the move to the opposite side.
Back Checks
Back checks are pull backs in trend that find middle ground to the two areas already described. Both momentum and entry price are decent, but risk is defined as a key level has flipped offering entry with stops below demand, or above supply.
Market Structure
Helps to identify the market direction and potential trend reversals so you have more clarity when placing your trade
-----------------------------------
Combining these four methods will helps to diversify risk, understand trend development. This script helps to identify these points to traders with analysis of key levels, price structure, and trend direction.
Enjoy,
© CanxStixTrader
Keep it simple
Sessions [Prolific Zone ]### 🔥 **4AM–5AM GMT Breakout Strategy (5-Min Entry Confirmation)**
#### ⏱ **Time Zone**
* **All times are GMT+0 (UTC)**
---
### 📌 **Step-by-Step Guide**
1. **Timeframe Setup**
* Use the **1-hour chart** to identify the 4:00 AM – 5:00 AM candle.
* Mark the **high and low** of that specific candle (the range).
2. **Draw Levels**
* At **5:00 AM**, after the candle closes:
* Draw a **horizontal line or zone** at the **high** and another at the **low** of the 4:00–5:00 AM candle.
3. **Switch Timeframe**
* Switch to the **5-minute chart**.
4. **Breakout Confirmation**
* Wait for a **5-minute candle to break**:
* **Buy Entry**: If a 5-minute candle **closes above the high**, enter a **BUY**.
* **Sell Entry**: If a 5-minute candle **closes below the low**, enter a **SELL**.
5. **Trade Management (Recommended)**
* **Stop Loss (SL)**: Just below/above the opposite side of the range.
* **Take Profit (TP)**: Use a risk-to-reward ratio (1:1.5 or 1:2), or follow market structure.
* Optional: Trail the stop loss once in profit.
---
### ✅ **Strategy Highlights**
* Works best with **GOLD (XAUUSD)** due to its volatile movement during London Open.
* Also effective with pairs like **GBPUSD, EURUSD**, etc., but test before use.
* Avoid using it on days with high-impact news during this time.
Pro Trading Art - Swing Trading Master V2The Pro Trading Art - Swing Trading Master V2 (STM V2) is an exclusive, invite-only TradingView indicator crafted for swing traders aiming to capture medium-term price movements across stocks, forex, crypto, and commodities. This sophisticated tool integrates trend analysis, momentum evaluation, and pattern recognition to deliver precise trade signals, customizable risk management, and real-time performance tracking. Optimized for trending and ranging markets, STM V2 empowers traders with a robust, user-friendly system.
HOW IT WORKS
STM V2 uses a multi-faceted approach to identify high-probability swing trading opportunities.
Key concepts include:
Trend and Momentum Analysis: Derives a dynamic trend price from price data and volatility, smoothed with an EMA for clarity. Momentum is assessed via a modified Commodity Channel Index (CCI), enhanced with an EMA to confirm trend strength and spot reversals. Candlestick colors reflect short-term price momentum.
Market Zone Identification: Displays color-coded backgrounds (green for bullish, red for bearish, yellow for neutral) based on CCI crossovers and pivot-based averages. A secondary timeframe using Heikin Ashi candles reinforces signal accuracy.
Signal Generation: Triggers buy/sell signals when price aligns with the trend price and CCI conditions (e.g., CCI > -100 for buys, < -100 for sells). Signals are filtered by a user-defined EMA and plotted as labeled shapes (“BUY” or “SELL”).
Pattern Recognition: Detects double top and bottom patterns via pivot calculations, marked with lines and labels to highlight potential reversals.
Performance Tracking: Provides real-time trade metrics (last trade, returns, time elapsed) in a customizable dashboard, with returns calculated from entry/exit prices.
KEY FEATURES
Precision Swing Signals: Clear, labeled buy/sell signals validated by price and momentum.
Dynamic Market Zones: Color-coded backgrounds with secondary timeframe confirmation.
Pattern Detection: Identifies double top/bottom patterns for reversal confirmation.
Trade Summary Dashboard: Real-time metrics, including trade type, date, percentage return, and elapsed time.
Customizable Inputs: Adjust alert type, signal length, pivot lookback, and background display.
Alert System: Configurable alerts for signals and patterns, triggered once per bar close.
HOW TO USE
Setup:
Add STM V2 to your TradingView chart and configure inputs:
Alert Type: “Long,” “Short,” or “Both.”
Signal Length: EMA period (default: 14).
Pivot Length: Lookback for patterns (default: 10).
Show BG: Enable/disable background colors.
Start Time: Set reference time for markers.
Trading: Monitor “BUY” (green) or “SELL” (red) signals, background colors, and double top/bottom patterns. Use the dashboard to track trades.
Alerts: Enable notifications for signals or patterns via TradingView’s alert menu.
Risk Management: Set manual stop-loss/take-profit levels using signals as entry points.
WHY IT’S VALUABLE
STM V2 stands out by combining a proprietary trend price, momentum-adjusted CCI, secondary timeframe analysis, and pattern detection, surpassing standard indicators like moving averages or RSI. Its trade summary dashboard offers unmatched transparency, and customizable inputs ensure adaptability across markets. This originality and practicality make it a premium tool for disciplined swing traders.
LIMITATIONS
Market Dependency: Performance may vary in volatile or illiquid markets.
Invite-Only: Access is restricted to invited users.
Educational Use: Use alongside proper risk management.
Parsifal.RSI.TrendContext
The Relative Strength Index (RSI) is one of the most widely used classical indicators in technical analysis, typically employed to identify overbought or oversold market conditions. It reflects the degree of upside or downside dominance within a specified period. However, in its standard form, RSI is not particularly effective as a standalone entry trigger.
The Parsifal.RSI.Trend indicator builds upon the RSI to offer a more reliable method for distinguishing between bullish and bearish market regimes. It is a very simple, but surprisingly efficient concept.
________________________________________
Concept
In trending markets, an Exponential Moving Average (EMA) of the price is often smoother and more stable than raw price data. As a result, the RSI calculated on this smoothed price (i.e., the EMA) tends to react earlier and more consistently than the standard RSI. Specifically:
• In uptrends, the RSI of the EMA tends to exceed the RSI of the original price.
• In downtrends, it tends to lag behind.
The difference between these two RSI readings provides a stable and less noisy measure of market bias—positive in uptrends, negative in downtrends.
________________________________________
Indicator Mechanics
The RSI.Trend indicator works as follows:
• Baseline:
o 14-period RSI of the original price (RSI)
o 14-period EMA of that RSI (RSI.EMA)
• Trigger Line:
o 5-period EMA of the price series
o 14-period RSI on that smoothed price (RSI5M)
o 14-period EMA of RSI5M (RSI5M.EMA)
• The difference between the trigger line and the baseline reflects the current trend regime:
o A crossover of the trigger line above the baseline indicates a shift to a bullish regime.
o A crossunder signals a transition to a bearish regime.
________________________________________
RSI.Trend Background Value
The RSI.Trend Flow Background enhances this difference by incorporating recent changes in the trend state. This produces a slightly accelerated signal and visually shades the background:
• > 0 (Green background): Bullish regime
• < 0 (Red background): Bearish regime
________________________________________
How to Use RSI.Trend
• Use crossovers and crossunders between the trigger line and the baseline as entry signals or confirmation of regime shifts.
• The background value can serve as:
o A secondary confirmation signal
o A position sizing multiplier for continuous trading, adjusting exposure based on the trend strength rather than relying on discrete entry points.
________________________________________
Final Notes
As with all indicators, the RSI.Trend is most effective when used in conjunction with other technical tools and market context. It does not predict future price movements; rather, it reflects current market dynamics and recent directional tendencies. Use it with discretion and as part of a broader trading strategy.
My script
### 🔥 **4AM–5AM GMT Breakout Strategy (5-Min Entry Confirmation)**
#### ⏱ **Time Zone**
* **All times are GMT+0 (UTC)**
---
### 📌 **Step-by-Step Guide**
1. **Timeframe Setup**
* Use the **1-hour chart** to identify the 4:00 AM – 5:00 AM candle.
* Mark the **high and low** of that specific candle (the range).
2. **Draw Levels**
* At **5:00 AM**, after the candle closes:
* Draw a **horizontal line or zone** at the **high** and another at the **low** of the 4:00–5:00 AM candle.
3. **Switch Timeframe**
* Switch to the **5-minute chart**.
4. **Breakout Confirmation**
* Wait for a **5-minute candle to break**:
* **Buy Entry**: If a 5-minute candle **closes above the high**, enter a **BUY**.
* **Sell Entry**: If a 5-minute candle **closes below the low**, enter a **SELL**.
5. **Trade Management (Recommended)**
* **Stop Loss (SL)**: Just below/above the opposite side of the range.
* **Take Profit (TP)**: Use a risk-to-reward ratio (1:1.5 or 1:2), or follow market structure.
* Optional: Trail the stop loss once in profit.
---
### ✅ **Strategy Highlights**
* Works best with **GOLD (XAUUSD)** due to its volatile movement during London Open.
* Also effective with pairs like **GBPUSD, EURUSD**, etc., but test before use.
* Avoid using it on days with high-impact news during this time.
---
Full Day Midpoint Line with Dynamic StdDev Bands (ETH & RTH)A Pine Script indicator designed to plot a midpoint line based on the high and low prices of a user-defined trading session (typically Extended Trading Hours, ETH) and to add dynamic standard deviation (StdDev) bands around this midpoint.
Session Midpoint Line:
The midpoint is calculated as the average of the session's highest high and lowest low during the defined ETH period (e.g., 4:00 AM to 8:00 PM).
This line represents a central tendency or "fair value" for the session, similar to a pivot point or volume-weighted average price (VWAP) anchor.
Interpretation:
Prices above the midpoint suggest bullish sentiment, while prices below indicate bearish sentiment.
The midpoint can act as a dynamic support/resistance level, where price may revert to or react at this level during the session.
Dynamic StdDev Bands:
The bands are calculated by adding/subtracting a multiple of the standard deviation of the midpoint values (tracked in an array) from the midpoint.
The standard deviation is dynamically computed based on the historical midpoint values within the session, making the bands adaptive to volatility.
Interpretation:
The upper and lower bands represent potential overbought (upper) and oversold (lower) zones.
Prices approaching or crossing the bands may indicate stretched conditions, potentially signaling reversals or breakouts.
Trend Identification:
Use the midpoint as a reference for the session’s trend. Persistent price action above the midpoint suggests bullishness, while below indicates bearishness.
Combine with other indicators (e.g., moving averages, RSI) to confirm trend direction.
Support/Resistance Trading:
Treat the midpoint as a dynamic pivot point. Price rejections or consolidations near the midpoint can be entry points for mean-reversion trades.
The StdDev bands can act as secondary support/resistance levels. For example, price reaching the upper band may signal a potential short entry if accompanied by reversal signals.
Breakout/Breakdown Strategies:
A strong move beyond the upper or lower band may indicate a breakout (bullish above upper, bearish below lower). Confirm with volume or momentum indicators to avoid false breakouts.
The dynamic nature of the bands makes them useful for identifying significant price extensions.
Volatility Assessment:
Wider bands indicate higher volatility, suggesting larger price swings and potentially riskier trades.
Narrow bands suggest consolidation, which may precede a breakout. Traders can prepare for volatility expansions in such scenarios.
The "Full Day Midpoint Line with Dynamic StdDev Bands" is a versatile and visually intuitive indicator well-suited for day traders focusing on session-specific price action. Its dynamic midpoint and volatility-adjusted bands provide valuable insights into support, resistance, and potential reversals or breakouts.
[blackcat] L2 Angle Trend TrackerOVERVIEW
The " L2 Angle Trend Tracker" is a sophisticated technical analysis tool designed to monitor trend direction and momentum using multiple Exponential Moving Averages (EMAs) with different periods. 📈 This script calculates the angles of 5 EMAs (5, 8, 10, 12, and 15 periods) and displays them with gradient colors, providing a comprehensive view of market momentum. When all EMAs cross above or below specified threshold levels, it generates Buy or Sell signals with visual alerts. The indicator helps traders identify trend reversals, potential entry/exit points, and market sentiment shifts with precision. 🚀 This powerful tool is particularly useful for traders who want to combine multiple timeframe analysis with angle-based momentum confirmation.
FEATURES
Calculates angles for 5 EMAs with customizable periods (5, 8, 10, 12, and 15)
Displays angle values with distinct colors for each EMA (Green, Blue, Purple, Orange, and Red)
Generates Buy signals when all EMAs cross above the lower threshold
Generates Sell signals when all EMAs cross below the upper threshold
Shows a zero line and threshold lines for easy reference
Customizable threshold levels for Buy/Sell signals
Visual alerts with "Buy" and "Sell" labels at the point of signal generation
The script uses a mathematical formula to calculate the angle of each EMA relative to its position 11 bars ago
Angle values are converted from radians to degrees for easier interpretation
The zero line represents no change in the EMA angle
The indicator is not overlayed on the price chart by default, but can be adjusted in the script settings 📊
HOW TO USE
Adjust the EMA periods to match your trading strategy 🛠️
Shorter periods (5, 8) are more sensitive to price changes
Longer periods (10, 12, 15) provide smoother trend confirmation
Set appropriate threshold values for Buy/Sell signals based on your risk tolerance
Default thresholds are 70 for upper threshold and -70 for lower threshold
Consider adjusting thresholds based on market volatility
Watch for Buy signals when all EMAs cross above the lower threshold (default: -70)
The signal appears as a green "Buy" label on the chart
This indicates a potential trend reversal to the upside
Watch for Sell signals when all EMAs cross below the upper threshold (default: 70)
The signal appears as a red "Sell" label on the chart
This indicates a potential trend reversal to the downside
Combine with other indicators for confirmation before making trading decisions 🧠
Consider using volume confirmation, support/resistance levels, or other oscillators
The angle tracker works well with trend-following strategies
Use the angle values to gauge momentum strength
Steeper angles indicate stronger momentum
Flatter angles suggest weakening momentum or consolidation
CONFIGURATION
EMA Periods: The script uses five different EMA periods that can be customized:
EMA Period 5: Short-term trend indicator
EMA Period 8: Medium-short term trend indicator
EMA Period 10: Medium-term trend indicator
EMA Period 12: Medium-long term trend indicator
EMA Period 15: Long-term trend indicator
Threshold Settings:
Threshold Top: Sets the upper boundary for Sell signals (default: 70)
Threshold Bot: Sets the lower boundary for Buy signals (default: -70)
These thresholds can be adjusted based on market conditions and trading style
LIMITATIONS
The script may generate false signals in ranging markets or during periods of high volatility
All EMAs must cross the threshold for a signal to appear, which may filter some valid signals
The angle calculation uses a 11-bar lookback period, which may not be suitable for all timeframes
Works best in trending markets and may produce whipsaws in choppy conditions ⚠️
The indicator is more effective on higher timeframes (4H, 1D) than on very short timeframes (1M, 5M)
Signal generation requires confirmation from multiple EMAs, which may delay entry/exit points
The angle calculation method may not be suitable for all financial instruments
ADVANCED TIPS
Use multiple instances of this indicator with different EMA settings for multi-timeframe analysis
Combine with volume analysis to confirm the strength of signals
Look for confluence with support and resistance levels for more reliable signals
Consider using the angle values as a filter for other trading strategies
The indicator can be used to identify momentum exhaustion points when angles flatten
For swing trading, consider using the Buy and Sell signals as potential entry/exit points
For day trading, you may want to use shorter EMA periods and adjust threshold values accordingly
NOTES
The script uses a mathematical formula to calculate the angle of each EMA relative to its position 11 bars ago
The angle values are converted from radians to degrees for easier interpretation
The zero line represents no change in the EMA angle
The indicator is not overlayed on the price chart by default, but can be adjusted in the script settings 📊
The angle calculation provides a dynamic view of momentum that traditional moving averages don't offer
The threshold values are based on empirical testing and can be fine-tuned for specific instruments
THANKS
Special thanks to the TradingView community for their support and feedback on this indicator. If you find this script helpful, please consider leaving a comment or sharing your experiences with it. Your feedback helps improve the tool for everyone. 🙏
Also, a nod to the original concept developers who pioneered angle-based trend analysis. This script builds upon those foundational ideas to provide a more comprehensive view of market momentum. 🌟
[blackcat] L2 Multi-Level Price Condition TrackerOVERVIEW
The L2 Multi-Level Price Condition Tracker represents an innovative approach to analyzing financial markets by simultaneously monitoring multiple price levels, thus providing traders with a holistic view of market dynamics. By combining dynamic calculations based on moving averages and price deviations, this tool aims to deliver precise and actionable insights into potential entry and exit points. It leverages sophisticated statistical measures to identify key thresholds that signify shifts in market sentiment, thereby aiding traders in making well-informed decisions. 🎯
Key benefits encompass:
• Comprehensive calculation of midpoints and average prices indicating short-term trend directions.
• Interactive visualization elements enhancing interpretability effortlessly.
• Real-time generation of buy/sell signals driven by precise condition evaluations.
TECHNICAL ANALYSIS COMPONENTS
📉 Midpoint Calculations:
Computes central reference points derived from high-low ranges establishing baseline supports/resistances.
Utilizes Simple Moving Averages (SMAs) along with standardized deviation formulas smoothing out volatility while preserving long-term trends accurately.
Facilitates identification of directional biases reflecting underlying market forces dynamically.
🕵️♂️ Advanced Price Level Detection:
Derives upper/lower bounds adjusting sensitivities adaptively responding to changing conditions flexibly.
Employs proprietary logic distinguishing between bullish/bearish sentiments promptly signaling transitions effectively.
Ensures consistent adherence to predefined statistical protocols maintaining accuracy robustly.
🎥 Dynamic Signal Generation:
Detects crossovers indicating dominance shifts between buyers/sellers promptly triggering timely alerts.
Integrates conditional logic reinforcing signal validity minimizing erroneous activations systematically.
Supports adaptive thresholds tuning sensitivities based on evolving market conditions flexibly accommodating varying scenarios.
INDICATOR FUNCTIONALITY
🔢 Core Algorithms:
Utilizes moving averages alongside standardized deviation formulas generating precise net volume measurements.
Implements Arithmetic Mean Line Algorithm (AMLA) smoothing techniques improving interpretability.
Ensures consistent alignment with established statistical principles preserving fidelity.
🖱️ User Interface Elements:
Dedicated plots displaying real-time midpoint markers facilitating swift decision-making.
Context-sensitive color coding distinguishing positive/negative deviations intuitively highlighting key activations clearly.
Background shading emphasizing proximity to crucial threshold activations enhancing visibility focusing attention on vital signals promptly.
STRATEGY IMPLEMENTATION
✅ Entry Conditions:
Confirm bullish/bearish setups validated through multiple confirmatory signals assessing concurrent market sentiment factors.
Validate entry decisions considering alignment between calculated midpoints and broader trend directions ensuring coherence.
Monitor cumulative breaches signifying potential trend reversals executing partial/total closes contingent upon predetermined loss limits preserving capital efficiently.
🚫 Exit Mechanisms:
Trigger exits upon hitting predefined thresholds derived from historical analyses promptly executing closures.
Execute partial/total closes contingent upon cumulative loss limits preserving capital efficiently managing exposures prudently.
Conduct periodic reviews gauging strategy effectiveness rigorously identifying areas needing refinement implementing corrective actions iteratively enhancing performance metrics steadily.
PARAMETER CONFIGURATIONS
🎯 Optimization Guidelines:
Lookback Period: Governs responsiveness versus stability balancing sensitivity/stability governing moving averages aligning with preferred granularity.
Price Source: Dictates primary data series driving volume calculations selecting relevant inputs accurately tailoring strategies accordingly.
💬 Customization Recommendations:
Commence with baseline defaults; iteratively refine parameters isolating individual impacts evaluating adjustments independently prior to combined modifications minimizing disruptions.
Prioritize minimizing erroneous trigger occurrences first optimizing signal fidelity sustaining balanced risk-reward profiles irrespective of chosen settings upholding disciplined approaches preserving capital efficiently.
ADVANCED RISK MANAGEMENT
🛡️ Proactive Risk Mitigation Techniques:
Enforce strict compliance with pre-defined maximum leverage constraints adhering strictly to guidelines managing exposures prudently.
Mandatorily apply trailing stop-loss orders conforming to script outputs enforcing discipline rigorously preventing adverse consequences.
Allocate positions proportionately relative to available capital reserves conducting periodic reviews gauging effectiveness continuously identifying improvement opportunities steadily.
⚠️ Potential Pitfalls & Solutions:
Address frequent violations arising during heightened volatility phases necessitating manual interventions judiciously preparing contingency plans proactively mitigating risks effectively.
Manage false alerts warranting immediate attention avoiding adverse consequences systematically implementing corrective actions reliably.
Prepare proactive responses amid adverse movements ensuring seamless functionality amidst fluctuating conditions fortifying resilience against anomalies robustly.
PERFORMANCE MONITORING METRICS
🔍 Evaluation Criteria:
Assess win percentages consistently across diverse trading instruments gauging reliability measuring profitability efficiency accurately evaluating downside risks comprehensively uncovering systematic biases potentially skewing outcomes.
Calculate average profit ratios per successful execution benchmarking actual vs expected performances documenting results meticulously tracking progress dynamically addressing identified shortcomings proactively fostering continuous improvements.
📈 Historical Data Analysis Tools:
Maintain detailed logs capturing every triggered event recording realized profits/losses comparing simulated projections accurately identifying discrepancies warranting investigation implementing iterative refinements steadily enhancing performance metrics progressively.
Identify recurrent systematic errors demanding corrective actions implementing iterative refinements steadily addressing identified shortcomings proactively fostering continuous enhancements dynamically improving robustness resiliently.
PROBLEM SOLVING ADVICE
🔧 Frequent Encountered Challenges:
Unpredictable behaviors emerging within thinly traded markets requiring filtration processes enhancing signal integrity excluding low-liquidity assets prone to erratic movements effectively.
Latency issues manifesting during abrupt price fluctuations causing missed opportunities introducing buffer intervals safeguarding major news/event impacts mitigating distortions seamlessly verifying reliable connections ensuring uninterrupted data flows guaranteeing accurate interpretations dependably.
💡 Effective Resolution Pathways:
Limit ongoing optimization attempts preventing model degradation maintaining optimal performance levels consistently recalibrating parameters periodically adapting strategies flexibly responding appropriately amidst varying conditions dynamically improving robustness resiliently.
Verify reliable connections ensuring uninterrupted data flows guaranteeing accurate interpretations dependably bolstering overall efficacy systematically addressing identified shortcomings dynamically fostering continuous advancements.
THANKS
Heartfelt acknowledgment extends to all developers contributing invaluable insights regarding multi-level price condition-based trading methodologies! ✨
[blackcat] L1 Net Volume DifferenceOVERVIEW
The L1 Net Volume Difference indicator serves as an advanced analytical tool designed to provide traders with deep insights into market sentiment by examining the differential between buying and selling volumes over precise timeframes. By leveraging these volume dynamics, it helps identify trends and potential reversal points more accurately, thereby supporting well-informed decision-making processes. The key focus lies in dissecting intraday changes that reflect short-term market behavior, offering critical input for both swing and day traders alike. 📊
Key benefits encompass:
• Precise calculation of net volume differences grounded in real-time data.
• Interactive visualization elements enhancing interpretability effortlessly.
• Real-time generation of buy/sell signals driven by dynamic volume shifts.
TECHNICAL ANALYSIS COMPONENTS
📉 Volume Accumulation Mechanisms:
Monitors cumulative buy/sell volumes derived from comparative closing prices.
Periodically resets accumulation counters aligning with predefined intervals (e.g., 5-minute bars).
Facilitates identification of directional biases reflecting underlying market forces accurately.
🕵️♂️ Sentiment Detection Algorithms:
Employs proprietary logic distinguishing between bullish/bearish sentiments dynamically.
Ensures consistent adherence to predefined statistical protocols maintaining accuracy.
Supports adaptive thresholds adjusting sensitivities based on changing market conditions flexibly.
🎯 Dynamic Signal Generation:
Detects transitions indicating dominance shifts between buyers/sellers promptly.
Triggers timely alerts enabling swift reactions to evolving market dynamics effectively.
Integrates conditional logic reinforcing signal validity minimizing erroneous activations.
INDICATOR FUNCTIONALITY
🔢 Core Algorithms:
Utilizes moving averages along with standardized deviation formulas generating precise net volume measurements.
Implements Arithmetic Mean Line Algorithm (AMLA) smoothing techniques improving interpretability.
Ensures consistent alignment with established statistical principles preserving fidelity.
🖱️ User Interface Elements:
Dedicated plots displaying real-time net volume markers facilitating swift decision-making.
Context-sensitive color coding distinguishing positive/negative deviations intuitively.
Background shading highlighting proximity to key threshold activations enhancing visibility.
STRATEGY IMPLEMENTATION
✅ Entry Conditions:
Confirm bullish/bearish setups validated through multiple confirmatory signals.
Validate entry decisions considering concurrent market sentiment factors.
Assess alignment between net volume readings and broader trend directions ensuring coherence.
🚫 Exit Mechanisms:
Trigger exits upon hitting predetermined thresholds derived from historical analyses.
Monitor continuous breaches signifying potential trend reversals promptly executing closures.
Execute partial/total closes contingent upon cumulative loss limits preserving capital efficiently.
PARAMETER CONFIGURATIONS
🎯 Optimization Guidelines:
Reset Interval: Governs responsiveness versus stability balancing sensitivity/stability.
Price Source: Dictates primary data series driving volume calculations selecting relevant inputs accurately.
💬 Customization Recommendations:
Commence with baseline defaults; iteratively refine parameters isolating individual impacts.
Evaluate adjustments independently prior to combined modifications minimizing disruptions.
Prioritize minimizing erroneous trigger occurrences first optimizing signal fidelity.
Sustain balanced risk-reward profiles irrespective of chosen settings upholding disciplined approaches.
ADVANCED RISK MANAGEMENT
🛡️ Proactive Risk Mitigation Techniques:
Enforce strict compliance with pre-defined maximum leverage constraints adhering strictly to guidelines.
Mandatorily apply trailing stop-loss orders conforming to script outputs reinforcing discipline.
Allocate positions proportionately relative to available capital reserves managing exposures prudently.
Conduct periodic reviews gauging strategy effectiveness rigorously identifying areas needing refinement.
⚠️ Potential Pitfalls & Solutions:
Address frequent violations arising during heightened volatility phases necessitating manual interventions judiciously.
Manage false alerts warranting immediate attention avoiding adverse consequences systematically.
Prepare contingency plans mitigating margin call possibilities preparing proactive responses effectively.
Continuously assess automated system reliability amidst fluctuating conditions ensuring seamless functionality.
PERFORMANCE AUDITS & REFINEMENTS
🔍 Critical Evaluation Metrics:
Assess win percentages consistently across diverse trading instruments gauging reliability.
Calculate average profit ratios per successful execution measuring profitability efficiency accurately.
Measure peak drawdown durations alongside associated magnitudes evaluating downside risks comprehensively.
Analyze signal generation frequencies revealing hidden patterns potentially skewing outcomes uncovering systematic biases.
📈 Historical Data Analysis Tools:
Maintain comprehensive records capturing every triggered event meticulously documenting results.
Compare realized profits/losses against backtested simulations benchmarking actual vs expected performances accurately.
Identify recurrent systematic errors demanding corrective actions implementing iterative refinements steadily.
Document evolving performance metrics tracking progress dynamically addressing identified shortcomings proactively.
PROBLEM SOLVING ADVICE
🔧 Frequent Encountered Challenges:
Unpredictable behaviors emerging within thinly traded markets requiring filtration processes.
Latency issues manifesting during abrupt price fluctuations causing missed opportunities.
Overfitted models yielding suboptimal results post-extensive tuning demanding recalibrations.
Inaccuracies stemming from incomplete/inaccurate data feeds necessitating verification procedures.
💡 Effective Resolution Pathways:
Exclude low-liquidity assets prone to erratic movements enhancing signal integrity.
Introduce buffer intervals safeguarding major news/event impacts mitigating distortions effectively.
Limit ongoing optimization attempts preventing model degradation maintaining optimal performance levels consistently.
Verify reliable connections ensuring uninterrupted data flows guaranteeing accurate interpretations reliably.
USER ENGAGEMENT SEGMENT
🤝 Community Contributions Welcome
Highly encourage active participation sharing experiences & recommendations!
THANKS
Heartfelt acknowledgment extends to all developers contributing invaluable insights about volume-based trading methodologies! ✨
Precise EMA Cross Strategy (20, 50, 200)Precise EMA Cross Strategy (20, 50, 200)
🧠 Core Concept:
This strategy is designed to capture major trend reversals using Exponential Moving Averages (EMAs) and avoid false signals by requiring:
A confirmed EMA crossover (Golden/Death Cross).
Confirmation from the trend direction (slope) of the 200 EMA.
The price to be aligned with the direction of the signal (above or below EMAs).
📊 Components:
EMA 20 (Green): Short-term price momentum.
EMA 50 (Red): Medium-term trend reference.
EMA 200 (Yellow): Long-term trend foundation.
✅ Trade Entry Rules:
🔼 Buy Signal (Golden Cross):
Occurs when:
EMA 50 crosses above EMA 200.
The slope of EMA 200 is upward, confirming long-term uptrend.
Price is above both EMA 50 and EMA 200, showing bullish market strength.
🔔 You'll see a green "BUY" marker below the candle.
This is a high-probability long entry setup.
🔽 Sell Signal (Death Cross):
Occurs when:
EMA 50 crosses below EMA 200.
The slope of EMA 200 is downward, confirming a bearish trend.
Price is below both EMA 50 and EMA 200, confirming weakness.
🔔 You'll see a red "SELL" marker above the candle.
This is a high-probability short entry setup.
📅 Best Timeframes to Use:
Swing trading: 1H, 4H, Daily
Position trading: Daily, Weekly
Not suitable for scalping on low timeframes (e.g. 1min or 5min) due to EMA smoothing delay
🧪 Backtesting Tips:
Look for confirmation on higher timeframes (e.g., 4H or 1D).
Combine this strategy with:
RSI divergence
Volume spikes
Support/resistance zones
⚠️ Avoid False Signals:
Do not trade if the slope of EMA 200 is flat or conflicting with the crossover.
Avoid trading in sideways markets or low-volatility environments.
🔔 Alerts:
The script includes built-in alert conditions:
Golden Cross Alert
Death Cross Alert
Set them in TradingView’s alert panel to get notified when a valid trade setup forms.
💡 Example Trade Flow:
BUY Example:
1H chart: EMA 50 crosses above EMA 200 ✅
Slope of EMA 200 is rising ✅
Price is above both EMAs ✅
➡️ Enter a long position
🎯 Set take profit at previous resistance or use trailing stop
🛑 Stop loss just below recent swing low or EMA 200
SELL Example:
4H chart: EMA 50 crosses below EMA 200 ✅
Slope of EMA 200 is falling ✅
Price is below both EMAs ✅
➡️ Enter a short position
🎯 Set TP at support or use trailing
🛑 SL above recent swing high or EMA 200
🧩 Combine With:
Candlestick patterns (e.g., engulfing, pin bar)
Breakout levels
Fibonacci retracement zones
USDTUSD Stochastic RSI [SAKANE]Release Note
■ Overview
The USDTUSD Stochastic RSI indicator visualizes shifts in market sentiment and liquidity by applying the Stochastic RSI to the USDT/USD price pair.
Rather than tracking the price of Bitcoin directly, this tool observes the momentum of USDT, a key intermediary in most crypto transactions, to detect early signals of trend reversals.
■ Background & Motivation
USDT exhibits two distinct characteristics:
Its credibility as a long-term store of value is limited.
Yet, it serves as one of the most liquid assets in the crypto space and is widely used as a trading base pair.
Because most BTC trades involve converting fiat into USDT and vice versa, USDT/USD frequently deviates slightly from its peg to USD.
These deviations—though subtle—often occur just before major shifts in the broader crypto market.
This indicator is designed to detect such moments of structural imbalance by applying momentum analysis to USDT itself.
■ Feature Highlights
Calculates RSI and Stochastic RSI on the USDT/USD closing price
Supports customizable smoothing via SMA or EMA
Background shading dynamically visualizes overheated or cooled market states (thresholds are adjustable)
Displayed in a separate pane, keeping it visually distinct from the price chart
■ Usage Insights
This indicator is based on an observable pattern:
When the Stochastic RSI bottoms out, Bitcoin tends to form a price bottom shortly afterward
Conversely, when the indicator peaks, Bitcoin tends to top out with a slight delay
Since USDT acts as a gateway for capital in and out of the market, changes in its momentum often foreshadow turning points in BTC.
This allows traders to anticipate shifts in sentiment rather than merely reacting to them.
■ Unique Value Proposition
Unlike conventional price-based indicators, this tool offers a structural perspective.
It focuses on USDT as a mechanism of liquidity flow, making it possible to detect the "hidden rhythm" of the crypto market.
In that sense, this is not just a technical tool, but an entry point into market microstructure analysis—allowing users to read the market’s intentions rather than just its movements.
■ Practical Tips
Look for reversals in momentum as potential BTC entry or exit points.
Overlay this indicator with the BTC chart to compare timing and divergence.
Combine with other tools such as on-chain data or macro indicators for comprehensive analysis.
■ Final Thoughts
USDTUSD Stochastic RSI is designed with the belief that the most important market signals often come from what drives the price, not the price itself.
By tuning into the “heartbeat” of capital flow, this indicator sheds light on market dynamics that would otherwise remain unseen.
We hope it proves useful in your trading and research.
[blackcat] L2 Z-Score of PriceOVERVIEW
The L2 Z-Score of Price indicator offers traders an insightful perspective into how current prices diverge from their historical norms through advanced statistical measures. By leveraging Z-scores, it provides a robust framework for identifying potential reversals in financial markets. The Z-score quantifies the number of standard deviations that a data point lies away from the mean, thus serving as a critical metric for recognizing overbought or oversold conditions. 🎯
Key benefits encompass:
• Precise calculation of Z-scores reflecting true price deviations.
• Interactive plotting features enhancing visual clarity.
• Real-time generation of buy/sell signals based on crossover events.
STATISTICAL ANALYSIS COMPONENTS
📉 Mean Calculation:
Utilizes Simple Moving Averages (SMAs) to establish baseline price references.
Provides smooth representations filtering short-term noise preserving long-term trends.
Fundamental for deriving subsequent deviation metrics accurately.
📈 Standard Deviation Measurement:
Quantifies dispersion around established means revealing underlying variability.
Crucial for assessing potential volatility levels dynamically adapting strategies accordingly.
Facilitates precise Z-score derivations ensuring statistical rigor.
🕵️♂️ Z-SCORE DETECTION:
Measures standardized distances indicating relative positions within distributions.
Helps pinpoint extreme conditions signaling impending reversals proactively.
Enables early identification of trend exhaustion phases prompting timely actions.
INDICATOR FUNCTIONALITY
🔢 Core Algorithms:
Integrates SMAs along with standardized deviation formulas generating precise Z-scores.
Employs Arithmetic Mean Line Algorithm (AMLA) smoothing techniques improving interpretability.
Ensures consistent adherence to predefined statistical protocols maintaining accuracy.
🖱️ User Interface Elements:
Dedicated plots displaying real-time Z-score markers facilitating swift decision-making.
Context-sensitive color coding distinguishing positive/negative deviations intuitively.
Background shading highlighting proximity to key threshold activations enhancing visibility.
STRATEGY IMPLEMENTATION
✅ Entry Conditions:
Confirm bullish/bearish setups validated through multiple confirmatory signals.
Validate entry decisions considering concurrent market sentiment factors.
Assess alignment between Z-score readings and broader trend directions ensuring coherence.
🚫 Exit Mechanisms:
Trigger exits upon hitting predetermined thresholds derived from historical analyses.
Monitor continuous breaches signifying potential trend reversals promptly executing closures.
Execute partial/total closes contingent upon cumulative loss limits preserving capital efficiently.
PARAMETER CONFIGURATIONS
🎯 Optimization Guidelines:
Length: Governs responsiveness versus smoothing trade-offs balancing sensitivity/stability.
Price Source: Dictates primary data series driving Z-score computations selecting relevant inputs accurately.
💬 Customization Recommendations:
Commence with baseline defaults; iteratively refine parameters isolating individual impacts.
Evaluate adjustments independently prior to combined modifications minimizing disruptions.
Prioritize minimizing erroneous trigger occurrences first optimizing signal fidelity.
Sustain balanced risk-reward profiles irrespective of chosen settings upholding disciplined approaches.
ADVANCED RISK MANAGEMENT
🛡️ Proactive Risk Mitigation Techniques:
Enforce strict compliance with pre-defined maximum leverage constraints adhering strictly to guidelines.
Mandatorily apply trailing stop-loss orders conforming to script outputs reinforcing discipline.
Allocate positions proportionately relative to available capital reserves managing exposures prudently.
Conduct periodic reviews gauging strategy effectiveness rigorously identifying areas needing refinement.
⚠️ Potential Pitfalls & Solutions:
Address frequent violations arising during heightened volatility phases necessitating manual interventions judiciously.
Manage false alerts warranting immediate attention avoiding adverse consequences systematically.
Prepare contingency plans mitigating margin call possibilities preparing proactive responses effectively.
Continuously assess automated system reliability amidst fluctuating conditions ensuring seamless functionality.
PERFORMANCE AUDITS & REFINEMENTS
🔍 Critical Evaluation Metrics:
Assess win percentages consistently across diverse trading instruments gauging reliability.
Calculate average profit ratios per successful execution measuring profitability efficiency accurately.
Measure peak drawdown durations alongside associated magnitudes evaluating downside risks comprehensively.
Analyze signal generation frequencies revealing hidden patterns potentially skewing outcomes uncovering systematic biases.
📈 Historical Data Analysis Tools:
Maintain comprehensive records capturing every triggered event meticulously documenting results.
Compare realized profits/losses against backtested simulations benchmarking actual vs expected performances accurately.
Identify recurrent systematic errors demanding corrective actions implementing iterative refinements steadily.
Document evolving performance metrics tracking progress dynamically addressing identified shortcomings proactively.
PROBLEM SOLVING ADVICE
🔧 Frequent Encountered Challenges:
Unpredictable behaviors emerging within thinly traded markets requiring filtration processes.
Latency issues manifesting during abrupt price fluctuations causing missed opportunities.
Overfitted models yielding suboptimal results post-extensive tuning demanding recalibrations.
Inaccuracies stemming from incomplete/inaccurate data feeds necessitating verification procedures.
💡 Effective Resolution Pathways:
Exclude low-liquidity assets prone to erratic movements enhancing signal integrity.
Introduce buffer intervals safeguarding major news/event impacts mitigating distortions effectively.
Limit ongoing optimization attempts preventing model degradation maintaining optimal performance levels consistently.
Verify reliable connections ensuring uninterrupted data flows guaranteeing accurate interpretations reliably.
USER ENGAGEMENT SEGMENT
🤝 Community Contributions Welcome
Highly encourage active participation sharing experiences & recommendations!
[blackcat] L3 Mean Reversion ATR Stop Loss OVERVIEW
The L3 Mean Reversion ATR Stop Loss indicator is meticulously crafted to empower traders by offering statistically-driven stop-loss levels that adapt seamlessly to evolving market dynamics. By harmoniously blending mean reversion concepts with Advanced True Range (ATR) metrics, it delivers a robust framework for managing risks more effectively. 🌐 The primary objective is to furnish traders with intelligent exit points grounded in both short-term volatility assessments and long-term trend evaluations.
Key highlights encompass:
• Dynamic calculation of Z-scores to evaluate deviations from established means
• Adaptive stop-loss pricing leveraging real-time ATR measurements
• Clear visual cues enabling swift decision-making processes
TECHNICAL ANALYSIS COMPONENTS
📉 Z-SCORE CALCULATION
Measures how many standard deviations an asset's current price lies away from its average
Facilitates identification of extreme conditions indicative of impending reversals
Utilizes simple moving averages and standard deviation computations
📊 STANDARD DEVIATION MEASUREMENT
Quantifies dispersion of closing prices around the mean
Provides insights into underlying price distribution characteristics
Crucial for assessing potential volatility levels accurately
🕵️♂️ ADAPTIVE STOP-LOSS DETECTION
Employs ATR as a proxy for prevailing market volatility
Modulates stop-loss placements dynamically responding to shifting trends
Ensures consistent adherence to predetermined risk management protocols
INDICATOR FUNCTIONALITY
🔢 Core Algorithms
Integrate Smooth Moving Averages (SMAs) alongside standardized deviation formulas
Generate precise Z-scores reflecting true price deviations
Leverage ATR-derived multipliers for fine-grained stop-loss adjustments
🖱️ User Interface Elements
Interactive plots displaying real-time stop-loss markers
Context-sensitive color coding enhancing readability
Background shading indicating proximity to stop-level activations
STRATEGY IMPLEMENTATION
✅ Entry Conditions
Confirm bullish/bearish setups validated through multiple confirmatory signals
Ensure alignment between Z-score readings and broader trend directions
Validate entry decisions considering concurrent market sentiment factors
🚫 Exit Mechanisms
Trigger exits upon hitting predefined ATR-based stop-loss thresholds
Monitor continuous breaches signifying potential trend reversals
Execute partial/total closes contingent upon cumulative loss limits
PARAMETER CONFIGURATIONS
🎯 Optimization Guidelines
Period Length: Governs responsiveness versus smoothing trade-offs
ATR Length: Dictates the temporal scope for volatility analysis
Stop Loss ATR Multiplier: Tunes sensitivity towards stop-trigger activations
💬 Customization Recommendations
Commence with baseline defaults; iteratively refine parameters
Evaluate impacts independently prior to combined adjustments
Prioritize minimizing erroneous trigger occurrences first
Sustain balanced risk-reward profiles irrespective of chosen settings
ADVANCED RISK MANAGEMENT
🛡️ Proactive Risk Mitigation Techniques
Enforce strict compliance with pre-defined maximum leverage constraints
Mandatorily apply trailing stop-loss orders conforming to script outputs
Allocate positions proportionately relative to available capital reserves
Conduct periodic reviews gauging strategy effectiveness rigorously
⚠️ Potential Pitfalls & Solutions
Address frequent violations arising during heightened volatility phases
Manage false alerts warranting manual interventions judiciously
Prepare contingency plans mitigating margin call possibilities
Continuously assess automated system reliability amidst fluctuating conditions
PERFORMANCE AUDITS & REFINEMENTS
🔍 Critical Evaluation Metrics
Assess win percentages consistently across diverse trading instruments
Calculate average profit ratios per successful execution
Measure peak drawdown durations alongside associated magnitudes
Analyze signal generation frequencies revealing hidden patterns
📈 Historical Data Analysis Tools
Maintain comprehensive records capturing every triggered event
Compare realized profits/losses against backtested simulations
Identify recurrent systematic errors demanding corrective actions
Implement iterative refinements bolstering overall efficacy steadily
PROBLEM SOLVING ADVICE
🔧 Frequent Encountered Challenges
Unpredictable behaviors emerging within thinly traded markets
Latency issues manifesting during abrupt price fluctuations
Overfitted models yielding suboptimal results post-extensive tuning
Inaccuracies stemming from incomplete or delayed data inputs
💡 Effective Resolution Pathways
Exclude low-liquidity assets prone to erratic movements
Introduce buffer intervals safeguarding major news/event impacts
Limit ongoing optimization attempts preventing model degradation
Verify seamless connectivity ensuring uninterrupted data flows
USER ENGAGEMENT SEGMENT
🤝 Community Contributions Welcome
Highly encourage active participation sharing experiences & recommendations!
THANKS
A heartfelt acknowledgment extends to all developers contributing invaluable insights about adaptive stop-loss strategies using statistical measures! ✨
Minervini Trend Template (EMA)📄 Description:
This script is inspired by Mark Minervini’s SEPA (Specific Entry Point Analysis) strategy and adapts his famous Trend Template using Exponential Moving Averages (EMAs). It helps traders visually identify technically strong stocks that are in ideal buy conditions based on Minervini's rules.
📈 Strategy Logic:
This script scans for momentum breakouts by filtering stocks with the following characteristics:
✅ Buy Criteria (All Conditions Must Be Met):
Price above 50-day EMA
Price above 150-day EMA
Price above 200-day EMA
50-day EMA above 150-day EMA
150-day EMA above 200-day EMA
200-day EMA trending upward (greater than it was 20 days ago)
Price within 25% of its 52-week high
Price at least 30% above its 52-week low
If all 8 conditions are satisfied, the script triggers a SEPA Setup Signal. This is visually indicated by:
✅ A green background on the chart
✅ A label saying “SEPA Setup” under the bar
🛒 When to Buy:
Wait for the stock to break out above a recent base or consolidation pattern (like a cup-with-handle or flat base) on strong volume.
The ideal entry is within 5% of the breakout point.
Confirm that the SEPA conditions are met on the breakout day.
📉 When to Sell:
Place a stop-loss 5–8% below your entry price.
Exit if the breakout fails and price falls back below the pivot or the 50-day EMA.
Take partial profits after a 20–25% gain, and move your stop-loss up to breakeven or trail it using moving averages like the 21 or 50 EMA.
Exit fully if price closes below the 50-day or 150-day EMA on volume.
🧠 Why EMAs?
EMAs react faster to recent price action than SMAs, helping you catch earlier signals in fast-moving markets. This makes it especially useful for growth and momentum traders following Minervini’s high-performance approach.
📊 How to Use:
Apply the script to any stock chart (daily timeframe recommended).
Look for a green background + SEPA Setup label.
Combine with price/volume analysis, base patterns, and market context to time your entries.
🚨 Optional Alerts:
You can set an alert on the condition minerviniPass == true to notify you when a SEPA-compliant setup appears.
📚 This tool is meant for educational and research purposes. Always validate with your own due diligence and consult your risk plan before making any trades.
CVD Divergenz System – modular with Exchange + LabelsA smart volume-based strategy tool using CVD divergence, ATR-based risk management, and Open Interest filters — now with visual chart labels and exchange switching.
Designed for crypto traders who want precise entry signals, volume insight, and a clean UI.
🔍 Key Features:
✅ CVD Divergence Detection
Automatically detects bullish or bearish divergences between price and cumulative delta (CVD)
✅ Open Interest Logic (Simulated)
Signals are only valid when OI is rising – otherwise a warning is issued
✅ ATR-Based Entry, Stop & Target Zones
Auto-calculated based on your chosen R multiple (e.g., 1.5R), plotted in the chart
✅ Visual Dashboard Panel (table)
Compact panel with CVD, OI change, ATR, signal status, and selected exchange — always visible in top-right
✅ Exchange Selector + Fallback to Binance
Choose between Binance, Bybit, Bitget, or Coinbase — if data is unavailable, Binance is used automatically
✅ Modular Chart Labels
Optionally display 📈 LONG, 📉 SHORT or ⚠️ WARNING labels directly on the chart with a toggle
✅ Alerts Built-In
Get notified instantly when a setup triggers (long, short, or warning) — works with app, popup, or webhook
✅ Fully Modular Controls
Enable or disable the dashboard, trade zones, and labels via simple checkboxes
⚠️ Technical Notes:
CVD is calculated from delta volume (volume * sign(close - open)) — not true order flow
Open Interest is simulated using volume as a placeholder (due to Pine Script limitations)
Best suited for 5–30min timeframes on crypto futures pairs like BTCUSDT, ETHUSDT, etc.
💡 Pro Tips:
Use near key support/resistance zones or liquidity levels
Combine with price action and higher timeframe confluence
Alerts work best with "Once Per Bar Close" trigger setting
📈 Built to support faster decisions, cleaner setups, and institutional-level insights — all in one tool.
Retail Pain Index (RPIx) (RPIx) Retail Pain Index (DAFE)
See the Market’s Pain. Trade the Edge.
The Retail Pain Index (RPIx) is a next-generation volatility and sentiment tool designed to reveal the hidden moments when retail traders are most likely being squeezed, stopped out, or forced to capitulate. This is not just another oscillator—it’s a behavioral market scanner that quantifies “pain” as price rips away from the average entry zone, often marking the fuel for the next big move.
Why is RPIx so Unique?
Behavioral Volatility Engine:
RPIx doesn’t just track price or volume. It measures how far price is moving away from where the crowd has recently entered (using a rolling VWAP average), then normalizes this “distance” into a Z-score. The result? You see when the market is inflicting maximum pain on the most participants.
Dynamic, Intuitive Coloring:
The main RPIx line is purple in normal conditions, but instantly turns red when pain is extreme to the upside (+2.00 or higher) and green when pain is extreme to the downside (-2.00 or lower). This makes it visually obvious when the market is entering a “max pain” regime.
Threshold Lines for Clarity:
Dashed red and green lines at +2.00 and -2.00 Z-score levels make it easy to spot rare, high-pain events at a glance.
Signature Dashboard & Info Line:
Dashboard: A compact, toggleable panel in the top right of the indicator pane shows the current Z-score, threshold, and status—perfect for desktop users who want a quick read on market stress.
Info Line: For mobile or minimalist traders, a single-line info label gives you the essentials without cluttering your screen.
Inputs & Customization
Entry Cluster Lookback: Adjusts how many bars are used to calculate the “entry zone” (VWAP average). A higher value smooths the signal, a lower value makes it more responsive.
Pain Z-Score Threshold:
Sets the sensitivity for what counts as “extreme pain.” Default is ±2.00, but you can fine-tune this to match your asset’s volatility or your own risk appetite.
Show Dashboard / Show Compact Info Label:
Toggle these features on or off to fit your workflow and screen size.
How to utilize RPIx's awesomeness:
Extreme Readings = Opportunity:
When RPIx spikes above +2.00 (red) or below -2.00 (green), the market is likely running stops, liquidating weak hands, or forcing retail traders to capitulate. These moments often precede sharp reversals, trend accelerations, or volatility expansions.
Combine with Price Action:
Use RPIx as a confirmation tool for your existing strategy, or as a standalone alert for “pain points” where the crowd is most vulnerable.
Visual Edge:
The color-coded line and threshold levels make it easy to spot regime shifts and rare events—no more squinting at numbers or guessing when the market is about to snap.
Why RPIx?
Works on Any Asset, Any Timeframe:
Stocks, futures, crypto, forex—if there’s a crowd, there’s pain, and RPIx will find it.
Behavioral Alpha:
Most indicators lag. RPIx quantifies the psychological stress in the market, giving you a real-time edge over the herd.
Customizable, Clean, and Powerful:
Designed for both power users and mobile traders, with toggles for every workflow.
See the pain. Trade the edge.
Retail Pain Index: Because the market’s next move is written in the crowd’s discomfort.
For educational purposes only. Not financial advice. Always use proper risk management
Use with discipline. Trade your edge.
— Dskyz , for DAFE Trading Systems, for DAFE Trading Systems
Stochastic XThe "Stochastic X" script is a customizable momentum oscillator designed to help traders identify potential overbought and oversold conditions, as well as trend reversals, by analyzing the relationship between a security's closing price and its price range over a specified period. This indicator is particularly useful for traders looking to fine-tune their entry and exit points based on momentum shifts.
🔧 Indicator Settings and Customization
The script offers several user-configurable settings to tailor the indicator to specific trading strategies:
In addition to the source type, %K Period, %D Period, and Signal line periods you can now change moving average calculation for the stochastic and signal lines.
This script allows selection among various moving average methods (e.g., SMA, EMA, WMA, T3) for smoothing the %K and signal lines. Different methods can affect the responsiveness of the indicator.
🎨 Interpreting Background Colors
The script enhances visual analysis by changing the background color of the indicator panel based on the %K line's value:
Green Background: Indicates that the %K line is above 50, suggesting bullish momentum.
Red Background: Signifies that the %K line is below 50, pointing to bearish momentum.
Light Green Overlay: Appears when the %K line exceeds 80, highlighting overbought conditions.
Light Red Overlay: Shows up when the %K line falls below 20, indicating oversold conditions.
These visual cues assist traders in quickly assessing market momentum and potential reversal.
📈 Trading Strategies Using Stochastic X
Traders can utilize the Stochastic X indicator in various ways:
Overbought/Oversold Conditions:
A %K value above 80 may suggest that the asset is overbought, potentially signaling a price correction.
A %K value below 20 could indicate that the asset is oversold, possibly leading to a price rebound.
Signal Line Crossovers:
When the %K line crosses above the signal line, it may be interpreted as a bullish signal.
Conversely, a %K line crossing below the signal line might be seen as a bearish signal.
Divergence Analysis:
If the price makes a new high while the %K line does not, this bearish divergence could precede a price decline.
If the price hits a new low but the %K line forms a higher low, this bullish divergence might signal an upcoming price increase.
Trend Confirmation:
Sustained %K values above 50 can confirm an uptrend.
Persistent %K values below 50 may validate a downtrend.
In this chart, observe how the background colors change in response to the %K line's value, providing immediate visual feedback on market conditions. The crossovers between the %K and signal lines offer potential entry and exit points, while the overbought and oversold overlays help identify possible reversal zones.
⚙️ Adjusting Settings for Optimal Use
The Stochastic X indicator's flexibility allows traders to adjust settings to match their trading style and the specific asset's behavior:
Short-Term Trading: Use shorter periods (e.g., 5 for %K) and more responsive moving averages (e.g., WMA, VWMA, EMA, DEMA, TEMA, HMA) to capture quick market movements.
Long-Term Trading: Opt for longer periods (e.g., 14 for %K) and smoother moving averages (e.g., SMA, RMA, T3) to filter out noise and focus on broader trends.
Volatile Markets: Consider using the T3 moving average for its smoothing capabilities, helping to reduce false signals in choppy markets.
By experimenting with different settings, traders can fine-tune the indicator to better suit their analysis and improve decision-making.
Enigma Sniper 369The "Enigma Sniper 369" is a custom-built Pine Script indicator designed for TradingView, tailored specifically for forex traders seeking high-probability entries during high-volatility market sessions.
Unlike generic trend-following or scalping tools, this indicator uniquely combines session-based "kill zones" (London and US sessions), momentum-based candle analysis, and an optional EMA trend filter to pinpoint liquidity grabs and reversal opportunities.
Its originality lies in its focus on liquidity hunting—identifying levels where stop losses are likely clustered (around swing highs/lows and wick midpoints)—and providing visual entry zones that are dynamically removed once price breaches them, reducing clutter and focusing on actionable signals.
The name "369" reflects the structured approach of three key components (session timing, candle logic, and trend filter) working in harmony to snipe precise entries.
What It Does
"Enigma Sniper 369" identifies potential buy and sell opportunities by drawing two types of horizontal lines on the chart during user-defined London and US
session kill zones:
Solid Lines: Mark the swing low (for buys) or swing high (for sells) of a trigger candle, indicating a potential entry point where stop losses might be clustered.
Dotted Lines: Mark the 50% level of the candle’s wick (lower wick for buys, upper wick for sells), serving as a secondary confirmation zone for entries or tighter stop-loss placement.
These lines are plotted only when specific candle conditions are met within the kill zones, and they are automatically deleted once the price crosses them, signaling that the liquidity at that level has likely been grabbed. The indicator also includes an optional EMA filter to ensure trades align with the broader trend, reducing false signals in choppy markets.
How It Works
The indicator’s logic is built on a multi-layered approach:
Kill Zone Timing: Trades are only considered during user-defined London and US session hours (e.g., London from 02:00 to 12:00 UTC, as seen in the screenshots). These sessions are known for high volatility and liquidity, making them ideal for capturing institutional moves.
Candle-Based Momentum Logic:
Buy Signal: A candle must close above its midpoint (indicating bullish momentum) and have a lower low than the previous candle (suggesting a potential liquidity grab below the previous swing low). This is expressed as close > (high + low) / 2 and low < low .
Sell Signal: A candle must close below its midpoint (bearish momentum) and have a higher high than the previous candle (indicating a potential liquidity grab above the previous swing high), expressed as close < (high + low) / 2 and high > high .
These conditions ensure the indicator targets candles that break recent structure to hunt stop losses while showing directional momentum.
Optional EMA Filter: A 50-period EMA (customizable) can be enabled to filter signals based on trend direction.
Buy signals are only generated if the EMA is trending upward (ema_value > ema_value ), and sell signals require a downward EMA trend (ema_value < ema_value ). This reduces noise by aligning entries with the broader market trend.
Liquidity Levels and Deletion Logic:
For a buy signal, a solid green line is drawn at the candle’s low, and a dotted green line at the 50% level of the lower wick (from the candle body’s bottom to the low).
For a sell signal, a solid red line is drawn at the candle’s high, and a dotted red line at the 50% level of the upper wick (from the body’s top to the high).
These lines extend to the right until the price crosses them, at which point they are deleted, indicating the liquidity at that level has been taken (e.g., stop losses triggered).
Alerts: The indicator includes alert conditions for buy and sell signals, notifying traders when a new setup is identified.
Underlying Concepts
The indicator is grounded in the concept of liquidity hunting, a strategy often employed by institutional traders. Markets frequently move to levels where stop losses are clustered—typically just beyond swing highs or lows—before reversing in the opposite direction. The "Enigma Sniper 369" targets these moves by identifying candles that break structure (e.g., a lower low or higher high) during high-volatility sessions, suggesting a potential sweep of stop losses. The 50% wick level acts as a secondary confirmation, as this midpoint often represents a zone where tighter stop losses are placed by retail traders. The optional EMA filter adds a trend-following element, ensuring entries are taken in the direction of the broader market momentum, which is particularly useful on lower timeframes like the 15-minute chart shown in the screenshots.
How to Use It
Here’s a step-by-step guide based on the provided usage example on the GBP/USD 15-minute chart:
Setup the Indicator: Add "Enigma Sniper 369" to your TradingView chart. Adjust the London and US session hours to match your timezone (e.g., London from 02:00 to 12:00 UTC, US from 13:00 to 22:00 UTC). Customize the EMA period (default 50) and line styles/colors if desired.
Identify Kill Zones: The indicator highlights the London session in light green and the US session in light purple, as seen in the screenshots. Focus on these periods for signals, as they are the most volatile and likely to produce liquidity grabs.
Wait for a Signal: Look for solid and dotted lines to appear during the kill zones:
Buy Setup: A solid green line at the swing low and a dotted green line at the 50% lower wick level indicate a potential buy. This suggests the market may have grabbed liquidity below the swing low and is now poised to move higher.
Sell Setup: A solid red line at the swing high and a dotted red line at the 50% upper wick level indicate a potential sell, suggesting liquidity was taken above the swing high.
Place Your Trade:
For a buy, set a buy limit order at the dotted green line (50% wick level), as this is a more conservative entry point. Place your stop loss just below the solid green line (swing low) to cover the full swing. For example, in the screenshots, the market retraces to the dotted line at 1.32980 after a liquidity grab below the swing low, triggering a buy limit order.
For a sell, set a sell limit order at the dotted red line, with a stop loss just above the solid red line.
Monitor Price Action: Once the price crosses a line, it is deleted, indicating the liquidity at that level has been taken. In the screenshots, after the buy limit is triggered, the market moves higher, confirming the setup. The caption notes, “The market returns and tags us in long with a buy limit,” highlighting this retracement strategy.
Additional Context: Use the indicator to identify liquidity levels that may be targeted later. For example, the screenshot notes, “If a new session is about to open I will wait for the grab liquidity to go long,” showing how the indicator can be used to anticipate future moves at session opens (e.g., London open at 1.32980).
Risk Management: Always set a stop loss below the swing low (for buys) or above the swing high (for sells) to protect against adverse moves. The 50% wick level helps tighten entries, improving the risk-reward ratio.
Practical Example
On the GBP/USD 15-minute chart, during the London session (02:00 UTC), the indicator identifies a buy setup with a solid green line at 1.32901 (swing low) and a dotted green line at 1.32980 (50% wick level). The market initially dips below the swing low, grabbing liquidity, then retraces to the dotted line, triggering a buy limit order. The price subsequently rises to 1.33404, yielding a profitable trade. The user notes, “The logic is in the last candle it provides new level to go long,” emphasizing the indicator’s ability to identify fresh levels after a liquidity sweep.
Customization Tips
Adjust the EMA period to suit your timeframe (e.g., a shorter period like 20 for faster signals on lower timeframes).
Modify the session hours to align with your broker’s timezone or specific market conditions.
Use the alert feature to get notified of new setups without constantly monitoring the chart.
Why It’s Useful for Traders
The "Enigma Sniper 369" stands out by combining session timing, momentum-based candle analysis, and liquidity hunting into a single tool. It provides clear, actionable levels for entries and stop losses, removes invalid signals dynamically, and aligns trades with high-probability market conditions. Whether you’re a scalper looking for quick moves during London open or a swing trader targeting session-based reversals, this indicator offers a structured, data-driven approach to trading.