ICT Sweep + FVG Entry (v6) • Pro Pack 📌 ICT Sweep + FVG Entry Pro Pack
This indicator combines key ICT price action concepts with practical execution tools to help traders spot high-probability setups faster and more objectively. It’s designed for scalpers and intraday traders who want to keep their chart clean but never miss critical market structure events.
🔑 Features
Liquidity Pools (HTF)
• Auto-detects recent swing highs/lows from higher timeframes (5m/15m).
• Draws both lines and optional rectangles/zones for clear liquidity areas.
Liquidity Sweeps (BSL/SSL)
• Identifies when price sweeps above/below liquidity pools and rejects back.
• Optional Grade-A sweep filter (wick size + strong re-entry).
Fair Value Gaps (FVGs)
• Highlights bullish/bearish imbalances.
• Optional midline (50%) entry for precision.
• Auto-invalidation when price fully closes inside the gap.
Killzones (New York)
• Highlights AM (9:30–11:30) and PM (14:00–15:30) killzones.
• Option to block signals outside killzones for higher strike rate.
Bias Badge (DR50)
• Displays if price is trading in a Bull, Bear, or Range context based on displacement range midpoint.
SMT Assist (NQ vs ES)
• Detects simple divergences between indices:
Bearish SMT → NQ makes HH while ES doesn’t.
Bullish SMT → NQ makes LL while ES doesn’t.
SL/TP Helper & R:R Label
• Automatically draws stop loss (at sweep extreme) and target (opposite pool or recent swing).
• Displays expected Risk:Reward ratio and blocks entries if below your chosen minimum.
Filters
• ATR filter ensures signals only appear in sufficient volatility.
• Sweep quality filter avoids weak wicks and fake-outs.
🎯 How to Use
Start on HTF (5m/15m) → Identify liquidity zones and bias.
Drop to LTF (1m) → Wait for a liquidity sweep confirmation.
Check for FVG in the sweep’s direction → Look for retest entry.
Use the SL/TP helper to validate your risk/reward before taking the trade.
Focus entries during NY Killzones for maximum effectiveness.
✅ Why this helps
This tool reduces screen time and hesitation by automating repetitive ICT concepts:
Liquidity pools, sweeps, and FVGs are marked automatically.
Killzone timing and SMT divergence are simplified.
Clear visual signals for entries with built-in RR filter help keep your trading mechanical.
⚠️ Disclaimer: This script is for educational purposes only. It does not provide financial advice or guarantee results. Always use proper risk management.
Cari dalam skrip untuk "fvg"

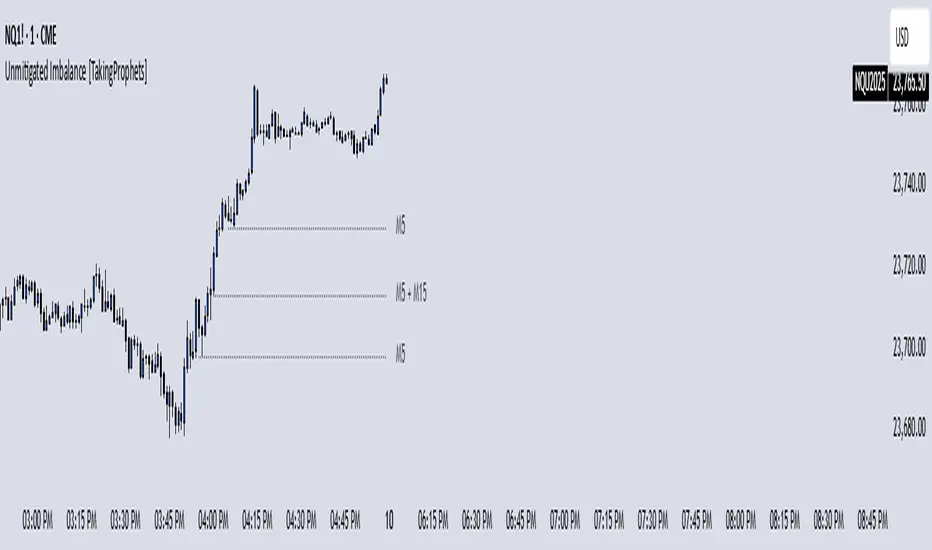
Unmitigated Imbalances [TakingProphets] (High Timeframe)Unmitigated Imbalances
Unmitigated Imbalance is designed to automatically detect and display active Fair Value Gaps (FVGs) across multiple higher timeframes and your current chart. It only keeps the ones that remain unmitigated, helping you clearly see where price has “unfinished business” and potential liquidity draw areas. The tool extends these levels forward until they are tagged according to your chosen mitigation criteria, then removes them automatically.
The indicator uses the classic 3-bar FVG structure:
– Bearish FVG forms when the low of the third candle back is above the high of the first candle.
– Bullish FVG forms when the high of the third candle back is below the low of the first candle.
– Each detected gap must meet a minimum size threshold, which is determined automatically from the Sensitivity setting and adjusted for the symbol type.
Higher timeframes (up to 4) can be plotted simultaneously with your current chart’s gaps. The script merges overlapping levels from different timeframes into one clean label, showing all the contributing timeframes together (for example: M15 + H1 + H4). This makes it easy to spot high-confluence levels without cluttering your chart.
Key features
– Multi-timeframe detection: up to 4 custom HTFs plus your current chart.
– Automatic gap size filtering based on chosen Sensitivity (High, Medium, Low).
– Choice of Wick or Close-based mitigation logic.
– Lookback control: 1 Day, 1 Week, 1 Month, or Max.
– Combined labels for overlapping gaps with clear timeframe tags.
– Separate color and style settings for each timeframe’s bullish and bearish gaps.
– Labels can be positioned Left, Right, or Center Above for maximum clarity.
– Automatic line extension until mitigation or until they exceed the lookback period.
How to use
Select your desired higher timeframes in the HTF1–HTF4 settings.
Choose the Sensitivity level to control the minimum gap size detected.
Decide on Wick or Close mitigation according to your trading rules.
Use the Lookback setting to limit how far back the script checks for gaps.
Watch for levels where multiple timeframe labels are stacked — these can carry greater significance.
Incorporate the levels into your existing strategy, using them as context rather than entry signals.
Practical notes
– Current timeframe gaps reset each trading day to keep the chart relevant to intraday bias.
– Higher timeframe gaps remain until mitigated or until the lookback period expires.
– Large lookback periods with multiple HTFs can increase chart load — adjust settings as needed.
– This indicator is a mapping and context tool, not a signal generator. Always apply it alongside your own analysis.
HyperFlowIntroduction
HyperFlow is a premium market structure and liquidity rotation model built around the principles of internal inefficiencies, tested imbalances, and delivery shifts. Drawing inspiration from ICT concepts, it provides a high-level framework for identifying smart money footprints and timing entries with precision.
Rather than forecasting direction, HyperFlow focuses on recognizing repeatable delivery behaviors — helping traders visually track liquidity shifts from internal ranges to external objectives with consistency.
Core Philosophy
Markets are governed by the logic of liquidity engineering — the search and destruction of internal inefficiencies (Fair Value Gaps), followed by continuations toward external liquidity.
Timeframes to use:
HTF -> LTF
5m -> 15s
15m -> 1m
1h -> 5m
4h -> 15m
Daily -> 1h
Weekly -> 4h
Monthly -> 1D
HyperFlow identifies these transitions by:
Detecting High Timeframe Fair Value Gaps (HTF FVGs) — structural imbalances created by displacement
Tracking Valid Tests of those FVGs — signaling willingness to respect internal structure
Filtering for Delivery Confirmations — only acting when price delivers with intent through reclaimed imbalances
Mapping Risk and Objective Zones — using recent swing structures to define stop and target logic rooted in market logic
All components are reactive, visual, and non-repainting — designed to highlight structure after it forms, not anticipate it prematurely.
Key Features
Internal Range Liquidity Zones: Cleanly marked HTF imbalances show where price may seek efficiency
Tested FVG Filtering: Signals only form on valid rebalances — we wait for proof, not potential
Shift in Delivery Conditions: Price must show intent to reclaim imbalance before any rotation is considered
Automatic Objective Mapping: Recent structural highs/lows are used to project stop and target zones automatically
Session Filters + Time Alignment: Restrict signals to high-probability hours or defined killzones
Minimal, High-Impact Visuals: Tested/untested FVGs are differentiated by transparency and tone, keeping your chart clean and focused
HyperFlow is built for:
Traders who understand price delivery theory
Analysts studying displacement → reversion → continuation
Those seeking higher timeframe bias alignment through tested structure
Users of ICT-based concepts who want a visual, rules-based companion
This is not a beginner's tool. It’s for those seeking repeatable execution through structure and refinement, not guesswork.
Terms and Conditions
Our charting tools are products provided for informational and educational purposes only and do not constitute financial, investment, or trading advice. Our charting tools are not designed to predict market movements or provide specific recommendations. Users should be aware that past performance is not indicative of future results and should not be relied upon for making financial decisions. By using our charting tools, the purchaser agrees that the seller and the creator are not responsible for any decisions made based on the information provided by these charting tools. The purchaser assumes full responsibility and liability for any actions taken and the consequences thereof, including any loss of money or investments that may occur as a result of using these products. Hence, by purchasing these charting tools, the customer accepts and acknowledges that the seller and the creator are not liable nor responsible for any unwanted outcome that arises from the development, the sale, or the use of these products. Finally, the purchaser indemnifies the seller from any and all liability. If the purchaser was invited through the Friends and Family Program, they acknowledge that the provided discount code only applies to the first initial purchase of any SMCapital product. The purchaser is therefore responsible for cancelling – or requesting to cancel – their subscription in the event that they do not wish to continue using the product at full retail price. If the purchaser no longer wishes to use the products, they must unsubscribe from the membership service, if applicable. We hold no reimbursement, refund, or chargeback policy. Once these Terms and Conditions are accepted by the Customer, before purchase, no reimbursements, refunds or chargebacks will be provided under any circumstances.
By continuing to use these charting tools, the user acknowledges and agrees to the Terms and Conditions outlined in this legal disclaimer.

ICT HTF Candles [Pro] (fadi)The ICT HTF Candles shows you multi-timeframe price action by plotting up to six higher timeframe candles on your chart, scaled to real price levels. Set candle counts per timeframe or toggle them off for a clean view, saving you time switching between charts. This helps you spot trends and reversals quickly, align trades with the market’s direction, and time setups like sweeps or bounces better. From scalping on the 1m to swinging on the 4H, it simplifies ICT and Smart Money Concepts (SMC), revealing trend shifts and institutional moves clearly. Once you use it, trading without this clarity just won’t feel right.
Key Features:
In-Depth Price Action Levels
These levels track ICT PD arrays and confluences across timeframes, making it easy to see how price action flows from higher timeframes and what your setup faces. Is your 5m trade about to run into a 1H bearish order block? Did it bounce off a higher timeframe FVG and create an SMT with a correlated asset? They make your chart a clear roadmap to market structure, helping you find strong setups, save time, and align with institutional moves:
Change in State of Delivery (CISD): In ICT trading, CISD marks potential reversal levels on each timeframe by showing the open of the highest series of up (green) candles for a bullish shift or the open of the lowest series of down (red) candles for a bearish shift. These levels are set at the opening price of the first candle in those runs, highlighting where the market turns. The indicator makes these levels easy to spot across timeframes, so you can track reversal points clearly. You can set your own confirmation criteria—a close or wick above/below the CISD line (bearish/bullish) or a close or wick above/below the high/low—to verify the CISD level cross. When confirmed, there is a high probability that we have a change in trend, and a reversal order block forms. CISD helps you track these reversal levels and confirm market shifts, making multi-timeframe analysis straightforward.
Order Blocks: When a CISD level cross is confirmed, the price is now below a series of up (green) candles or above a series of down (red) candles, marking these candles as order blocks that usually support the new trend direction. The indicator shows these levels clearly across timeframes, making it easy to spot high-probability reversal or consolidation areas. Keep in mind that price may sometimes move to mitigate an imbalance, so use your best judgment based on your multi-timeframe analysis to confirm they meet your trading criteria.
Trend Bias: Traders often struggle figuring out market bias—guessing the trend wrong, losing on trades against the flow, or missing how lower and higher timeframes line up. The Trend Bias feature tracks order blocks and change in state of delivery, displaying bullish or bearish trends for each timeframe to help you choose trades that go with the market’s direction. The indicator shows these trends clearly across timeframes, so you can quickly see if the 5m matches the 1H or if you’re going against the bigger trend. This makes it easier to avoid bad trades and make decisions faster, keeping you on track with setups that follow the main trend.
Immediate Rebalance: When looking at price action, you’ll see the market doesn’t usually leave behind many Fair Value Gaps (FVGs). That’s because the market is efficient and always rebalancing any inefficiencies. When the market starts a strong move, the last candle will usually close above the previous candle high (for up moves) or below the low (for down moves). At this point, the market will do one of two things: immediately rebalance by retracing first, or have a small retracement but leave behind an FVG. The Immediate Rebalance feature tracks rebalance levels across multiple timeframes, clearly showing where price rebalances. This helps traders have a better expectation of how the market may need to retrace and anticipate Power of Three (PO3) setups by being ready for a Judas swing to rebalance the imbalance.
Fair Value Gaps and Volume Imbalances: If the market fails to immediately rebalance, it will usually attempt to come back and rebalance it at a later time. FVGs and VIs give you a clear area where the price might be heading if it starts breaking structure on lower timeframes. These inefficiencies—price gaps (FVGs) or aggressive moves (VIs)—show where the market’s working to fix imbalances. The Fair Value Gaps and Volume Imbalances feature tracks these levels across timeframes.
Previous Candle Levels: The Previous Candle Levels feature marks the high, low, and middle of the prior candle on each timeframe, helping you identify key price levels for sweeps, bounces, or breakouts. It tracks the candle’s high and low as its extremes and the middle as the 50% mark, which you can set to calculate using the high-to-low range or the open-to-close range. These levels can provide tradable setups on lower timeframes.
Smart Money Techniques (SMT): What’s an ICT indicator without an SMT feature to track cracks in correlated assets? The ICT HTF Candles monitors your chosen correlated assets, like EUR/USD and GBP/USD or SQ and NQ, for signs of strength or weakness to use as confluence with other features and build the case for A+ setups. The SMT feature spots divergences when one asset makes a higher high or lower low while the other doesn’t follow, hinting at potential reversals or market shifts. It tests SMT using two immediate candles, since higher timeframes (HTFs) create larger gaps on lower timeframes. Traders can easily see these divergence levels, like a 15m SMT lining up with a 1H order block or CISD, helping you confirm high-probability setups and strengthen trade entries with multi-timeframe confluence.

Smarter Money Concepts - MTF IFVGs [PhenLabs]📊 Smarter Money Concepts - MTF IFVG
Version: PineScript™ v6
📌 Description
This multi-timeframe indicator identifies Inverse Fair Value Gaps (IFVGs) and their inversions across simultaneous chart intervals, helping traders spot liquidity voids and potential reversal zones. By analyzing price action through the lens of institutional order flow patterns, it solves the problem of manual gap tracking across timeframes while incorporating volatility-adjusted parameters and psychological level analysis for higher-probability setups.
🚀 Points of Innovation
• Multi-Timeframe Engine - Simultaneous analysis of 3 higher timeframes
• Adaptive Parameters - Auto-adjusts to market volatility conditions
• Quality Scoring System - Ranks gaps using RVI strength and size metrics
• Inversion Tracking - Monitors failed gaps for counter-trend signals
• Render Optimization - Prevents chart clutter with smart gap management
🔧 Core Components
FVG Detection Logic: Identifies gaps using customizable price source (Close/Wick)
Inversion Tracker: Manages failed gaps and generates counter signals
Multi-Timeframe Engine: Processes 3 independent higher timeframe analyses
Dashboard System: Real-time display of active gaps across all timeframes
🔥 Key Features
• Volatility-adjusted gap size filters (ATR-based)
• Customizable timeframe confluence analysis
• Color-coded quality scoring
• Non-repainting inversion signals
• Mobile-optimized visual rendering
🎨 Visualization
• Colored Boxes: Translucent zones show active gaps (green/bullish, red/bearish)
• Midline Plot: Dashed gray line marks gap midpoint for price targets
• Inversion Markers: Intense colors show failed gaps (dark red/bullish failure, bright green/bearish failure)
• HTF Differentiation: Higher timeframe gaps shown in blue/teal hues
📖 Usage Guidelines
Multi-Timeframe Settings
• Higher Timeframe 1
Default: 30 | Range: Any > Chart TF | Controls primary confluence timeframe
• Show All Timeframes
Default: True | Toggles multi-TF gap displays
Gap Settings
• Source
Default: Close | Options: | Determines gap measurement method
• RVI Period
Default: 14 | Range: 1-50 | Sets momentum confirmation sensitivity
• RVI Value
Default 0.1 | 0 to see all IFVGs | Increase min RVI to see the most powerful IFVGs
✅ Best Use Cases
• Identifying confluence across timeframes
• Spotting institutional order blocks
• High-probability reversal trading
• Trend continuation confirmation
• Volatility breakout setups
⚠️ Limitations
• Repaints historical gap zones
• Requires understanding of FVG concepts
• Higher timeframe data latency
• Quality scores rely on RVI/ATR settings
💡 What Makes This Unique
First FVG indicator with true multi-timeframe processing
Adaptive parameters that auto-adjust to volatility
Quantifiable quality scoring system
Professional-grade dashboard with HTF tracking
🔬 How It Works
Gap Detection: Identifies FVGs using price relationships and RVI confirmation
Inversion Tracking: Monitors price breaches to flag failed gaps
Quality Assessment: Scores gaps based on size, momentum, and location
Adaptive Filtering: Adjusts parameters using ATR-based volatility analysis
Multi-TF Synthesis: Correlates gaps across user-selected timeframes
Visual Rendering: Displays only relevant, active gaps to prevent clutter
💡 Note:
Start with default settings and gradually adjust parameters after observing market interactions. Focus on gaps with quality scores above 7 that align with higher timeframe trends. Combine with price action at psychological levels for highest-probability setups. Remember that higher timeframe gaps generally carry more significance than current chart gaps.

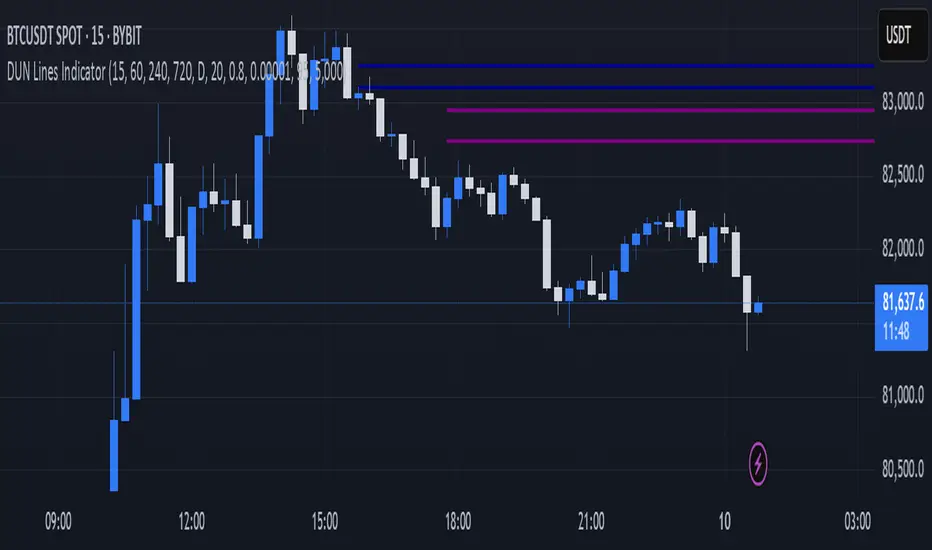
DUN Lines IndicatorThe DUN Lines indicator detects, filters and plots price imbalances (aka fair value gaps or fvgs/ifvgs). It is unique in the fact that it uses five timeframes and filters out overlapping, lower timeframe imbalances and fvgs below a user-definable size threshold.
Simply set your detection timeframes, colors and thresholds then set your chart to your preferred entry timeframe. When imbalances are mitigated, the FVG/IFVG is removed from the chart.
The indicator's default colors are my preferred ones for differentiating between timeframes, but these are easily changed. A single color with various levels of transparency to indicate timeframe strength is another approach that works nicely.
Nirmal Fair Value GapsICT Fair Value Gaps
Trade Wisely
How a Fair Value Gap Works
Formation:
A Fair Value Gap occurs when a strong price movement (usually from institutional orders) creates an imbalance between buyers and sellers.
This is typically seen in a three-candle pattern, where the middle candle has a large body, and the two surrounding candles have wicks but little overlap with the middle candle’s range.
Identification:
The FVG is marked between the high of the first candle and the low of the third candle (for bullish gaps).
For bearish gaps, it’s the low of the first candle and the high of the third candle.
Market Behavior Around FVG:
Price often retraces into the gap before resuming its original direction.
This happens because the market seeks to "fill" the imbalance where few trades occurred.
Traders use FVGs as potential entry zones for trend continuation trades.
Trading Fair Value Gaps
In an Uptrend:
Look for bullish fair value gaps as potential support zones for buy entries.
Price may dip into the gap and then continue upward.
In a Downtrend:
Look for bearish fair value gaps as potential resistance zones for sell entries.
Price may retrace into the gap and then drop further.
Confluence Factors:
FVGs work best when combined with other strategies like order blocks, liquidity zones, or key Fibonacci levels.

LIT_Globas_sys - Liquidity Inducement Theorem (SMC, IDM)LIT_GLOBAL_SYS Trading Tool Documentation, is a comprehensive market analysis tool that includes all components needed for trading according to Liquidity Inducement Theorem (LIT). LIT differs from classical trading methods and is considered a highly effective and profitable strategy.
What can LIT_GLOBAL_SYS do?
--- Market Structure
The main feature of Liquidity Inducement Theorem is building the correct structure, specifically construction taking into account inducement (IDM). Thus, a new HH or LL can only form when the price has taken the first correct pullback - inducement (IDM), and after this, we understand the location of BoS (break of structure) and CHoCH (change of character).
LIT_GLOBAL_SYS automatically and perfectly displays the correct structure following all LIT rules. Looking at the indicator, a trader always understands which range the price is currently in and where it's trending at the moment. The indicator also shows dynamic (live) levels, providing a clear understanding of the market structure in real-time.
The indicator settings allow customization of each structural element according to trader preferences. For example, you can change the style, color, and shape of structural objects.
--- Correct Pullbacks and Inside Bars
In Liquidity Inducement Theorem, correct pullbacks are fundamental. The structure, order blocks, liquidity levels, order flow, and single candle order blocks (CSOB) are all built based on pullbacks.
What is a pullback?
- When the next candle updates the low of the previous candle, we can finish drawing an upward pullback
- We can start drawing a downward correct pullback when the next candle updates the low of the previous candle
- The downward movement will continue until the opposite occurs - updating the high of the previous candle
There are complexities in determining pullbacks - these are inside bars. In Liquidity Inducement Theorem, inside bars are completely ignored!
For example, in an upward movement, at some point, candles may stop updating the high and low of the previous candle and remain within the boundaries of the previous candle. Theoretically, there could be any number of such candles from 1 to infinity. In such cases, it's important to wait for the price to exit the mother candle (the candle after which other candles remained within its high and low range).
LIT_GLOBAL_SYS easily handles this and displays both pullbacks and inside bars correctly.
--- Order Blocks and Fair Value Gaps (FVG)
In Liquidity Inducement Theorem, order blocks are defined differently from classical order blocks:
1. The order block must take liquidity from the previous candle
2. The order block must have Fair Value Gaps (FVG) before it
3. Inside bars are completely ignored for both Order Blocks and FVG
4. If an OB fulfills the first condition (taking liquidity from the previous candle) but doesn't have FVG before it, this block is moved forward along the candles until there is an imbalance before it
There are two most important order blocks in LIT strategy:
1. Inducement order block (idm ob) - the first order block after Inducement
2. Extreme order block (Ext ob) - the first order block before CHoCH
LIT_GLOBAL_SYS perfectly displays correct order blocks and Fair Value Gaps following all rules. It offers full customization options:
- Specify the number of displayed OBs
- Disable all order blocks except idm ob and Ext ob
- Change block frame color and style
- Disable or modify text display in blocks
--- Single Candle Order Block (Scob)
Rules for building Scob:
1. The candle takes liquidity from the previous candle and closes within the body of the previous candle
2. The candle following the Scob candle must close its body below the previous candle
3. Scob forms in continuation of the trend movement
4. Scob completely ignores inside bars
LIT_GLOBAL_SYS accurately displays Scob as triangles and fully ignores inside bars both left and right. The menu allows complete customization of display and quantity of displayed Scobs.
--- Liquidity Lines, Order Flow, and Three-Minute Rule
Auxiliary functions include:
- Liquidity Lines -
Each pullback is marked with a line, showing where unclosed liquidity exists. Completed lines can be hidden to help predict price movement and enter trades correctly.
- Order Flow -
The indicator implements order flow by drawing a line when a pullback is broken (closed by body) in the opposite direction until the second touch. If price moves away without a second touch, the line remains, showing unclosed OF and potential price return zones.
- Three-Minute Rule -
Some LIT traders use the three-minute rule: price manipulations in the last and first three minutes of each 15-minute candle are additional entry factors, especially in the last quarter of an hourly candle. LIT_GLOBAL_SYS displays this rule only on the one-minute timeframe with symbols below for M15 and H1.
--- Trading Sessions, PDH/PDL, and EMA
The system includes:
- Trading sessions (Tokyo, Frankfurt, London, New York) with customizable time settings
- Previous Day High and Previous Day Low (pdh/pdl) levels
- Exponential Moving Average (EMA) with adjustable length
- Equilibrium display between current BoS and CHoCH levels
--- Alert System
LIT_GLOBAL_SYS includes all necessary alerts for Liquidity Inducement Theorem:
1. SCOB
2. EMA
3. BoS, ChoCh, Sweep
4. IDM
5. IDM OB and Ext OB
Users can simply check the desired alerts in the menu and activate them to receive notifications when price reaches specified zones.

Multi Timeframe Breakout/Retest (Gap, FVG, B&R)📊 Breakout & Retest Multi-Timeframe Indicator - Support and Resistance Indicator 📊
In short, this indicator scans 4 timeframes of your choice to check if a proper breakout of your support and resistance lines you input has happened. It color-coats your support and resistance levels based on the type of breakout, labels the levels, and shows which timeframes have had a proper breakout in an interactive table. This tool is primarily used to determine when a breakout—whether Fair Value Gap (FVG), gap, or regular—has occurred, allowing you to confidently play the retest.
🔍 Types of Breakouts:
This indicator highlights three types of breakouts:
Regular Breakouts: Defined when a candle breaks above or below your level, then closes, and the next candle’s wick does not touch that level.
Gap Breakouts: A gap breakout occurs when we gap above or below the level—often happening on daily candle opens and closes.
FVG Breakouts: An FVG breakout happens when a breakout above or below your level forms a Fair Value Gap, with your level inside the gap. These breakouts tend to have stronger retests
📋 Interactive Table
The table helps you visualize which levels are experiencing a breakout and on which timeframes. It color-codes each level based on breakout activity:
🔴 Red: No active breakouts
🟢 Green: Active regular breakout
🔵 Blue: Active FVG breakout
🟡 Yellow: Active gap breakout
🎨 Color Coating & Minimum Timeframe Breakouts
To make sure you're playing a true breakout, you want confirmation on at least 3 of your chosen timeframes. This indicator has an adjustable "active minimum breakout" setting, which can be customized between 1 and 4 timeframes. I personally find that when a breakout occurs on at least 3 timeframes, the retest tends to have a higher success rate. But you can adjust this setting based on your strategy.
🔧 Future Updates (Follow for Updates):
🚨 Alerts: Set alerts for breakouts and retests.
⚙️ Improved Error Handling: For a smoother experience.

Imbalance Detector [LuxAlgo]This indicator detects and highlights market imbalances alongside a dashboard returning information about their frequency of occurrence and their fill percentage. Imbalances included in this script are Fair Value Gaps (FVG), Opening Gaps (OG) and Volume Imbalances (VI).
Alerts are available for the occurrences of all market imbalances.
Settings
Imbalances
Each imbalance has the same settings layout:
Imbalance: Enable/disable the detection of the specific imbalance.
Min Width: If enabled, requires the imbalance area width to be greater than the specified value. This minimum width can be expressed in points, percentages or ATR multiples.
Extend: Extend imbalances by a specified number of bars.
Dashboard
Show Dashboard: Enable/disable the dashboard on the chart.
Dashboard Location: Location of the dashboard on the chart.
Dashboard Size: Size of the dashboard.
Usage
Market imbalances are part of the many concepts available to price action traders and highlight areas where there is a disparity between supply and demand.
It is common to see price come back to these areas and traders often use them as supports and resistances but also as targets.
Details
The script can detect three distinct types of imbalances described below.
Fair Value Gaps
Fair Value Gaps (FVG) are three candle formations characterized by a gap between the wicks of the non-adjacent candles in the formation.
A bullish FVG is characterized by a gap between the current price low and the 2 bars anterior price high, and a bearish FVG is characterized by a gap between the current price high and the 2 bars anterior price low.
Opening Gaps
Opening Gaps (OG) are imbalances characterized by non-existent activity within a specific price range.
A bullish OG occurs when the current price low is greater than the previous high, a bearish OG occurs when price high is lower than the previous price low.
Opening Gaps primarily occur in closing markets, as such they are less common in the cryptocurrency market.
Most of the time an Opening Gap will also be accompanied by a Fair Value Gap, in order to avoid clutter the indicator will not detect Fair Value Gaps if Opening Gaps are enabled and if an Opening Gap has been detected
Volume Imbalances
Volume Imbalances (VI) are characterized by a price discontinuity between the opening price and previous close, but unlike Opening Gaps we do not see nonexistent activity within a certain price range.
A bullish VI occur when both the opening and closing prices are superior to the previous closing price, with the current price low overlapping the previous price high. A bearish VI occur when both the opening and closing prices are inferior to the previous closing price, with the current price high overlapping the previous price low.
Because Volume Imbalances can occur excessively on markets with frequent gaps, we make use of an additional condition for filtering out less significant imbalances. Bullish VI's will require the previous price high to be lower than the opening price, while bullish VI's will require the previous price low to be higher than the opening price.

MTF fair value gap v2 thigh gaps yumwell load in 2 FVG indicators one for current chart then one for MTF of interest.
Higher timeframe FVGs are more important and can be used for bias or even targets for internal liquidity.
big thanks @shanxia for basically re-doing the FVGs into arrays hehehe..
Can now delete mitigated or change mitigated color..
I dont know who uses extensions but if you want to suffer in your private time then go ahead...
pre sure this is the sexiest FVG indicator validate me in the description pls
First Candle's FVGsBull & Bear FVG – One at a Time
This indicator is rule #1 designed to be used with the First 15-Minute Candle indicator. It’s intended strictly for the 1-minute timeframe and should only be applied after 9:45 AM.
In other words, once the market breaks outside the high or low of the first 15-minute candle of the day, that’s when this FVG logic kicks in. It will detect either bullish or bearish Fair Value Gaps and display only one direction at a time: hiding bearish levels when bullish is active and hiding bullish levels when bearish is active.
In short, it waits for the market to break that initial 15-minute range and then helps you focus on a single FVG direction at a time for cleaner and simpler trading.

MTF 4h Structure + FVG (CORRECTED)This is a fully customizable Multi-Timeframe (MTF) indicator for SMC traders. It overlays true Higher Timeframe market structure onto your current chart. While it defaults to the 4-Hour (4h) structure, you can easily change this to 1h, Daily, or Weekly in the settings to suit your strategy.
Key Features:
1. Dynamic MTF Overlay: Select any Higher Timeframe (HTF) in the settings. The script calculates true pivots on that timeframe and projects them onto your chart without repainting issues.
2. Active Dealing Range: Automatically displays the Swing High and Swing Low of the selected HTF.
3. Equilibrium (EQ): Marks the 50% level of the range to help you identify Premium (Sell) vs. Discount (Buy) zones.
4. HTF Fair Value Gaps (FVG): Detects and draws unmitigated FVGs from your selected timeframe, acting as high-probability POIs.
Visuals & Logic:
- Green/Red: Signals CHoCH (Trend Reversals).
- Gray: Signals BOS (Trend Continuation) - keeping the chart clean.
- Smart Calculation: Calculates structure explicitly on the HTF data to prevent false signals on lower timeframes.
How to use:
1. Add to your chart (e.g., 5m or 15m).
2. Open Settings -> Select your desired "Higher Timeframe" (Default is 4h).
3. Trade in the direction of the HTF Trend (Labels) and look for entries within HTF FVGs in the correct Discount/Premium zone.

Imbalance Volume Trend📌 Imbalance Volume Trend — Fair Value Gaps + Volume Imbalance + Trend Shifts
Imbalance Volume Trend is a price-action-driven indicator that automatically detects Fair Value Gaps (FVGs), measures the volume imbalance inside each gap, and builds a dynamic trend structure based on the sequence and strength of imbalances.
It visualizes the true power behind impulsive moves and provides early signals of potential trend reversals.
🔍 Core Concept
A Fair Value Gap appears when the market moves aggressively in one direction, leaving an “unfair” price zone caused by a strong imbalance between buyers and sellers.
These zones are often revisited by price, providing high-probability trading opportunities.
This indicator not only marks FVGs but also evaluates how strong the imbalance truly was by analyzing buy/sell volume dominance on the breakout candle.
📘 How the Indicator Works
1. Automatic Fair Value Gap Detection
The indicator scans for the classic 3-candle FVG pattern:
Bullish Imbalance
Candle 2 forms the bullish impulse.
A gap remains between the High of Candle 1 and the Low of Candle 3.
The indicator draws a bullish rectangle covering this area.
Bearish Imbalance
Candle 2 forms the bearish impulse.
A gap remains between the Low of Candle 1 and the High of Candle 3.
A bearish rectangle is drawn around the imbalance.
The breakout candle (the middle candle) forms the core of the imbalance and shows the directional expansion of price.
2. Volume Imbalance Percentage (%)
A unique feature of this tool is the calculation of buyer vs seller volume dominance inside each imbalance.
Can analyze lower-timeframe volumes or tick volumes.
The indicator computes how much buyers or sellers dominated during the formation of the FVG.
A colored percentage label appears near every imbalance, showing:
Buyer dominance % for bullish gaps
Seller dominance % for bearish gaps
This helps traders understand the strength of each imbalance.
Often, during late stages of a trend, the percentage value starts to weaken — giving early warning of trend exhaustion.
3. Imbalance-Based Trend Structure
Another powerful component is the Imbalance Trend Engine, which builds a trend direction using consecutive FVGs.
A trend continues as long as new imbalances form in the same direction.
A trend reversal is detected when:
A new imbalance appears in the opposite direction, and
Its body breaks through a specified level of the previous imbalance of the current trend.
When this event occurs, the indicator plots a colored arrow marking the change in Imbalance Trend.
This creates a clean and logical price-action trend model built entirely on institutional-style imbalances.
4. Alerts & Notifications
The indicator supports TradingView alerts for:
New Imbalance Detected
Imbalance Trend Reversal

MP Universal FVG Detector🇺🇸 English Description
MP Universal FVG Detector
A clean and powerful indicator that automatically detects classic ICT 3-candle Fair Value Gaps on any market and any timeframe.
It highlights bullish and bearish imbalances with clear colored boxes, helping you quickly spot inefficient price zones where liquidity is likely to return.
Perfect for:
• Smart Money Concepts
• ICT/Inner Circle Trader setups
• Breaker / OB / Displacement traders
• Scalpers, day traders, swing traders
The indicator works with all assets: crypto, forex, stocks, indices, commodities — and on all timeframes.
🇺🇦 Опис українською
MP Universal FVG Detector
Чистий і потужний індикатор, який автоматично визначає класичні 3-свічкові Fair Value Gap (FVG) у стилі ICT на будь-якому ринку та будь-якому таймфреймі.
Він підсвічує бичачі та ведмежі дисбаланси кольоровими боксами, щоб ти легко бачив неефективні зони ціни, куди з великою ймовірністю повернеться ліквідність.
Підходить для:
• Smart Money Concepts
• ICT/Inner Circle Trader структур
• Breaker / Order Block / Displacement трейдерів
• Скальпінгу, внутрідеяльної та свінг-торгівлі
Працює з усіма активами: крипта, форекс, акції, індекси, товари — і на всіх таймфреймах.

ORB + FVG w Alerts ORB for chart timeframe. Draws FVG for breakout move or first FVG to form after close outside of ORB. Also draws FVGs if price closes back inside the ORB after closing outside the ORB.
Inspired by Casper SMC on YouTube. Not perfect, but it helps me focus on this set-up.

KGdana ORB + FVGORB for chart timeframe. Draws FVG for breakout move or first FVG to form after close outside of ORB. Also draws FVGs if price closes back inside the ORB after closing ouside the ORB.
Fair Value Gap Pro by Bifrost InstituteFair Value Gap Pro brings institutional-style FVGs to TradingView with the precision and controls traders actually need. It detects clean 3-candle gaps on any higher timeframe, projects them onto your active chart, and overlays precise buy/sell volume ratios so you can judge the quality of a gap at a glance. Everything is customizable—from colors and line styles to tag markers, and volume display—so the tool adapts to your workflow instead of the other way around.
🔭 Multi-Timeframe Engine
Higher Timeframe Detection: Choose any HTF (M5, H1, H4, D1, etc.) and view those gaps on any lower-TF chart
Smart Gap Detection: Strict 3-candle mode ensures only successive bars form gaps—automatically rejects weekend gaps and market closures
Configurable History: Scan back 1-500+ bars with intelligent processing
Extend Until Filled: Gaps dynamically extend forward until price fills them, or use fixed-width mode
Advanced Fill Logic: Fill Rules - Close only, wick only, or close/wick; Fill Depth: TouchAny (immediate edge touch) or TouchMid (requires 50% penetration)
TouchMid Margin: Fine-tune difficulty with -50% to +50% adjustment (e.g., -10% = easier fill at 40% depth)
Weekend Gap Protection: Prevents false fills from market gaps—only real price action counts
📊 HTF-Accurate Volumetrics
True HTF Volume: Uses higher timeframe bar data for accurate volume matching across all chart timeframes
Buy vs Sell Delta: Integrated volume analysis for every FVG shows institutional pressure
Display Formats: Decimal ratios, percentages, or raw values (with K/M/B suffixes)
Volume Modes: Bar Delta (fast & reliable, recommended), Tick Delta (optional, feed-dependent)
Clear "+" (buy) and "–" (sell) prefixes for instant reading
🎨 Fully Customizable Appearance
Color Control: Color pickers for Bullish/Bearish FVG fills & Filled state colors (different from active), Band lines, midlines, and text labels.
Formation and fill tag markers
Line Styling: Color & Width
🔔 Alerts
Toggle formation/fill alerts independently
🏷 Tags
Visual Tags: Show markers - Text / Icon per event type
Icon choices: Circle, Square, Diamond, Star, Up/Down Arrow
Independent colors for formation vs fill tags
Auto-remove "formed" tag when "filled" tag appears
Configurable size and positioning
🧩 Rendering & Fill Display
Triple-Band Display: Upper, mid, and lower boundary lines with configurable styles
Filled Rectangle: Semi-transparent fill between boundaries for clear visualization
Fill State Management: Hide filled gaps completely, or keep them visible with distinct "filled" colors.
"Use Filled Colours" option for easy state identification
Quality Filters: Minimum body size filter (in chart points) to exclude noise from low-volatility periods
⚙️ Quality-of-Life Features
Performance Optimized: Efficient HTF/LTF time mapping with binary search algorithms
Cross-Symbol Compatible: Robust handling across all symbols and data feeds
Sensible Defaults: Works beautifully out of the box—tweak only what you need
Minimal Chart Clutter: Designed to keep critical information visible without overwhelming your workspace
💡 Perfect For
Institutional gap traders who need precision and control
Multi-timeframe analysts requiring HTF context on LTF charts
Volume profile traders seeking buy/sell pressure confirmation
Traders who value clean, professional chart aesthetics
Anyone tired of indicators that force rigid workflows
Fair Value Gap Pro doesn't just show you gaps—it gives you the complete institutional picture with the flexibility to trade your way.

ob-fvg-jorgechutofx📊 **4-Candle Pattern (OB + FVG + BOS)**
This indicator identifies a four-candle structural pattern combining **Order Block (OB)**, **Fair Value Gap (FVG)**, and **Break of Structure (BOS)**.
* **Candle 1:** reference level to be broken.
* **Candle 2:** potential **Order Block** (origin zone).
* **Candle 3:** confirms the **structure break**.
* **Candle 4:** forms the **FVG**, showing market imbalance.
Perfect for spotting **institutional entry zones** and validating **market inefficiencies** across any timeframe.

ICT SMC ToolKit By VIPIN | High Volume OB + BOS, CHoCH, FVG📌 ICT Smart Money Concepts (SMC) Toolkit
This indicator provides traders with a complete Smart Money Concepts (SMC) framework inside a single tool. It helps to visualize institutional trading footprints and market structure shifts more effectively without the need to combine multiple separate indicators.
---
🔹 Key Features
1. **Order Blocks (OB):**
- Automatically detects bullish and bearish order blocks.
- Helps traders identify institutional buying/selling zones where large players may be active.
- Volume filters included for more accurate signals.
2. **Break of Structure (BOS):**
- Marks market structure breaks that indicate continuation of the trend.
- Useful for identifying trend direction and confirming order flow.
3. **Change of Character (CHoCH):**
- Highlights early signs of market reversals.
- Shows when price transitions from bullish to bearish order flow (or vice versa).
4. **Fair Value Gaps (FVG):**
- Automatically draws zones of price imbalance.
- Traders can use these zones as possible retracement or entry levels.
- Helps to spot areas where price may return to "rebalance".
5. **Liquidity Sweeps:**
- Identifies liquidity grabs around recent highs and lows.
- Useful for spotting stop hunts and smart money manipulation before reversals.
6. **Custom Presets & Filters:**
- Users can toggle between OB-only, FVG-only, Sweep-only, or full SMC mode.
- Multiple color settings available for clear chart visualization.
---
🎯 Purpose of the Script
- Brings all major SMC tools (OB, BOS, CHoCH, FVG, Liquidity Sweep) together in one indicator.
- Reduces the need for multiple overlapping indicators.
- Helps traders simplify their workflow and keep charts clean.
- Focused on education, analysis, and market structure visualization.
---
⚠️ Disclaimer
This script is intended **for educational and analytical purposes only**.
It does not provide financial advice, trade recommendations, or guaranteed profits.
Traders should always manage their own risk and confirm setups with additional confluences.
---
ℹ️ Notes for Users
- This indicator works on multiple timeframes and instruments (Forex, Commodities, Indices, Crypto).
- Best used with a strong understanding of Smart Money Concepts (SMC) and ICT methodology.
- Combining this tool with your own analysis will provide the best results.

ICT FVG Buy/Sell SignalsThis bot is built on ICT (Inner Circle Trader) concepts such as:
Fair Value Gaps (FVGs) – imbalance zones between candles.
Consequent Encroachment (CE) – the midpoint of a gap.
Premium / Discount Arrays – dealing ranges split into premium (sell-side) and discount (buy-side) zones.
Displacement candles – strong impulsive moves that confirm intent.
The bot scans for FVGs, marks CE levels, and waits for price to return to these levels.
When price revisits a valid FVG zone with displacement confirmation and in the correct PD array, the bot generates a BUY or SELL signal.
✅ Signal Rules
Buy Signal
Price trades back into a Bullish FVG.
Current bar shows bullish displacement (large bullish body relative to ATR).
Price is in discount territory of the current dealing range (if PD filter is enabled).
Close is above the CE line of the FVG.
Sell Signal
Price trades back into a Bearish FVG.
Current bar shows bearish displacement.
Price is in premium territory of the current dealing range.
Close is below the CE line of the FVG.
🎯 What You’ll See on the Chart
Green “BUY” labels below candles when long signals trigger.
Red “SELL” labels above candles when short signals trigger.
Shaded background:
Red = Premium zone (sell side).
Teal = Discount zone (buy side).
Yellow line = dealing range midpoint (equilibrium).
Dots on CE lines = midpoints of the latest bullish/bearish FVG.
🔔 Alerts
ICT Buy → Triggers when a bullish setup confirms.
ICT Sell → Triggers when a bearish setup confirms.
You can connect these alerts to:
TradingView notifications.
Webhooks (for brokers or bots like MetaTrader, NinjaTrader, or Discord).
⚙️ Settings
Swing length – how many bars to use when detecting swing highs/lows for the dealing range.
Use PD filter – toggle ON/OFF for requiring discount/premium alignment.
Displacement ATR multiple – how strong the candle body must be compared to ATR to count as a displacement.
ATR length – used for displacement filter.
📈 Supported Markets
Works on all symbols and timeframes.
Commonly applied to:
NASDAQ (NQ, QQQ)
S&P500 (ES, SPX, SPY)
Forex pairs
Crypto (BTC, ETH, etc.)
⚠️ Disclaimer
This bot is for educational purposes only. It does not guarantee profits and should be tested on demo accounts first.
Always apply proper risk management before trading live.

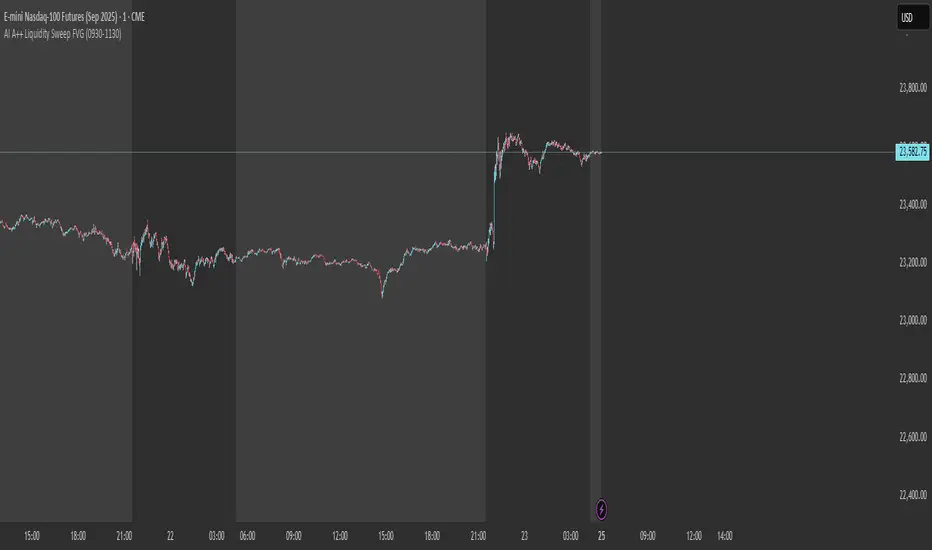
AI A++ Liquidity Sweep FVGThat is a critical question. For the "AI A++ Liqu-idity Sweep FVG" indicator to work exactly as designed, you must have your chart set to the:
1-Minute (1m) Timeframe
The Reason:
The logic of the script is built to analyze the very specific, rapid price action that occurs in the first few minutes of the New York session open.
FVG Detection: A Fair Value Gap is a three-candle pattern. On the 1-minute chart, this allows us to see the rapid imbalances created by the opening burst of volume. On a higher timeframe like the 5-minute or 15-minute, these subtle but powerful gaps would be smoothed over and might not even be visible.
Liquidity Sweep Precision: The script is looking for a quick "stop hunt" that pierces the pre-market high or low and then immediately reverses. This action is most clearly and accurately seen on the 1-minute chart.
Using any other timeframe will cause the indicator to analyze the market incorrectly and either miss valid setups or provide false signals.
So, to confirm your setup for Monday morning:
Instrument: MNQ (Micro E-mini Nasdaq-100 Futures)
Timeframe: 1-Minute
Indicator: "AI A++ Liquidity Sweep FVG" active on the chart.
Alert: Alert set up for the indicator.
You are now perfectly set up to catch the exact A++ setup we are waiting for.
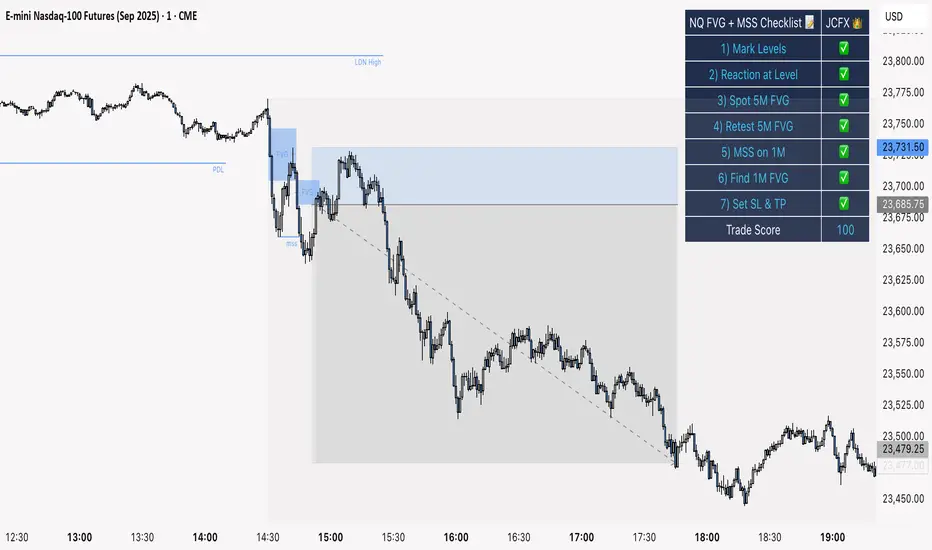
NQ FVG + MSS ChecklistThe NQ FVG + MSS Quick Checklist is a visual trading HUD for Nasdaq 100 (NQ) futures. It helps traders quickly track key setup elements: session & previous day levels, 5M FVG, retests, 1M MSS, and 1M FVG inside MSS.
Each step can be manually ticked, and a Trade Score shows setup strength at a glance. The checklist table sits on top of all chart elements for easy reference without interfering with your analysis.
Features:
Step-by-step NQ trading checklist
Manual inputs with visual ✅/❌
Trade Score for quick setup confirmation
Table overlay always on top of the chart