FVG by AzaA special indicator that is correctly configured for the 3-touch strategy and structure breakdown
Cari dalam skrip untuk "fvg"

FVG / FRACTALS HELPERTG: imjustdanya
Индикатор автоматически находит фракталы/имбалансы на выбранных таймфреймах
Можно настраивать всё,от внешнего вида, до количества отображаемых объектов
Экономит много времени,и очень эффективен при интрадей торговле в стратегии Price Action
The indicator automatically detects fractals and imbalances on selected timeframes.
You can customize everything — from appearance to the number of displayed objects.
It saves a lot of time and is highly effective for intraday trading within a Price Action strategy.


FVG Bibliothek BeispielZeigt die Fair Value Gap für Long und Short und löscht die geschlossenen FVGaps automatisch.
FVG Strength Detector (1–5)shows you fair value gaps with a rating score of 5 strongest to 1 weakest so if u see a 4 thats a good area
FVG + Liquidity Sweepsthis is a test and i don't know if it is gonna actually work but let me know if it does.
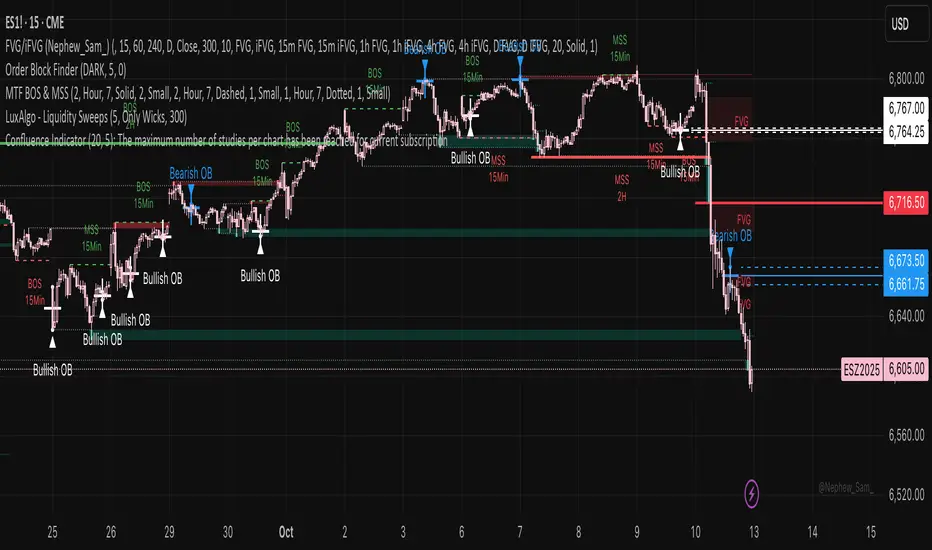
FVG + IFVG Gap (ULTRA) by Aditya NejeThis Indicator shows Fair Value Gap and Inverse Fair Value gaps

FVG Finder (MONEYTALLKERS)An indicator for determining Imbalance in the market structure. It will help you identify important areas where market algorithms have failed.

Inversion Fair Value Gap Model [PJ Trades]GENERAL OVERVIEW:
The Inversion Fair Value Gap Model indicator is a complete rule-based system designed to identify trade setups using the Inversion Fair Value Gap strategy taught by PJ Trades. It automates the strategy’s workflow by detecting liquidity sweeps, confirming V-shape recoveries, identifying valid Inversion Fair Value Gaps, validating higher-timeframe Fair Value Gap taps, and checking for a clear opposite Draw On Liquidity. These factors are evaluated together to produce a signal rating of A, A+, or A++, based on how many of these criteria the setup satisfies. When a long or short setup is confirmed, the indicator automatically plots an entry, stop-loss, break-even, and two take-profit levels.
A dashboard that updates in real-time displays the current directional bias, liquidity sweep activity, Inversion Fair Value Gap confirmation state, V Shape Recovery state, higher-timeframe Fair Value Gap context, opposite Draw on Liquidity, SMT divergence, and other key information relevant to the trading model. The indicator also includes optional trade statistics on the dashboard that tracks the recent win rates for A, A+, and A++ setups, as well as separate long and short win rates.
This indicator was developed by Flux Charts, in collaboration with PJ Trades.
What is the theory behind the indicator?:
The Inversion Fair Value Gap model is built on the idea that when the market pushes above a high or below a low, it often does so to sweep liquidity. If that move quickly fails and price reverses, it shows the sweep was a grab for orders and not a continuation. That quick rejection is the V Shape Recovery behavior. An Inversion Fair Value Gap forms when a Fair Value Gap that once supported the original move gets invalidated afterward. That invalidation confirms the shift in direction and becomes the new reference point for trades. The Inversion Fair Value Gap model uses this sequence because it highlights when the market has taken liquidity, rejected continuation, and started delivering in the opposite direction.
INVERSION FAIR VALUE GAP MODEL FEATURES:
The Inversion Fair Value Gap Model indicator includes 15 main features:
Sessions
Key Levels & Swing Levels
Liquidity Levels
Liquidity Sweeps
V Shape Recoveries
Higher-Timeframe Fair Value Gaps
Inversion Fair Value Gaps
Macros
Bias
Signals
New Day Opening Gap
New Week Opening Gap
SMT Divergences
Dashboard
Alerts
SESSIONS:
The Inversion Fair Value Gap Model indicator includes five trading sessions (times in EST):
Asia: 20:00 - 00:00
London: 02:00 - 05:00
NY AM: 09:30 - 12:15
NY Lunch: 12:15 - 13:30
NY PM: 13:30 - 16:00
Session highs and lows are automatically tracked and used within the indicator’s signal logic.
🔹Session Zones:
Each session has a zone that outlines its active time window. These zones can be toggled on or off independently. When active, they visually separate each part of the trading day. Users can adjust the color and opacity of each session box. Users can also enable session labels, which place a label above each session zone showing its corresponding session name.
🔹Session Time:
Users can toggle on ‘Time’ which will display each session’s time window next to its session title.
🔹Session Highs/Lows:
Every session can display its own high and low as horizontal lines. Users can customize the line style for session highs/lows, choosing between solid, dashed, or dotted. The color of the lines will match the same color used for the session box. Users can adjust the color of the labels as well, which is applied to all session high/low labels.
When price has moved above a session high, or below a session low, the label will not be displayed anymore.
🔹Extend Levels:
When enabled, each session’s high and low levels can be extended forward by a set number of bars.
Please Note: Disabling a session under the main Sessions section only hides its visuals (boxes, lines, or labels). It does not impact signal detection or logic.
KEY LEVELS:
The Inversion Fair Value Gap Model indicator includes 11 key market levels that outline important structural price areas across daily, weekly, and monthly timeframes. These levels include the Daily Open, Previous Day High/Low, Weekly Open, Previous Week High/Low, Monthly Open, Previous Month High/Low, Midnight Open, and 08:30 Open. The levels can be enabled or disabled and customized in color and line style. All of the levels except the Midnight Open and 08:30 Open are used for the indicator’s signal logic.
🔹Daily Open
The Daily Open marks where the current trading day began.
🔹Previous Day High/Low
The Previous Day High (PDH) marks the highest price reached during the previous regular trading session. It shows where buyers pushed price to its highest point before the market closed.
The Previous Day Low (PDL) marks the lowest price reached during the previous regular trading session. It shows where selling pressure reached its lowest point before buyers stepped in.
When price pushes above the PDH or below the PDL, the level is removed from the chart.
🔹Weekly Open
The Weekly Open marks the first price of the current trading week.
🔹Previous Week High/Low
The Previous Week High (PWH) marks the highest price reached during the previous trading week. It shows where buying pressure reached its peak before the weekly close.
The Previous Week Low (PWL) marks the lowest price reached during the previous trading week. It shows where sellers pushed price to its lowest point before buyers regained control.
When price pushes above the PWH or below the PWL, the level is removed from the chart.
🔹Monthly Open
The Monthly Open marks the opening price of the current month.
🔹Previous Month High/Low
The Previous Month High (PMH) marks the highest price reached during the previous calendar month. It represents the point at which buyers achieved the strongest push before the monthly close.
The Previous Month Low (PML) marks the lowest price reached during the previous calendar month. It shows where selling pressure was strongest before buyers stepped back in.
When price pushes above the PMH or below the PML, the level is removed from the chart.
🔹Midnight Open
The Midnight Open marks the first price of the trading day at 00:00 EST.
🔹08:30 Open
The 08:30 Open marks the opening price at 08:30 EST.
🔹Customization Options:
Users can fully customize the appearance of all key levels, including the following:
Labels
Label Size
Line Style
Line Colors
Labels:
Users can toggle on ‘Show Labels’ to display labels for each toggled-on level that price hasn’t pushed above/below. Users can also adjust the size of labels, choosing between auto, tiny, small, normal, large, or huge.
Line Style:
Users can select a line style, choosing between solid, dashed, or dotted, which is applied to all toggled-on key levels.
Line Color:
Users can choose different colors for each of the following key levels:
Daily Open, Previous Day High, Previous Day Low
Weekly Open, Previous Week High, Previous Week Low,
Monthly Open, Previous Month High, Previous Month Low
Midnight Open
08:30 Open
🔹Extend Levels:
When enabled, each key level is extended forward by a set number of bars.
Please Note: Disabling a level in the “Key Levels” section only hides its visuals and does not affect the indicator’s signals.
🔹Swing Levels
The indicator automatically plots Swing Highs and Swing Lows which are used in the indicator’s signal generation logic.
A swing high forms when a candle’s high is greater than the highs of the bars immediately before and after it.
A swing low forms when a candle’s low is lower than the lows of the bars immediately before and after it.
🔹Swing Level Colors
Users can customize the color of Active Levels and Swept Levels.
Active Levels are levels that price has not pushed above or below
Swept Levels are levels that price pushed above or below.
🔹Swing Levels – Show Nearest
This setting determines how many swing highs/lows are displayed on the chart. The indicator will display the nearest X highs to price and the nearest X lows to price.
For example, if ‘Show Nearest’ is set to 2, the nearest 2 swing highs and nearest 2 swing lows to price will be plotted on the chart.
LIQUIDITY LEVELS:
The Inversion Fair Value Gap Model indicator automatically identifies and plots liquidity at key structural points in the market. These include swing highs and swing lows, session highs and lows, and major higher timeframe reference points as explained in the SESSIONS and KEY LEVELS sections above. All of these areas are treated as potential pools of resting orders and are used throughout the indicator’s signal logic.
🔹What is Buyside Liquidity?:
Buyside Liquidity (BSL) represents price levels where many buy stop orders are sitting, usually from traders holding short positions. When price moves into these areas, those stop-loss orders get triggered and short sellers are forced to buy back their positions. These zones often form above key highs such as the previous day, week, or month. Understanding BSL is important because when price reaches these levels, the sudden wave of buy orders can create sharp reactions or reversals as liquidity is taken from the market.
🔹What is Sellside Liquidity?:
Sellside Liquidity (SSL) represents price levels where many sell stop orders are waiting, usually from traders holding long positions. When price drops into these areas, those stop-loss orders are triggered and long traders are forced to sell their positions. These zones often form below key lows such as the previous day, week, or month. Understanding SSL is important because when price reaches these levels, the surge of sell orders can cause sharp reactions or reversals as liquidity is taken from the market.
🔹 Which Liquidity Levels Are Used
The indicator tracks liquidity at the following areas:
Asia Session High/Low
London High/Low
NY AM High/Low
NY Lunch High/Low
NY PM High/Low
Previous Day High and Low
Previous Week High and Low
Previous Month High and Low
Daily Open
Weekly Open
Monthly Open
Swing Highs/Lows
🔹 How Liquidity Levels Are Used
All tracked levels across sessions, swing points, and higher timeframes serve as potential liquidity targets. When price trades above one of these highs, the indicator looks for short setups if other confluences align. When price trades below lows, the indicator looks for long setups if other confluences align.
LIQUIDITY SWEEPS:
The indicator automatically detects Buyside Liquidity and Sellside Liquidity sweeps using the liquidity levels mentioned in the previous section.
🔹What is a Liquidity Sweep?
Liquidity sweeps occur when price trades beyond a key high or low and activates resting buy-stop or sell-stop orders in that area. It’s how the market gathers the liquidity needed for larger participants to enter positions.
Traders often place stop-loss orders around obvious highs and lows, such as the previous day’s, week’s, or month’s levels. When price pushes through one of these areas, it triggers the stops placed there and generates a burst of volume. This can lead to quick movements in price as those orders are executed.
🔹Sellside Liquidity Sweep
These occur when price dips below a Sellside Liquidity (SSL) level, taking out the stop-loss orders placed by long traders below that low. When this happens, the indicator records the sweep and begins monitoring for potential long setups as the next step in the IFVG trading strategy. Long trades are only eligible after a SSL sweep.
🔹Buyside Liquidity Sweep
These occur when price dips above a Buyside Liquidity (BSL) level, taking out the stop-loss orders placed by short seller traders above that high. When this happens, the indicator records the sweep and begins monitoring for potential short setups as the next step in the trading strategy. Short trades are only eligible after a BSL sweep.
🔹How to Use Liquidity Sweeps
Liquidity sweeps are not direct trade signals. They are best used as context when forming a directional bias. A sweep shows that the market has removed liquidity from one side, which can hint at where the next move may develop.
For example:
When BSL is swept, it often signals that buy stops have been triggered and the market may be preparing to move lower. Traders may then begin looking for short opportunities.
When SSL is swept, it often signals that sell stops have been triggered and the market may be preparing to move higher. Traders may then begin looking for long opportunities.
V SHAPE RECOVERIES:
🔹 What Is a V Shape Recovery?
A V shape recovery is a sharp, immediate reversal that happens right after price sweeps BSL or SSL. It indicates that price quickly moved back in the opposite direction after trading through the level. This behavior signals a shift in momentum and is a required confirmation in the indicator for signal generation. The indicator will not look for long trades after a SSL sweep unless a V shape recovery occurs. It will not look for short trades after a BSL sweep unless a V shape recovery occurs. Without this behavior, the indicator assumes that price may still be delivering in the direction of the sweep, so no valid setups can form.
🔹 Why V Shape Recoveries Matter
V shape recoveries help confirm that the liquidity the sweep did not immediately continue in the same direction. They separate false breaks from true continuation. A sweep without recovery often means price may keep trending, so the indicator does not generate signals in those cases. A sweep with a V shape recovery confirms rejection and sets the foundation for valid Inversion Fair Value Gap formation. This makes the V shape recovery one of the most important sequence steps in the Inversion Fair Value Gap Model.
🔹 How the Indicator Detects V Shape Recoveries
V shape recoveries can be visually intuitive when looking at a chart, but they are difficult to define consistently programmatically. To ensure reliable and repeatable detection, the indicator uses a rules-based method that evaluates candle size, candle direction, and the strength of the move immediately following the liquidity sweep. This approach removes subjectivity and allows the indicator to confirm V shape behavior the same way every time.
The indicator does not plot any visual elements specifically for V shape recoveries. Instead, the presence of a V shape recovery is implied through the signals themselves. Every valid long or short signal that appears after a liquidity sweep requires a confirmed V shape recovery. This means that if a signal is generated following a sweep, a V shape recovery has occurred.
🔹 V Shape Recovery After a Sellside Sweep (SSL Sweep)
After price trades below a sellside liquidity level, long positions are liquidated. If buyers quickly step in and force price upward with strong momentum, this forms a V shape recovery. This signals that the sweep below the low was rejected and that buyers have reclaimed control. When this occurs, the indicator begins monitoring for long setups.
🔹 V Shape Recovery After a Buyside Sweep (BSL Sweep)
After price pushes above a buyside liquidity level, many short positions are stopped out. If sellers immediately step in and drive price back down with strong movement, this forms a V shape recovery. This behavior reflects a quick change in candle direction immediately following the sweep. When this occurs, the indicator begins monitoring for short setups.
🔹Failed V Shape Recoveries
These examples show failed V shape recoveries, where price did not reverse decisively after the BSL or SSL sweep. The lack of strong response from buyers or sellers indicates that momentum did not shift. Thus, the indicator will not detect valid long/short setups using these liquidity sweeps.
HIGHER-TIMEFRAME FAIR VALUE GAPS:
Higher-timeframe Fair Value Gaps (HTF FVGs) provide important context in the Inversion Fair Value Gap Model because they show where significant imbalance occurred on larger market structures. The indicator automatically detects HTF FVGs and uses them as part of the signal rating system.
🔹 What Is a Fair Value Gap?
A Fair Value Gap (FVG) is an area where the market’s perception of fair value suddenly changes. On your chart, it appears as a three-candle pattern: a large candle in the middle, with smaller candles on each side that don’t fully overlap it.
A bullish FVG forms when a bullish candle is between two smaller bullish/bearish candles, where the first and third candles’ wicks don’t overlap each other at all.
A bearish FVG forms when a bearish candle is between two smaller bullish/bearish candles, where the first and third candles’ wicks don’t overlap each other at all.
This creates an imbalance because price moved so quickly that one side of the auction did not trade.
Examples:
🔹 What Makes an FVG “Higher-Timeframe”?
In this indicator, HTF FVGs are Fair Value Gaps detected on timeframes higher than the chart’s current timeframe. For example, on a 5-minute chart, a 1-hour FVG would be considered a HTF FVG. The indicator automatically plots and checks whether price interacts with these HTF FVGs during a liquidity sweep and incorporates this into the signal rating (A, A+, A++).
🔹 How the Indicator Uses Higher-Timeframe FVGs
The indicator automatically scans up to three user-selected higher timeframes for valid bullish and bearish FVGs and tracks price’s behavior around them in the background. When any of these higher timeframes are enabled, their FVGs are used directly within the signal logic.
During a liquidity sweep, the indicator checks whether price taps into any enabled HTF FVG. A tap occurs when price trades inside the boundaries of a higher-timeframe FVG during or immediately after the sweep.
A bullish HTF FVG tap during a sellside sweep supports a long setup.
A bearish HTF FVG tap during a buyside sweep supports a short setup.
When an HTF FVG tap aligns with the direction of the setup, the signal’s rating is increased. This can increase a setup’s rating from A to A+ or from A+ to A++.
🔹 Higher-Timeframe FVG Customization
Users can select up to three higher timeframes for HTF FVG detection. When a higher timeframe is enabled, its FVGs are used in the model’s signal logic. Users can also choose whether to display these HTF FVGs visually on the chart, by enabling the ‘Plot HTF FVGs’ setting.
Each enabled HTF FVG can be customized with the following options:
Bullish and Bearish Colors: Users can set different fill colors for bullish and bearish HTF FVGs for each selected timeframe.
Midline: When enabled, a midline is drawn through the center of each HTF FVG. Users can customize the midline’s line style, choosing between solid, dashed, or dotted and also customize the midline’s color.
Labels: When enabled, each plotted HTF FVG displays a label that shows its originating timeframe (for example, 1H, 4H).
Plot HTF FVGs: When disabled, the HTF FVG zones are hidden from the chart while the logic remains active in the background for signals.
Show Nearest:
This setting controls how many HTF FVGs are displayed based on proximity to current price. Users can choose to show the nearest X bullish HTF FVGs and the nearest X bearish HTF FVGs. This filter is applied across all enabled higher timeframes and does not limit by timeframe individually.
🔹When are Higher Timeframe Fair Value Gaps mitigated?
A Higher Timeframe Fair Value Gap is considered mitigated when a candle from the chart’s timeframe closes above the gap for a bearish FVG or below the gap for a bullish FVG.
INVERSION FAIR VALUE GAPS:
Inversion Fair Value Gaps (IFVGs) are a core requirement of the Inversion Fair Value Gap Model. Every long and short signal generated by the indicator requires a valid IFVG, just like liquidity sweeps and V shape recoveries. Without a confirmed IFVG, the model will not produce a setup.
🔹 What Is an Inversion Fair Value Gap?
An Inversion Fair Value Gap is a Fair Value Gap that becomes invalidated by a candle close in the opposite direction. This “flip” confirms that the original imbalance failed and that the market has shifted.
A bullish IFVG forms when a bearish FVG is invalidated by a candle closing above it.
A bearish IFVG forms when a bullish FVG is invalidated by a candle closing below it.
In the indicator, IFVGs are not used as retracement areas. Signals are generated immediately when a valid IFVG forms, not after price returns to the gap. The IFVG itself is the confirmation event that finalizes a setup sequence after a liquidity sweep and V shape recovery.
🔹 How the Indicator Plots IFVGs
The indicator only plots IFVGs that are used in long or short setups. Not every possible IFVG is shown on the chart. Only the IFVG involved in a confirmed signal is displayed. Users can disable IFVG plots entirely if they prefer a minimal view. This hides the visual gaps but does not affect the signal logic.
🔹 Customization Options
Users can customize how IFVGs appear on the chart:
Color Settings: Choose separate fill colors for bullish IFVGs and bearish IFVGs.
Midline: Toggle an optional midline inside the IFVG and choose between a solid, dashed, or dotted line.
Midline Color: Adjust the color of the IFVG Midline.
MACROS:
Macros are short, predefined time windows, where price is more likely to seek liquidity or rebalance imbalances. These periods often create sharp movements or shifts in delivery, giving additional context to setups. In the Inversion Fair Value Gap Model, macros are used as a confluence factor. When a long or short signal forms during a macro time window, the setup’s rating can increase from A to A+ or from A+ to A++.
Macros are not required for a signal to form, but they increase the signal’s rating when the setup aligns with macro timing.
🔹 How the Indicator Uses Macros
The indicator allows users to enable up to five macros. Each macro has its own start and end time, which the user can customize. These time windows are used directly in the signal logic. If a valid IFVG setup forms while price is inside any of the enabled macro windows, the indicator increases the signal’s rating.
Users may visually disable macros on the chart without affecting signal logic. Disabling visuals hides the macro zones, labels, and lines, but the underlying macro logic continues to function in the background for signals.
The indicator’s default macros use the following time periods (in EST):
09:50 - 10:10
10:50 - 11:10
11:50 - 12:10
12:50 - 13:10
13:50 - 14:10
🔹 Macro Settings
Each macro displays a shaded zone representing the active time window. This zone can be toggled on or off. Users can customize:
The color of each macro zone
The opacity of each zone
Whether the zones display at all (‘Show Zones’)
These visuals help identify whether price is currently inside a macro window.
🔹 Macro Labels:
Users can enable macro labels, which place a text label showing the macro’s title and its time window. The label color is global (applies to all macros), and the label size can be adjusted. Individual macros cannot have unique label colors.
🔹 Macro Start/End Lines
For additional clarity, the indicator draws two vertical markers for each macro:
One at the start of the macro
One at the end of the macro
A horizontal macro line is then drawn between the highs of these two candles to highlight the full duration of the macro window. Users can customize:
The line styles (solid, dashed, dotted) of the Macro Line and Start/End Lines
BIAS:
Bias determines which direction the indicator is allowed to generate signals. A bullish bias means only long setups can be confirmed. A bearish bias means only short setups can be confirmed. The bias acts as the final directional filter after a liquidity sweep, V shape recovery, and IFVG have all been validated. Even if all model conditions are met, the indicator will only confirm the setup if the direction aligns with the active bias.
Users are able to manually set a bias or use an automatic bias filter, which is explained below.
🔹 Manual Bias
Users can manually choose the directional bias at any time and choose between Bullish, Bearish, or Both.
When set to Bullish, the indicator will only confirm long setups, regardless of market structure.
When set to Bearish, only short setups are allowed.
When set to Both, the indicator can confirm both long and short setups if all requirements are met.
🔹 Automatic Bias
Automatic bias is fully rules-based and determined by how the previous session interacted with major draw-on-liquidity (DOL) levels. These levels include 1-hour highs and lows, 4-hour highs and lows, previous session highs and lows (such as Asia or London), and the previous day’s high and low. The indicator evaluates whether the previous session consolidated, manipulated liquidity, or manipulated and reversed before closing. Based on this behavior, the indicator establishes a directional bias for the current session.
◇ Previous Session Consolidation:
If the previous session did not sweep any major liquidity levels and price remained inside its range, the session is classified as consolidation.
After the current session sweeps a key low, the bias becomes bullish.
After the current session sweeps a key high, the bias becomes bearish.
The bias is determined live based on which side the current session manipulates first.
◇ Previous Session Manipulation (No Reversal):
If the previous session swept a major high-timeframe level but did not reverse before the session closed, the model assigns a reversal-based bias at the start of the current session.
If the previous session swept a low, the current session bias is bullish.
If the previous session swept a high, the current session bias is bearish.
Here, bias is determined immediately because the previous session’s manipulation defines the directional framework for the current session.
◇ Previous Session Manipulation + Reversal:
If the previous session swept a DOL level and also reversed away from it within the same session, the model assigns a continuation-based bias at the start of the current session.
If the previous session swept a low and reversed upward, the bias for the current session is bullish.
If the previous session swept a high and reversed downward, the bias is bearish.
🔹 How the Indicator Uses Bias in Practice
After the indicator validates the liquidity sweep, V shape recovery, and IFVG, it checks the active bias before confirming a signal.
If bias is bullish, only long setups are allowed.
If bias is bearish, only short setups are allowed.
If bias is Both, setups of either direction may form.
The bias does not influence the detection of liquidity sweeps, V shape recoveries, or IFVGs. It only determines whether those validated components are allowed to produce a final signal. Automatic bias updates based on session behavior, while manual bias remains fixed until the user changes it.
SIGNALS:
Signals are the final output of the Inversion Fair Value Gap Model indicator. A signal is only generated when all model conditions are satisfied in a clear, rules-based sequence.
A signal consists of:
An Entry
A Stop-Loss (SL)
A Breakeven (BE) level
Two Take-Profit levels (TP1 and TP2)
These components are plotted immediately once the final requirement (the IFVG confirmation) is met and the directional filter (bias) allows the setup.
Signals can be rated A, A+, or A++, based on whether certain confluences were present during the setup’s formation.
🔹 What All Signals Have in Common
Each signal type (A, A+, A++) requires the same four mandatory conditions. If any of these four are missing, the indicator will not print a signal.
◇ Required Component #1 – Valid Directional Bias
The bias determines whether the indicator can confirm a long or short setup.
Bullish bias → only long setups allowed
Bearish bias → only short setups allowed
Both → long or short setups allowed
Automatic bias → bias determined by session-based liquidity logic explained above
◇ Required Component #2 – Liquidity Sweep
The indicator must detect one of the following:
Sellside Liquidity Sweep (SSL Sweep) for potential long setups
Buyside Liquidity Sweep (BSL Sweep) for potential short setups
◇ Required Component #3 – V Shape Recovery
After a liquidity sweep, the indicator evaluates whether price produced a valid V shape recovery.
◇ Required Component #4 – Inversion Fair Value Gap (IFVG)
An IFVG must form in the direction of the potential setup.
A bullish IFVG forms when a bearish FVG is invalidated by a candle closing above that gap
A bearish IFVG forms when a bullish FVG is invalidated by a candle closing below that gap
The IFVG must occur after the V Shape Recovery and Liquidity Sweep. The IFVG confirmation is the final structural requirement. Once it forms, the setup is considered structurally complete.
🔹 A Signals
An A-rated signal contains exactly the four required components:
Valid Bias
Liquidity Sweep
V Shape Recovery
IFVG
An A signals represent the foundational implementation of the IFVG Model.
🔹 A+ Signals
An A+ signal includes the full A-signal structure plus ONE of the following:
Higher-Timeframe FVG Tap
Multi-Liquidity Sweep
Inside a Macro Window
◇ Higher-Timeframe FVG Tap
During a liquidity sweep, the indicator checks whether price taps into any enabled HTF FVG. A tap occurs when price trades inside the boundaries of a higher-timeframe FVG during or immediately after the sweep.
A bullish HTF FVG tap during a sellside sweep supports a long setup.
A bearish HTF FVG tap during a buyside sweep supports a short setup.
◇ Multi-Liquidity Sweep
A Multi-Liquidity Sweep occurs when price sweeps two liquidity levels of the same type in the same directional push.
Sweeping two lows in one move: Multi-Sellside Liquidity Sweep (long setups).
Sweeping two highs in one move → Multi-Buyside Liquidity Sweep (short setups).
◇ Inside a Macro Window
The final IFVG confirmation must occur inside a macro time window defined by the user.
If exactly one of these additional confluences is present, the signal rating is A+.
🔹 A++ Signals (Two Additional Confluences)
An A++ signal contains the full A signal structure plus TWO of the three confluences listed above.
HTF FVG tap + Multi-Liquidity Sweep
HTF FVG tap + Inside a Macro Window
Multi-Liquidity Sweep + Inside a Macro Window
If two confluences are present, the rating becomes A++. If all three are present, the setup is still rated a A++ (there is no A+++).
🔹 Signal Plots
When a valid long/short setup is detected, a signal with its rating appears with the following:
Entry: At the close of the candle that inverted a FVG
Stop-Loss: At the nearest swing high for short setups or nearest swing low for long setups
Breakeven Level: At the nearest swing high for long setups or the nearest swing low for short setups
Take-Profit 1: At the second nearest swing high for long setups or the second nearest swing low for short setups.
Take-Profit 2: At the third nearest swing high for long setups or the third nearest swing low for short setups.
After a signal reaches either TP2 or SL, the levels for Entry, SL, BE, TP1, and TP2 are removed from the chart. If another signal appears before the prior signal reaches either TP2 or SL, the levels are also removed.
Users can hover over any signal label to view a short summary of the exact criteria that were met for that setup. This includes whether a HTF FVG tap occurred, whether a multi-liquidity sweep was detected, whether the setup formed inside a macro window, and which liquidity level was swept prior to the V shape recovery.
🔹 Long Setup – A Rating
A long A-rated setup forms when all four core requirements of the IFVG Model occur without any additional confluences. First, price must sweep a Sellside Liquidity level. Immediately after the sweep, price must form a valid V shape recovery. Once the recovery completes, a bullish IFVG must form by invalidating a bearish Fair Value Gap with a candle close above it.
For a confirmed long signal, the indicator marks:
Entry: At the candle close that invalidates the bearish FVG and creates the IFVG
Stop Loss: At the nearest swing low
Breakeven: Midpoint between entry and stop-loss
Take Profit 1: At the second nearest swing high
Take Profit 2: At the third nearest swing high
In this example, price sweeps a swing low, has a V Shape recovery, and forms a bullish IFVG:
🔹 Short Setup – A Rating
A short A-rated setup forms when all four core requirements of the IFVG Model occur without any additional confluences. Price must first sweep a Buyside Liquidity level. Immediately after the sweep, price must form a valid V shape recovery. Once the recovery completes, a bearish IFVG must form by invalidating a bullish Fair Value Gap with a candle close below it.
For a confirmed short signal, the indicator marks:
Entry: At the candle close that invalidates the bullish FVG and creates the IFVG
Stop Loss: At the nearest swing high
Breakeven: Midpoint between entry and stop-loss
Take Profit 1: At the second nearest swing low
Take Profit 2: At the third nearest swing low
In this example, price sweeps a swing high, has a V shape recovery, and forms a bearish IFVG:
🔹 Long Setup – A+ Rating
A long A+ setup forms when the four core requirements of the IFVG Model occur and exactly one additional confluence is present. Price must sweep a Sellside Liquidity level, form a valid V shape recovery, and create a bullish IFVG by invalidating a bearish FVG. One of the following must also occur: a bullish HTF FVG tap during the liquidity sweep, a multi-sellside liquidity sweep, or the IFVG confirmation forms inside a macro window.
For a confirmed long A+ signal, the indicator marks:
Entry: At the candle close that creates the bullish IFVG
Stop Loss: At the nearest swing low
Breakeven: Midpoint between entry and stop-loss
Take Profit 1: At the second nearest swing high
Take Profit 2: At the third nearest swing high
In this example, price sweeps the NY AM Session Low, taps a 30-minute HTF FVG during the sweep, has a V shape recovery, and forms a bullish IFVG:
🔹 Short Setup – A+ Rating
A short A+ setup forms when the four core requirements of the IFVG Model occur and exactly one additional confluence is present. Price must sweep a Buyside Liquidity level, form a valid V shape recovery, and create a bearish IFVG by invalidating a bullish FVG. One of the following must also occur: a bearish HTF FVG tap, a multi-buyside liquidity sweep, or the IFVG confirmation forms inside a macro window.
For a confirmed short A+ signal, the indicator marks:
Entry: At the candle close that creates the bearish IFVG
Stop Loss: At the nearest swing high
Breakeven: Midpoint between entry and stop-loss
Take Profit 1: At the second nearest swing low
Take Profit 2: At the third nearest swing low
In this example, price sweeps a swing high, has a V shape recovery, and forms a bearish IFVG inside of the 13:50-14:10 macro:
🔹 Long Setup – A++ Rating
A long A++ setup forms when the four core requirements of the IFVG Model occur and at least two additional confluences are present. Price must sweep a Sellside Liquidity level, form a valid V shape recovery, and create a bullish IFVG. The setup must also include any two or three of the following: a bullish HTF FVG tap, a multi-sellside liquidity sweep, or the IFVG confirmation forming inside a macro window.
For a confirmed long A++ signal, the indicator marks:
Entry: At the candle close that creates the bullish IFVG
Stop Loss: At the nearest swing low
Breakeven: Midpoint between entry and stop-loss
Take Profit 1: At the second nearest swing high
Take Profit 2: At the third nearest swing high
In this example, price sweeps two swing lows, has a V shape recovery, taps a bullish 30-minute HTF FVG during the liquidity sweep, and forms a bullish IFVG inside of the 10:50-11:10 macro:
🔹 Short Setup – A++ Rating
A short A++ setup forms when the four core requirements of the IFVG Model occur and at least two additional confluences are present. Price must sweep a Buyside Liquidity level, form a valid V shape recovery, and create a bearish IFVG. The setup must also include any two or three of the following: a bearish HTF FVG tap, a multi-buyside liquidity sweep, or the IFVG confirmation forming inside a macro window.
For a confirmed short A++ signal, the indicator marks:
Entry: At the candle close that creates the bearish IFVG
Stop Loss: At the nearest swing high
Breakeven: Midpoint between entry and stop-loss
Take Profit 1: At the second nearest swing low
Take Profit 2: At the third nearest swing low
In this example, price sweeps a swing high, has a V shape recovery, taps a bearish 30-minute HTF FVG during the liquidity sweep, and forms a bearish IFVG inside of the 09:50-10:10 macro:
🔹Signal Settings
◇ Liquidity Levels Used:
Users can select which type of liquidity levels the indicator uses for identifying liquidity sweeps:
Swing Points: Only uses Swing Highs/Lows
Session Highs/Lows: Only uses Session Highs/Lows
Both: Uses both Swing Highs/Lows and Session Highs/Lows
◇ Bias:
This setting determines which signal directions are allowed.
Manual Bias: Users can manually choose the directional bias, picking between Bullish, Bearish, or Both.
Automatic Bias: The indicator automatically determines a directional bias based on the criteria mentioned in the previous Bias section.
◇ IFVG Sensitivity:
This setting determines the minimum gap size required for an FVG to qualify as an Inversion FVG.
Higher values: only larger FVGs become IFVGs
Lower values: smaller gaps are allowed
◇ Use First Presented IFVG:
This setting determines whether the indicator limits signals to only the first IFVG created within the manipulation leg.
What Is the First Presented IFVG?
It is the earliest FVG formed inside the displacement that causes the liquidity sweep.
For a bearish manipulation leg (price moving downward into the sweep), the first presented IFVG is the first FVG created at the start of that downward move:
For a bullish manipulation leg (price moving upward into the sweep), the first presented IFVG is the first FVG created at the start of that upward move:
When this setting is enabled, the indicator will only confirm signals when the IFVG used is derived from this first presented FVG. IFVGs that form later in the manipulation leg are not used for signal generation.
◇ Only Take Trades:
This setting allows users to restrict signals to a defined time window.
If a complete setup occurs inside the time window, it is allowed and plotted
If it occurs outside the window, the signal will not appear
For example, if you only wanted to see long/short signals between 9:30 AM and 12:00 PM, you would enable this setting and set the time window from 09:30 - 12:00.
◇ Minimum R:R
This setting allows users to require a minimum risk-to-reward ratio before a signal is confirmed and plotted on the chart. The risk-to-reward ratio is calculated using the distance from the Entry to the Stop-Loss (risk) and the distance from the Entry to TP2 (reward). The indicator compares these distances and determines whether the setup meets or exceeds the minimum R:R value selected by the user.
If the calculated R:R is equal to or greater than the chosen threshold, the signal will be displayed.
If the calculated R:R is lower than the threshold, the signal will not appear on the chart.
🔹 Signal Rating Minimum
Users can restrict which signal ratings appear:
A: shows all signals
A+: shows only A+ and A++
A++: shows only A++ setups
🔹 Signal Styling and Customization
The indicator provides full control over how signal labels and levels appear on your chart. Users can customize long signals, short signals, all plotted lines, and the visibility of every individual element.
◇ Long Signal Styling
Users can customize:
Long Signal Label Color
Long Signal Text Color
Long Signal Label Size
◇ Short Signal Styling
Users can customize:
Short Signal Label Color
Short Signal Text Color
Short Signal Label Size
◇ Entry, Stop Loss, Breakeven, and Take Profit Lines
Each line type can be enabled or disabled individually:
Entry Line
Stop Loss Line
Breakeven Line
Take Profit 1 & 2 Lines
Users can also set custom colors for each line so every level is easy to track during live price movement.
◇ Show Price Labels
Price labels can be toggled on or off individually for each level. Users can choose whether to show or hide the price for:
Entry
Stop loss
Breakeven
Take Profit 1 & 2
NEW DAY OPENING GAP:
The New Day Opening Gap (NDOG) highlights the price difference between the previous day’s closing candle and the first candle of the new trading day. The indicator tracks this gap automatically each day and makes it available as optional context for users.
🔹 What Is the New Day Opening Gap?
A New Day Opening Gap forms when the trading day opens at a price different from the previous day’s final closing price.
If the new day opens above the prior day’s close → Bullish NDOG
If the new day opens below the prior day’s close → Bearish NDOG
This gap acts as a short-term draw on liquidity because the market may revisit the gap to rebalance price delivery. While the NDOG is not a required component for IFVG signals.
🔹 How the Indicator Uses the New Day Opening Gap
When enabled, the indicator plots the gap as a rectangular zone spanning from the previous day’s close to the new day’s open. The zone remains active until it is fully filled by price or until the next day’s opening gap forms. Once price trades through the entire gap, or once a new NDOG replaces it the following day, the zone becomes inactive and is removed from the chart. The indicator does not use the NDOG for signal generation. It is strictly a visual tool that helps traders identify areas where price may retrace or seek liquidity during the session.
🔹 Customization Options
Users have full control over how the New Day Opening Gap displays on the chart:
Show New Day Opening Gap: Toggle the NDOG zone on or off
Bullish NDOG Color: Customize the fill color for gaps formed above the prior close
Bearish NDOG Color: Customize the fill color for gaps formed below the prior close
NEW WEEK OPENING GAP:
The New Week Opening Gap (NWOG) highlights the price difference between the previous week’s final closing candle and the first candle of the new trading week. The indicator tracks this gap automatically each week and provides it as optional context for users.
🔹 What Is the New Week Opening Gap?
A New Week Opening Gap forms when the new trading week opens at a price different from the previous week’s closing price.
If the new week opens above the prior week’s close → Bullish NWOG
If the new week opens below the prior week’s close → Bearish NWOG
This gap often serves as a medium-term draw on liquidity because price may return to rebalance the weekly displacement. The NWOG is not a required component for IFVG signals.
🔹 How the Indicator Uses the New Week Opening Gap
When enabled, the indicator plots the gap as a rectangular zone spanning from the previous week’s close to the new week’s open. The zone remains active until it is fully filled by price or until the next week’s opening gap forms. Once price trades through the entire gap, or once a new NWOG replaces it the following week, the zone becomes inactive and is removed from the chart. The indicator does not use the NWOG for signal generation. It is purely a visual reference to help traders identify areas where price may rebalance or seek liquidity during the week.
🔹 Customization Options
Users have full control over how the New Week Opening Gap displays on the chart:
Show New Week Opening Gap: Toggle the NWOG zone on or off
Bullish NWOG Color: Set the fill color for gaps formed above the prior weekly close
Bearish NWOG Color: Set the fill color for gaps formed below the prior weekly close
SMT DIVERGENCES:
The indicator automatically marks SMT Divergences that occur between the current selected chart ticker and a second user-selected ticker.
A SMT Divergence forms when the prices of the currently selected chart ticker and the user-selected ticker don’t follow each other. For example, if the current chart’s ticker symbol is SEED_ALEXDRAYM_SHORTINTEREST2:NQ and the user-selected ticker is $ES. If SEED_ALEXDRAYM_SHORTINTEREST2:NQ does not sweep the low of the NY AM Session, but NYSE:ES sweeps that same exact session’s low during the same candle, then a SMT Divergence is detected.
In the images below, SEED_ALEXDRAYM_SHORTINTEREST2:NQ and NYSE:ES form a low at 12:20 AM on November 12th. At 12:35 AM, the 12:20 AM low is taken out on $NQ. However, on NYSE:ES , price failed to take out this exact low at 12:35 AM. Thus, an SMT Divergence is detected, and a line is drawn between the two lows on $NQ.
NYSE:ES Chart:
SEED_ALEXDRAYM_SHORTINTEREST2:NQ Chart:
🔹 SMT Divergence Settings
The indicator includes settings that allow users to control how SMT Divergences are detected and displayed.
◇ Length
Length controls how sensitive the pivot detection is when finding highs and lows for SMT.
Lower Length: confirms swings with fewer bars, so more swings qualify.
Higher Length: requires more bars to confirm a swing, so fewer swings qualify.
◇ Divergence Length
The Divergence Length setting defines how many bars apart the two swing points may be for them to count as part of the same SMT Divergence.
Higher Values: The two instruments can form their swing highs or lows farther apart in time. As long as both swings occur within this wider bar window, the indicator compares them for divergence.
Lower Values: The two swing points must occur very close to each other.
◇ Show Last
This setting limits how many recent SMT Divergences are displayed on the chart. For example, setting Show Last to 1 will only show the most recent SMT Divergence, while higher values allow more historical SMT Divergences to remain visible on the chart.
◇ Divergence Ticker
Users can change the ticker used for detections. Since SMT Divergences occur by comparing two tickers, the inputted ticker within the settings will always be compared to the current selected ticker on your chart.
DASHBOARD:
The dashboard provides a live summary of all major components of the Inversion Fair Value Gap Model. It updates every candle and displays the current state of each requirement used in the setup logic.
🔹 Real-Time Model Components
The state of each component is displayed with the following:
✔️ = condition is satisfied
❌ = condition is not satisfied
🐂 / 🐻 = current directional bias (bullish or bearish)
The dashboard actively tracks the following:
◇ Bias (🐂 Bullish, 🐻 Bearish, or Both)
Shows the current bias with a bull or bear emoji. If using automatic bias, the dashboard updates as soon as the session logic determines a direction.
◇ Liquidity Sweep
Displays ✔️ once a valid BSL Sweep (for shorts) or SSL Sweep (for longs) is detected.
Shows ❌ when no sweep is present.
◇ V Shape Recovery
Displays ✔️ when a confirmed V shape recovery forms after the sweep.
Shows ❌ until a valid V shape appears.
◇ Inversion Fair Value Gap (IFVG)
Shows ✔️ once a bullish or bearish IFVG forms in the correct direction.
Shows ❌ when no IFVG has yet confirmed.
◇ Higher-Timeframe FVG Interaction
Displays ✔️ when price is currently inside any enabled HTF FVG or taps a HTF FVG during a liquidity sweep.
Displays ❌ when price is not inside a HTF imbalance.
◇ Clear Opposite Draw on Liquidity (DOL)
Shows ✔️ when a clear opposite-side draw is present in the model logic.
Shows ❌ if no clear opposite draw is detected.
◇ SMT Divergence
Shows ✔️ for 20 candles immediately after an SMT Divergence forms.
After 20 candles, it returns to ❌ unless a new SMT Divergence is detected.
🔹 Signal Information Display
When a valid long or short signal appears, the dashboard expands to show the full details of the setup, including:
Signal Rating
Entry Price
Stop-Loss Price
Breakeven Price
Take Profit 1 Price
Take Profit 2 Price
🔹 Trade Statistics Module
Users can enable a built-in statistics panel to view historical performance of signals across all ratings. The trade stats include:
A Signal Win Rate
A+ Signal Win Rate
A++ Signal Win Rate
Long Signal Win Rate
Short Signal Win Rate
Total Number of Trades Used in the Calculations
A trade is counted as a win if price reaches breakeven before stop-loss. A trade is counted as a loss if price hits stop-loss before breakeven.
🔹 Dashboard Customization
The dashboard includes several options to control its appearance and position:
Show Dashboard: Toggle the entire dashboard on or off
Dashboard Size: Choose the size of the dashboard
Dashboard Position: Choose the location of the dashboard on the chart
Trade Stats Text Color: Customize the color of the 2nd column outputs under the Trade Stats section in the dashboard
◇ Component Toggles
Users can enable or disable the display of any model component based on preference. Each of these items can be shown or hidden independently:
Setup Rating
Entry
Stop-Loss
Breakeven
Take Profit 1
Take Profit 2
Bias
Liquidity Sweep
Higher-Timeframe FVG Interaction
V Shape Recovery
Inversion FVG
Clear Opposite Draw on Liquidity
Trade Stats
These toggles only affect visual display. Disabling any of them does not affect the underlying indicator’s logic.
ALERTS:
The Inversion Fair Value Gap Model includes full alert functionality using AnyAlert(), allowing users to receive notifications in real time for all major model components and signal events.
Users can enable or disable each alert type in the “Alerts” section of the settings. After selecting which alerts they want active, they can create a single TradingView alert using the AnyAlert() condition. This will automatically trigger alerts for all enabled events as soon as they occur on the chart.
Available Alerts:
Long Signal
Short Signal
Breakeven Hit (BE)
Take Profit 1 Hit (TP1)
Take Profit 2 Hit (TP2)
Stop-Loss Hit (SL)
Liquidity Sweep Detected
SMT Divergence Detected
How to Receive Alerts:
Open the TradingView alert creation window.
Select the IFVG Model indicator as the alert condition.
Choose AnyAlert() from the condition dropdown.
Create the alert.
IMPORTANT NOTES:
TradingView has limitations when running features on multiple timeframes such as the HTF FVGs, which can result in the following restriction:
Computation Error:
The computation of using MTF features is very intensive on TradingView. This can sometimes cause calculation timeouts. When this occurs, simply force the recalculation by modifying one indicator’s settings or by removing the indicator and adding it to your chart again.
UNIQUENESS:
This indicator is unique because it organizes every part of the Inversion Fair Value Gap Model into one structured, rules based system. It detects liquidity sweeps, confirms V shape recoveries, identifies valid IFVGs, checks higher timeframe FVG taps, reads macro timing, and applies a session based directional bias. All of these components are evaluated in a fixed sequence so users always know exactly why a signal appears. Every part of the logic is customizable, including which liquidity types are used, which IFVGs qualify for signals, which time windows allow trades, the minimum risk to reward for a setup, and all visual elements on the chart. The tool also includes optional SMT Divergence detection, daily and weekly opening gaps, a live dashboard that shows the state of each model requirement, and optional signal performance statistics.

Atif's Liquidity Toolkit💎 GENERAL OVERVIEW:
Atif’s Liquidity Toolkit is a price-action-based indicator used to identify Buyside & Sellside Liquidity Levels, Liquidity Sweeps, FVG Sweeps, and Buy/Sell signals, following specific rules from Atif Hussain.
This indicator was developed by Flux Charts in collaboration with Atif Hussain.
🔹Purpose of this indicator:
The purpose of Atif’s Liquidity Toolkit is to help traders understand where liquidity is forming, when it’s being taken, and how momentum shifts immediately afterward. It automates the entire process of identifying buyside & sellside liquidity, detecting liquidity sweeps, and confirming whether displacement followed through a Fair Value Gap. The goal is to give traders a consistent, rule-based framework to interpret market structure.
🎯ATIF’S LIQUIDITY TOOLKIT FEATURES:
Atif’s Liquidity Toolkit indicator includes 6 main features:
Fair Value Gaps
Multi-Timeframe Liquidity Levels
Liquidity Sweeps
Fair Value Gap Sweeps
Buy & Sell Signals with Take-Profit & Stop-Loss Levels
Alerts
1️⃣Fair Value Gaps
🔹What is a Fair Value Gap?:
A Fair Value Gap (FVG) is an area where the market’s perception of fair value suddenly changes. On your chart, it appears as a three-candle pattern: a large candle in the middle, with smaller candles on each side that don’t fully overlap it. A bullish FVG forms when a bullish candle is between two smaller bullish/bearish candles, where the first and third candles’ wicks don’t overlap each other at all. A bearish FVG forms when a bearish candle is between two smaller bullish/bearish candles, where the first and third candles’ wicks don’t overlap each other at all.
Bullish & Bearish FVGs:
In the settings, you can toggle on/off FVGs, choose the invalidation method, adjust the sensitivity, and toggle on FVG Midline & Labels.
🔹Invalidation Method:
The Invalidation Method setting allows traders to choose how an FVG is invalidated. You can choose between Close and Wick.
Close: A candle must close below a bullish FVG or above a bearish FVG to invalidate it.
Wick: A candle’s wick must go below a bullish FVG or above a bearish FVG to invalidate it.
🔹Sensitivity:
The sensitivity setting determines the minimum gap size required for an FVG detection. A higher sensitivity will filter out smaller gaps, while a lower sensitivity will detect more frequent, smaller gaps. Setting the sensitivity to 0 will display all gaps, regardless of their size.
On the left, the sensitivity is 5. On the right, the sensitivity is 0.
🔹Midline:
When enabled, a dashed line is drawn at the center of the FVG.
🔹Labels:
When enabled, a text label will be plotted with the gap, clearly identifying the zone as a FVG.
2️⃣ Multi-Timeframe Liquidity Levels
The indicator automatically detects and plots Buyside Liquidity (BSL) & Sellside Liquidity (SSL) Levels across up to three timeframes simultaneously.
🔹What is Buyside Liquidity?
Buyside Liquidity (BSL) represents price levels where many buy stop orders are sitting, usually from traders holding short positions. When price moves into these areas, those stop-loss orders get triggered and short sellers are forced to buy back their positions. These zones often form above key highs such as the previous day, week, or month. Understanding BSL is important because when price reaches these levels, the sudden wave of buy orders can create sharp reactions or reversals as liquidity is taken from the market.
🔹What is Sellside Liquidity?
Sellside Liquidity (SSL) represents price levels where many sell stop orders are waiting, usually from traders holding long positions. When price drops into these areas, those stop-loss orders are triggered and long traders are forced to sell their positions. These zones often form below key lows such as the previous day, week, or month. Understanding SSL is important because when price reaches these levels, the surge of sell orders can cause sharp reactions or reversals as liquidity is taken from the market.
Atif’s Liquidity Toolkit indicator automatically plots Buyside & Sellside Liquidity levels using the following levels:
Previous Day High (PDH) & Previous Day Low (PDL)
Previous Week High (PWH) & Previous Week Low (PWL)
Previous Month High (PMH) & Previous Month Low (PML)
Asia Session Highs/Lows
London Session Highs/Lows
New York Session Highs/Lows
The session start and end times are not customizable. The following times in EST are used for each session:
Asia Session: 20:00-00:00
London Session: 02:00-05:00
New York Sessions:
NY AM: 09:30-11:00
NY Lunch: 12:00-13:00
NY PM: 14:00-16:00
Users can also plot swing highs/lows using a lookback period and choosing the higher timeframe. Users can choose two custom higher timeframes and also enable swing highs/lows from the current chart’s timeframe.
There are three settings to customize for the current chart’s timeframe and higher timeframes:
Current TF - when toggled on, swing highs/lows will be plotted from the chart’s timeframe using the pivot length input
HTF 1 - when toggled on, swing highs/lows will be plotted from the user-inputted timeframe using the pivot length input
HTF 2 - when toggled on, swing highs/lows will be plotted from the user-inputted timeframe using the pivot length input
The Pivot Length controls how far back the indicator checks to confirm whether a candle’s high or low is a true swing point (also called a “pivot”). When detecting a swing high, the indicator checks if that candle’s high is higher than the highs of the previous X candles and the next X candles. For a swing low, it checks if the candle’s low is lower than the lows of the previous X candles and the next X candles. The number X comes from your Pivot Length setting.
A lower Pivot Length input (for example, 3 or 4) means the indicator only looks at a few candles on each side, so it will detect more swing points, including smaller, less significant ones. A higher Pivot Length input (for example, 20 or 25) makes the indicator look at more candles on each side, so it only marks major turning points that stand out clearly on the chart.
In short:
Low Pivot Length = more frequent, smaller levels (short-term focus)
High Pivot Length = fewer, stronger levels (major swing focus)
The Pivot Length input for each setting (Current TF, HTF 1, and HTF 2) are displayed below in the red boxes:
Each liquidity level is plotted with a text label, making it easy to identify where a level came from. You can turn off the ‘Show Levels’ setting if you don’t want to see the levels on your chart.
Please note: Liquidity Levels play a key role in finding liquidity sweeps, FVG Sweeps, and Buy/Sell signals. Keeping the levels turned off will not stop the indicator from using the levels that are enabled from being used for the other features mentioned.
3️⃣Liquidity Sweeps:
The indicator automatically detects bullish and bearish liquidity sweeps using the liquidity levels you have enabled.
🔹What is a Liquidity Sweep?
A liquidity sweep is a market phenomenon where significant players, such as institutional traders, deliberately drive prices through key levels to trigger clusters of pending buy or sell orders. It’s how the market gathers the liquidity needed for larger participants to enter positions.
Traders often place stop-loss orders around obvious highs and lows, such as the previous day’s, week’s, or month’s levels. When price pushes through one of these areas, it triggers the stops placed there and generates a burst of volume. This often creates a short-term fake-out before the market reverses in the opposite direction.
By detecting these sweeps in real time, traders can identify potential reversal areas or “trap” areas where liquidity has been taken.
🔹Bullish Liquidity Sweep
These occur when price dips below a Sellside Liquidity (SSL) level, taking out the stop-loss orders placed by long traders below that low. The indicator marks a zone around the candle that swept the SSL to highlight where liquidity was removed from the market.
When this happens, it shows that the market just cleared out sell-side liquidity, meaning traders who were long had their stops hit. This is often followed by a reversal or strong reaction upward, because the market no longer has pending liquidity to fill below that level.
🔹Bearish Liquidity Sweep
These occur when price dips above a Buyside Liquidity (BSL) level, taking out the stop-loss orders placed by short seller traders above that high. The indicator marks a zone around the candle that swept the BSL to highlight where liquidity was removed from the market.
When this happens, it shows that the market just cleared out buyside liquidity, meaning short traders had their stops hit. This is often followed by a reversal or strong reaction downward, because the market no longer has pending liquidity to fill above that level.
Under the ‘Liquidity Sweeps’ section in the settings, you can toggle on/off Bullish Regular Sweeps and Bearish Regular Sweeps. You can also customize the line style and color of liquidity levels that have been swept.
🔹How to Use Liquidity Sweeps
Liquidity sweeps are not direct trade signals. They are best used as context when forming a directional bias. A sweep shows that the market has removed liquidity from one side, which can hint at where the next move may develop.
For example:
When Buyside Liquidity (BSL) is swept, it often signals that buy stops have been triggered and the market may be preparing to move lower. Traders may then begin looking for short opportunities.
When Sellside Liquidity (SSL) is swept, it often signals that sell stops have been triggered and the market may be preparing to move higher. Traders may then begin looking for long opportunities.
It’s common practice to use liquidity sweeps as the first step in building a trade idea. Many traders will wait for additional confirmation, such as a fair value gap forming after the sweep, before opening a position.
Under the ‘Liquidity Sweeps’ section in the settings, you can toggle on/off:
Bullish Regular Sweeps - when disabled, Bullish Regular Sweeps won’t appear on your chart.
Bearish Regular Sweeps - when disabled, Bearish Regular Sweeps won’t appear on your chart.
4️⃣Fair Value Gap Sweeps:
The indicator automatically detects bullish and bearish Fair Value Gap sweeps (FVG Sweep) using the liquidity levels you have enabled.
🔹What is a FVG Sweep?
A FVG Sweep is a specific type of liquidity sweep that not only clears liquidity above or below a key level, but also forms a Fair Value Gap (FVG) immediately afterward.
The liquidity sweep shows where stop orders were triggered, areas where the market aggressively took out one side’s liquidity. The formation of a Fair Value Gap right after the sweep confirms that displacement followed. This means that the sweep was not just a stop hunt, but a deliberate move backed by momentum.
In simple terms, a regular liquidity sweep only tells you that liquidity was taken. A FVG Sweep tells you that liquidity was taken and a strong directional move started immediately after, leaving an imbalance in price. That imbalance represents where aggressive buyers or sellers entered the market without enough opposite-side orders to keep price balanced. This combination adds a confirmation and intent behind regular liquidity sweeps.
🔹Bullish FVG Sweep
The indicator automatically detects bullish FVG Sweeps when price takes out a Sellside Liquidity (SSL) level and then forms a bullish FVG within the next few candles. This sequence shows that sellers were stopped out and buyers immediately entered the market with momentum.
🔹Bearish FVG Sweep
The indicator automatically detects bearish FVG Sweeps when price takes out a Buyside Liquidity (BSL) level and then forms a bearish FVG shortly after. This shows that short sellers’ stops were triggered, and new selling pressure entered the market right away.
🔹How to Use FVG Sweeps
Unlike regular liquidity sweeps, FVG Sweeps can be used as trade entries because they confirm both liquidity being cleared and immediate momentum. A regular sweep only shows that stop-losses were triggered, but an FVG Sweep proves that price not only cleared liquidity but also moved away with momentum, leaving behind an imbalance (Fair Value Gap). This shift often marks the start of a new short-term trend.
We’ll cover this in more detail in the Buy and Sell Signal section below, but in short, a bullish FVG Sweep can act as confirmation for a potential long entry after price takes out a low, while a bearish FVG Sweep can confirm a short entry after price takes out a high.
The strongest FVG Sweeps come from extremely sharp reversals. On the chart, they look like a “V” shape for bullish setups or an inverted “V” shape for bearish setups. This shape shows how quickly momentum shifted after liquidity was cleared. When price instantly reverses and leaves a Fair Value Gap behind, it’s a clear sign that buyers or sellers stepped in aggressively and absorbed all available liquidity on the opposite side.
In practice, traders often use FVG Sweeps as a trigger to align their bias. For example, after a bullish FVG Sweep, the focus shifts toward looking for long setups within the new imbalance or during a small retracement into the Fair Value Gap. After a bearish FVG Sweep, traders focus on short setups as price retraces back into the gap before continuing lower. The key takeaway is that FVG Sweeps show conviction.
Under the ‘Liquidity Sweeps’ section in the settings, you can toggle on/off:
Bullish FVG Sweeps - when disabled, Bullish FVG Sweeps won’t appear on your chart.
Bearish FVG Sweeps - when disabled, Bearish FVG Sweeps won’t appear on your chart.
Please Note: the settings you choose to use for Fair Value Gaps, under the ‘Fair Value Gaps’ section, will be used for FVG Sweeps. This is important because if you increase the sensitivity value for FVGs, not all FVG Sweeps will appear if the FVG’s size doesn’t meet the sensitivity threshold.
5️⃣Buy & Sell Signals:
This indicator also plots Buy & Sell signals. These signals follow logic based on Atif Hussain’s FVG trading model. The entry requirements for a Long & Short signal are outlined below.
🔹Buy Signal:
In order for a Buy Signal to generate, the following conditions must occur in order:
Bullish FVG Sweep
Price Retraces to the Bullish FVG
🔹Sell Signal:
In order for a Buy Signal to generate, the following conditions must occur in order:
Bearish FVG Sweep
Price Retraces to the FVG
🔹Require Retracement:
Under the ‘Signals’ section in the settings, you can toggle on/off the ‘Require Retracement’ setting. When disabled, a long/short signal will appear immediately after a Bullish or Bearish FVG Sweep, instead of waiting for price to retrace back to the gap.
Please Note: the liquidity levels you enable under the ‘Liquidity Levels’ section will be the levels used for signals. Thus, if you only have the Previous Day Highs/Lows enabled, then only those levels will be used to generate buy/sell signals. Also, long Signals will only appear if Bullish FVG Sweeps are enabled, and Short Signals will only appear if Bearish FVG Sweeps are enabled.
When a Buy Signal or Sell Signal is plotted, three suggested take-profit levels and one suggested stop-loss level are plotted. There are two different Take-Profit methods you can choose from within the indicator settings: Manual or Auto.
🔹Manual Take-Profit:
If you’re using manual take-profit levels, you can customize the Risk-to-Reward (RR) for Take-Profit 1, 2, and 3 by adjusting the “RR 1”, “RR 2”, and “RR 3” settings. Setting RR 1 to 1 means take-profit 1 is a 1:1 risk-to-reward ratio. The stop-loss will always be placed at the recent low for Buy Signals, and at the recent high for Sell Signals.
🔹Auto Take-Profit:
If you select to use Auto Take-Profit instead of Manual, then Take-Profit 1, 2, and 3 will be automatically determined based on nearby liquidity levels. The stop-loss will be placed at the recent low for Buy Signals, and at the recent high for Sell Signals. Take-Profit Levels 1, 2, and 3 will be placed at the three closest opposite liquidity levels. If the take-profit 2 and take-profit 3 levels are too far away, only one take-profit level will be displayed.
🔹Signal Settings:
Long Signals:
When enabled, long signals are shown. When disabled, long signals will not appear.
Short Signals:
When enabled, short signals are shown. When disabled, short signals will not appear.
Require Retracement:
When enabled, price must retrace to a FVG after a FVG Sweep in order for a signal to be generated.
Take-Profit Levels:
When enabled, take-profit levels (TP 1, TP 2, and TP 3) are shown with long/short signals. When disabled, take-profit levels and their price labels are not displayed.
Take-Profit Labels:
When enabled, take-profit labels are displayed when price reaches one of the three take-profit levels. When disabled, labels won’t appear when price reaches take-profit levels.
Stop-Loss Levels:
When enabled, stop-loss levels are shown for long/short signals. When disabled, the stop-loss level and its price label are not displayed.
Stop-Loss Labels:
When enabled, stop-loss levels are shown for long/short signals. When disabled, a label won’t appear when price reaches the stop-loss level.
6️⃣Alerts:
The indicator supports alerts, so you never miss a key market move. You can choose to receive alerts for each of the following conditions:
Bearish Liquidity Sweep
Bullish Liquidity Sweep
Bearish FVG Sweep
Bullish FVG Sweep
Long Signal
Short Signal
TP 1
TP 2
TP 3
Stop-Loss
‼️Important Notes:
TradingView has limitations when running features on multiple timeframes, such as the liquidity levels, which can result in the following error:
🔹Computation Error:
The computation of using MTF features are very intensive on TradingView. This can sometimes cause calculation timeouts. When this occurs, simply force the recalculation by modifying one indicator’s settings or by removing the indicator and adding it to your chart again.
🚩 UNIQUENESS:
This indicator is unique because it identifies a specific type of liquidity event referred to as FVG Sweeps, where price takes liquidity and then immediately forms a Fair Value Gap in the opposite direction. These FVG Sweeps serve as the foundation of the model, and the script uses them as the required condition for generating Buy and Sell signals. Once an FVG Sweep is confirmed, the indicator automatically produces a fully defined trade idea with a stop-loss and up to three take-profit targets, following a consistent rule-based execution approach.

FvgObject█ OVERVIEW
This library provides a suite of methods designed to manage the visual representation and lifecycle of Fair Value Gap (FVG) objects on a Pine Script™ chart. It extends the `fvgObject` User-Defined Type (UDT) by attaching object-oriented functionalities for drawing, updating, and deleting FVG-related graphical elements. The primary goal is to encapsulate complex drawing logic, making the main indicator script cleaner and more focused on FVG detection and state management.
█ CONCEPTS
This library is built around the idea of treating each Fair Value Gap as an "object" with its own visual lifecycle on the chart. This is achieved by defining methods that operate directly on instances of the `fvgObject` UDT.
Object-Oriented Approach for FVGs
Pine Script™ v6 introduced the ability to define methods for User-Defined Types (UDTs). This library leverages this feature by attaching specific drawing and state management functions (methods) directly to the `fvgObject` type. This means that instead of calling global functions with an FVG object as a parameter, you call methods *on* the FVG object itself (e.g., `myFvg.updateDrawings(...)`). This approach promotes better code organization and a more intuitive way to interact with FVG data.
FVG Visual Lifecycle Management
The core purpose of this library is to manage the complete visual journey of an FVG on the chart. This lifecycle includes:
Initial Drawing: Creating the first visual representation of a newly detected FVG, including its main box and optionally its midline and labels.
State Updates & Partial Fills: Modifying the FVG's appearance as it gets partially filled by price. This involves drawing a "mitigated" portion of the box and adjusting the `currentTop` or `currentBottom` of the remaining FVG.
Full Mitigation & Tested State: Handling how an FVG is displayed once fully mitigated. Depending on user settings, it might be hidden, or its box might change color/style to indicate it has been "tested." Mitigation lines can also be managed (kept or deleted).
Midline Interaction: Visually tracking if the price has touched the FVG's 50% equilibrium level (midline).
Visibility Control: Dynamically showing or hiding FVG drawings based on various criteria, such as user settings (e.g., hide mitigated FVGs, timeframe-specific visibility) or external filters (e.g., proximity to current price).
Deletion: Cleaning up all drawing objects associated with an FVG when it's no longer needed or when settings dictate its removal.
Centralized Drawing Logic
By encapsulating all drawing-related operations within the methods of this library, the main indicator script is significantly simplified. The main script can focus on detecting FVGs and managing their state (e.g., in arrays), while delegating the complex task of rendering and updating them on the chart to the methods herein.
Interaction with `fvgObject` and `drawSettings` UDTs
All methods within this library operate on an instance of the `fvgObject` UDT. This `fvgObject` holds not only the FVG's price/time data and state (like `isMitigated`, `currentTop`) but also the IDs of its associated drawing elements (e.g., `boxId`, `midLineId`).
The appearance of these drawings (colors, styles, visibility, etc.) is dictated by a `drawSettings` UDT instance, which is passed as a parameter to most drawing-related methods. This `drawSettings` object is typically populated from user inputs in the main script, allowing for extensive customization.
Stateful Drawing Object Management
The library's methods manage Pine Script™ drawing objects (boxes, lines, labels) by storing their IDs within the `fvgObject` itself (e.g., `fvgObject.boxId`, `fvgObject.mitigatedBoxId`, etc.). Methods like `draw()` create these objects and store their IDs, while methods like `updateDrawings()` modify them, and `deleteDrawings()` removes them using these stored IDs.
Drawing Optimization
The `updateDrawings()` method, which is the most comprehensive drawing management function, incorporates optimization logic. It uses `prev_*` fields within the `fvgObject` (e.g., `prevIsMitigated`, `prevCurrentTop`) to store the FVG's state from the previous bar. By comparing the current state with the previous state, and also considering changes in visibility or relevant drawing settings, it can avoid redundant and performance-intensive drawing operations if nothing visually significant has changed for that FVG.
█ METHOD USAGE AND WORKFLOW
The methods in this library are designed to be called in a logical sequence as an FVG progresses through its lifecycle. A crucial prerequisite for all visual methods in this library is a properly populated `drawSettings` UDT instance, which dictates every aspect of an FVG's appearance, from colors and styles to visibility and labels. This `settings` object must be carefully prepared in the main indicator script, typically based on user inputs, before being passed to these methods.
Here’s a typical workflow within a main indicator script:
1. FVG Instance Creation (External to this library)
An `fvgObject` instance is typically created by functions in another library (e.g., `FvgCalculations`) when a new FVG pattern is identified. This object will have its core properties (top, bottom, startTime, isBullish, tfType) initialized.
2. Initial Drawing (`draw` method)
Once a new `fvgObject` is created and its initial visibility is determined:
Call the `myFvg.draw(settings)` method on the new FVG object.
`settings` is an instance of the `drawSettings` UDT, containing all relevant visual configurations.
This method draws the primary FVG box, its midline (if enabled in `settings`), and any initial labels. It also initializes the `currentTop` and `currentBottom` fields of the `fvgObject` if they are `na`, and stores the IDs of the created drawing objects within the `fvgObject`.
3. Per-Bar State Updates & Interaction Checks
On each subsequent bar, for every active `fvgObject`:
Interaction Check (External Logic): It's common to first use logic (e.g., from `FvgCalculations`' `fvgInteractionCheck` function) to determine if the current bar's price interacts with the FVG.
State Field Updates (External Logic): Before calling the `FvgObjectLib` methods below, ensure that your `fvgObject`'s state fields (such as `isMitigated`, `currentTop`, `currentBottom`, `isMidlineTouched`) are updated using the current bar's price data and relevant functions from other libraries (e.g., `FvgCalculations`' `checkMitigation`, `checkPartialMitigation`, etc.). This library's methods render the FVG based on these pre-updated state fields.
If interaction occurs and the FVG is not yet fully mitigated:
Full Mitigation Update (`updateMitigation` method): Call `myFvg.updateMitigation(high, low)`. This method updates `myFvg.isMitigated` and `myFvg.mitigationTime` if full mitigation occurs, based on the interaction determined by external logic.
Partial Fill Update (`updatePartialFill` method): If not fully mitigated, call `myFvg.updatePartialFill(high, low, settings)`. This method updates `myFvg.currentTop` or `myFvg.currentBottom` and adjusts drawings to show the filled portion, again based on prior interaction checks and fill level calculations.
Midline Touch Check (`checkMidlineTouch` method): Call `myFvg.checkMidlineTouch(high, low)`. This method updates `myFvg.isMidlineTouched` if the price touches the FVG's 50% level.
4. Comprehensive Visual Update (`updateDrawings` method)
After the FVG's state fields have been potentially updated by external logic and the methods in step 3:
Call `myFvg.updateDrawings(isVisibleNow, settings)` on each FVG object.
`isVisibleNow` is a boolean indicating if the FVG should currently be visible.
`settings` is the `drawSettings` UDT instance.
This method synchronizes the FVG's visual appearance with its current state and settings, managing all drawing elements (boxes, lines, labels), their styles, and visibility. It efficiently skips redundant drawing operations if the FVG's state or visibility has not changed, thanks to its internal optimization using `prev_*` fields, which are also updated by this method.
5. Deleting Drawings (`deleteDrawings` method)
When an FVG object is no longer tracked:
Call `myFvg.deleteDrawings(deleteTestedToo)`.
This method removes all drawing objects associated with that `fvgObject`.
This workflow ensures that FVG visuals are accurately maintained throughout their existence on the chart.
█ NOTES
Dependencies: This library relies on `FvgTypes` for `fvgObject` and `drawSettings` definitions, and its methods (`updateMitigation`, `updatePartialFill`) internally call functions from `FvgCalculations`.
Drawing Object Management: Be mindful of TradingView's limits on drawing objects per script. The main script should manage the number of active FVG objects.
Performance and `updateDrawings()`: The `updateDrawings()` method is comprehensive. Its internal optimization (checking `hasStateChanged` based on `prev_*` fields) is crucial for performance. Call it judiciously.
Role of `settings.currentTime`: The `currentTime` field in `drawSettings` is key for positioning time-dependent elements like labels and the right edge of non-extended drawings.
Mutability of `fvgObject` Instances: Methods in this library directly modify the `fvgObject` instance they are called upon (e.g., its state fields and drawing IDs).
Drawing ID Checks: Methods generally check if drawing IDs are `na` before acting on them, preventing runtime errors.
█ EXPORTED FUNCTIONS
method draw(this, settings)
Draws the initial visual representation of the FVG object on the chart. This includes the main FVG box, its midline (if enabled), and a label
(if enabled for the specific timeframe). This method is typically invoked
immediately after an FVG is first detected and its initial properties are set. It uses drawing settings to customize the appearance based on the FVG's timeframe type.
Namespace types: types.fvgObject
Parameters:
this (fvgObject type from no1x/FvgTypes/1) : The FVG object instance to be drawn. Core properties (top, bottom,
startTime, isBullish, tfType) should be pre-initialized. This method will
initialize boxId, midLineId, boxLabelId (if applicable), and
currentTop/currentBottom (if currently na) on this object.
settings (drawSettings type from no1x/FvgTypes/1) : A drawSettings object providing all visual parameters. Reads display settings (colors, styles, visibility for boxes, midlines, labels,
box extension) relevant to this.tfType. settings.currentTime is used for
positioning labels and the right boundary of non-extended boxes.
method updateMitigation(this, highVal, lowVal)
Checks if the FVG has been fully mitigated by the current bar's price action.
Namespace types: types.fvgObject
Parameters:
this (fvgObject type from no1x/FvgTypes/1) : The FVG object instance. Reads this.isMitigated, this.isVisible,
this.isBullish, this.top, this.bottom. Updates this.isMitigated and
this.mitigationTime if full mitigation occurs.
highVal (float) : The high price of the current bar, used for mitigation check.
lowVal (float) : The low price of the current bar, used for mitigation check.
method updatePartialFill(this, highVal, lowVal, settings)
Checks for and processes partial fills of the FVG.
Namespace types: types.fvgObject
Parameters:
this (fvgObject type from no1x/FvgTypes/1) : The FVG object instance. Reads this.isMitigated, this.isVisible,
this.isBullish, this.currentTop, this.currentBottom, original this.top/this.bottom,
this.startTime, this.tfType, this.isLV. Updates this.currentTop or
this.currentBottom, creates/updates this.mitigatedBoxId, and may update this.boxId's
top/bottom to reflect the filled portion.
highVal (float) : The high price of the current bar, used for partial fill check.
lowVal (float) : The low price of the current bar, used for partial fill check.
settings (drawSettings type from no1x/FvgTypes/1) : The drawing settings. Reads timeframe-specific colors for mitigated
boxes (e.g., settings.mitigatedBullBoxColor, settings.mitigatedLvBullColor),
box extension settings (settings.shouldExtendBoxes, settings.shouldExtendMtfBoxes, etc.),
and settings.currentTime to style and position the mitigatedBoxId and potentially adjust the main boxId.
method checkMidlineTouch(this, highVal, lowVal)
Checks if the FVG's midline (50% level or Equilibrium) has been touched.
Namespace types: types.fvgObject
Parameters:
this (fvgObject type from no1x/FvgTypes/1) : The FVG object instance. Reads this.midLineId, this.isMidlineTouched,
this.top, this.bottom. Updates this.isMidlineTouched if a touch occurs.
highVal (float) : The high price of the current bar, used for midline touch check.
lowVal (float) : The low price of the current bar, used for midline touch check.
method deleteDrawings(this, deleteTestedToo)
Deletes all visual drawing objects associated with this FVG object.
Namespace types: types.fvgObject
Parameters:
this (fvgObject type from no1x/FvgTypes/1) : The FVG object instance. Deletes drawings referenced by boxId,
mitigatedBoxId, midLineId, mitLineId, boxLabelId, mitLineLabelId,
and potentially testedBoxId, keptMitLineId. Sets these ID fields to na.
deleteTestedToo (simple bool) : If true, also deletes drawings for "tested" FVGs
(i.e., testedBoxId and keptMitLineId).
method updateDrawings(this, isVisibleNow, settings)
Manages the comprehensive update of all visual elements of an FVG object
based on its current state (e.g., active, mitigated, partially filled) and visibility. It handles the drawing, updating, or deletion of FVG boxes (main and mitigated part),
midlines, mitigation lines, and their associated labels. Visibility is determined by the isVisibleNow parameter and relevant settings
(like settings.shouldHideMitigated or timeframe-specific show flags). This method is central to the FVG's visual lifecycle and includes optimization
to avoid redundant drawing operations if the FVG's relevant state or appearance
settings have not changed since the last bar. It also updates the FVG object's internal prev_* state fields for future optimization checks.
Namespace types: types.fvgObject
Parameters:
this (fvgObject type from no1x/FvgTypes/1) : The FVG object instance to update. Reads most state fields (e.g.,
isMitigated, currentTop, tfType, etc.) and updates all drawing ID fields
(boxId, midLineId, etc.), this.isVisible, and all this.prev_* state fields.
isVisibleNow (bool) : A flag indicating whether the FVG should be currently visible. Typically determined by external logic (e.g., visual range filter). Affects
whether active FVG drawings are created/updated or deleted by this method.
settings (drawSettings type from no1x/FvgTypes/1) : A fully populated drawSettings object. This method extensively
reads its fields (colors, styles, visibility toggles, timeframe strings, etc.)
to render FVG components according to this.tfType and current state. settings.currentTime is critical for positioning elements like labels and extending drawings.

Trading IQ - ICT LibraryLibrary "ICTlibrary"
Used to calculate various ICT related price levels and strategies. An ongoing project.
Hello Coders!
This library is meant for sourcing ICT related concepts. While some functions might generate more output than you require, you can specify "Lite Mode" as "true" in applicable functions to slim down necessary inputs.
isLastBar(userTF)
Identifies the last bar on the chart before a timeframe change
Parameters:
userTF (simple int) : the timeframe you wish to calculate the last bar for, must be converted to integer using 'timeframe.in_seconds()'
Returns: bool true if bar on chart is last bar of higher TF, dalse if bar on chart is not last bar of higher TF
necessaryData(atrTF)
returns necessaryData UDT for historical data access
Parameters:
atrTF (float) : user-selected timeframe ATR value.
Returns: logZ. log return Z score, used for calculating order blocks.
method gradBoxes(gradientBoxes, idColor, timeStart, bottom, top, rightCoordinate)
creates neon like effect for box drawings
Namespace types: array
Parameters:
gradientBoxes (array) : an array.new() to store the gradient boxes
idColor (color)
timeStart (int) : left point of box
bottom (float) : bottom of box price point
top (float) : top of box price point
rightCoordinate (int) : right point of box
Returns: void
checkIfTraded(tradeName)
checks if recent trade is of specific name
Parameters:
tradeName (string)
Returns: bool true if recent trade id matches target name, false otherwise
checkIfClosed(tradeName)
checks if recent closed trade is of specific name
Parameters:
tradeName (string)
Returns: bool true if recent closed trade id matches target name, false otherwise
IQZZ(atrMult, finalTF)
custom ZZ to quickly determine market direction.
Parameters:
atrMult (float) : an atr multiplier used to determine the required price move for a ZZ direction change
finalTF (string) : the timeframe used for the atr calcuation
Returns: dir market direction. Up => 1, down => -1
method drawBos(id, startPoint, getKeyPointTime, getKeyPointPrice, col, showBOS, isUp)
calculates and draws Break Of Structure
Namespace types: array
Parameters:
id (array)
startPoint (chart.point)
getKeyPointTime (int) : the actual time of startPoint, simplystartPoint.time
getKeyPointPrice (float) : the actual time of startPoint, simplystartPoint.price
col (color) : color of the BoS line / label
showBOS (bool) : whether to show label/line. This function still calculates internally for other ICT related concepts even if not drawn.
isUp (bool) : whether BoS happened during price increase or price decrease.
Returns: void
method drawMSS(id, startPoint, getKeyPointTime, getKeyPointPrice, col, showMSS, isUp, upRejections, dnRejections, highArr, lowArr, timeArr, closeArr, openArr, atrTFarr, upRejectionsPrices, dnRejectionsPrices)
calculates and draws Market Structure Shift. This data is also used to calculate Rejection Blocks.
Namespace types: array
Parameters:
id (array)
startPoint (chart.point)
getKeyPointTime (int) : the actual time of startPoint, simplystartPoint.time
getKeyPointPrice (float) : the actual time of startPoint, simplystartPoint.price
col (color) : color of the MSS line / label
showMSS (bool) : whether to show label/line. This function still calculates internally for other ICT related concepts even if not drawn.
isUp (bool) : whether MSS happened during price increase or price decrease.
upRejections (array)
dnRejections (array)
highArr (array) : array containing historical highs, should be taken from the UDT "necessaryData" defined above
lowArr (array) : array containing historical lows, should be taken from the UDT "necessaryData" defined above
timeArr (array) : array containing historical times, should be taken from the UDT "necessaryData" defined above
closeArr (array) : array containing historical closes, should be taken from the UDT "necessaryData" defined above
openArr (array) : array containing historical opens, should be taken from the UDT "necessaryData" defined above
atrTFarr (array) : array containing historical atr values (of user-selected TF), should be taken from the UDT "necessaryData" defined above
upRejectionsPrices (array) : array containing up rejections prices. Is sorted and used to determine selective looping for invalidations.
dnRejectionsPrices (array) : array containing down rejections prices. Is sorted and used to determine selective looping for invalidations.
Returns: void
method getTime(id, compare, timeArr)
gets time of inputted price (compare) in an array of data
this is useful when the user-selected timeframe for ICT concepts is greater than the chart's timeframe
Namespace types: array
Parameters:
id (array) : the array of data to search through, to find which index has the same value as "compare"
compare (float) : the target data point to find in the array
timeArr (array) : array of historical times
Returns: the time that the data point in the array was recorded
method OB(id, highArr, signArr, lowArr, timeArr, sign)
store bullish orderblock data
Namespace types: array
Parameters:
id (array)
highArr (array) : array of historical highs
signArr (array) : array of historical price direction "math.sign(close - open)"
lowArr (array) : array of historical lows
timeArr (array) : array of historical times
sign (int) : orderblock direction, -1 => bullish, 1 => bearish
Returns: void
OTEstrat(OTEstart, future, closeArr, highArr, lowArr, timeArr, longOTEPT, longOTESL, longOTElevel, shortOTEPT, shortOTESL, shortOTElevel, structureDirection, oteLongs, atrTF, oteShorts)
executes the OTE strategy
Parameters:
OTEstart (chart.point)
future (int) : future time point for drawings
closeArr (array) : array of historical closes
highArr (array) : array of historical highs
lowArr (array) : array of historical lows
timeArr (array) : array of historical times
longOTEPT (string) : user-selected long OTE profit target, please create an input.string() for this using the example below
longOTESL (int) : user-selected long OTE stop loss, please create an input.string() for this using the example below
longOTElevel (float) : long entry price of selected retracement ratio for OTE
shortOTEPT (string) : user-selected short OTE profit target, please create an input.string() for this using the example below
shortOTESL (int) : user-selected short OTE stop loss, please create an input.string() for this using the example below
shortOTElevel (float) : short entry price of selected retracement ratio for OTE
structureDirection (string) : current market structure direction, this should be "Up" or "Down". This is used to cancel pending orders if market structure changes
oteLongs (bool) : input.bool() for whether OTE longs can be executed
atrTF (float) : atr of the user-seleceted TF
oteShorts (bool) : input.bool() for whether OTE shorts can be executed
@exampleInputs
oteLongs = input.bool(defval = false, title = "OTE Longs", group = "Optimal Trade Entry")
longOTElevel = input.float(defval = 0.79, title = "Long Entry Retracement Level", options = , group = "Optimal Trade Entry")
longOTEPT = input.string(defval = "-0.5", title = "Long TP", options = , group = "Optimal Trade Entry")
longOTESL = input.int(defval = 0, title = "How Many Ticks Below Swing Low For Stop Loss", group = "Optimal Trade Entry")
oteShorts = input.bool(defval = false, title = "OTE Shorts", group = "Optimal Trade Entry")
shortOTElevel = input.float(defval = 0.79, title = "Short Entry Retracement Level", options = , group = "Optimal Trade Entry")
shortOTEPT = input.string(defval = "-0.5", title = "Short TP", options = , group = "Optimal Trade Entry")
shortOTESL = input.int(defval = 0, title = "How Many Ticks Above Swing Low For Stop Loss", group = "Optimal Trade Entry")
Returns: void (0)
displacement(logZ, atrTFreg, highArr, timeArr, lowArr, upDispShow, dnDispShow, masterCoords, labelLevels, dispUpcol, rightCoordinate, dispDncol, noBorders)
calculates and draws dispacements
Parameters:
logZ (float) : log return of current price, used to determine a "significant price move" for a displacement
atrTFreg (float) : atr of user-seleceted timeframe
highArr (array) : array of historical highs
timeArr (array) : array of historical times
lowArr (array) : array of historical lows
upDispShow (int) : amount of historical upside displacements to show
dnDispShow (int) : amount of historical downside displacements to show
masterCoords (map) : a map to push the most recent displacement prices into, useful for having key levels in one data structure
labelLevels (string) : used to determine label placement for the displacement, can be inside box, outside box, or none, example below
dispUpcol (color) : upside displacement color
rightCoordinate (int) : future time for displacement drawing, best is "last_bar_time"
dispDncol (color) : downside displacement color
noBorders (bool) : input.bool() to remove box borders, example below
@exampleInputs
labelLevels = input.string(defval = "Inside" , title = "Box Label Placement", options = )
noBorders = input.bool(defval = false, title = "No Borders On Levels")
Returns: void
method getStrongLow(id, startIndex, timeArr, lowArr, strongLowPoints)
unshift strong low data to array id
Namespace types: array
Parameters:
id (array)
startIndex (int) : the starting index for the timeArr array of the UDT "necessaryData".
this point should start from at least 1 pivot prior to find the low before an upside BoS
timeArr (array) : array of historical times
lowArr (array) : array of historical lows
strongLowPoints (array) : array of strong low prices. Used to retrieve highest strong low price and see if need for
removal of invalidated strong lows
Returns: void
method getStrongHigh(id, startIndex, timeArr, highArr, strongHighPoints)
unshift strong high data to array id
Namespace types: array
Parameters:
id (array)
startIndex (int) : the starting index for the timeArr array of the UDT "necessaryData".
this point should start from at least 1 pivot prior to find the high before a downside BoS
timeArr (array) : array of historical times
highArr (array) : array of historical highs
strongHighPoints (array)
Returns: void
equalLevels(highArr, lowArr, timeArr, rightCoordinate, equalHighsCol, equalLowsCol, liteMode)
used to calculate recent equal highs or equal lows
Parameters:
highArr (array) : array of historical highs
lowArr (array) : array of historical lows
timeArr (array) : array of historical times
rightCoordinate (int) : a future time (right for boxes, x2 for lines)
equalHighsCol (color) : user-selected color for equal highs drawings
equalLowsCol (color) : user-selected color for equal lows drawings
liteMode (bool) : optional for a lite mode version of an ICT strategy. For more control over drawings leave as "True", "False" will apply neon effects
Returns: void
quickTime(timeString)
used to quickly determine if a user-inputted time range is currently active in NYT time
Parameters:
timeString (string) : a time range
Returns: true if session is active, false if session is inactive
macros(showMacros, noBorders)
used to calculate and draw session macros
Parameters:
showMacros (bool) : an input.bool() or simple bool to determine whether to activate the function
noBorders (bool) : an input.bool() to determine whether the box anchored to the session should have borders
Returns: void
po3(tf, left, right, show)
use to calculate HTF po3 candle
@tip only call this function on "barstate.islast"
Parameters:
tf (simple string)
left (int) : the left point of the candle, calculated as bar_index + left,
right (int) : :the right point of the candle, calculated as bar_index + right,
show (bool) : input.bool() whether to show the po3 candle or not
Returns: void
silverBullet(silverBulletStratLong, silverBulletStratShort, future, userTF, H, L, H2, L2, noBorders, silverBulletLongTP, historicalPoints, historicalData, silverBulletLongSL, silverBulletShortTP, silverBulletShortSL)
used to execute the Silver Bullet Strategy
Parameters:
silverBulletStratLong (simple bool)
silverBulletStratShort (simple bool)
future (int) : a future time, used for drawings, example "last_bar_time"
userTF (simple int)
H (float) : the high price of the user-selected TF
L (float) : the low price of the user-selected TF
H2 (float) : the high price of the user-selected TF
L2 (float) : the low price of the user-selected TF
noBorders (bool) : an input.bool() used to remove the borders from box drawings
silverBulletLongTP (series silverBulletLevels)
historicalPoints (array)
historicalData (necessaryData)
silverBulletLongSL (series silverBulletLevels)
silverBulletShortTP (series silverBulletLevels)
silverBulletShortSL (series silverBulletLevels)
Returns: void
method invalidFVGcheck(FVGarr, upFVGpricesSorted, dnFVGpricesSorted)
check if existing FVGs are still valid
Namespace types: array
Parameters:
FVGarr (array)
upFVGpricesSorted (array) : an array of bullish FVG prices, used to selective search through FVG array to remove invalidated levels
dnFVGpricesSorted (array) : an array of bearish FVG prices, used to selective search through FVG array to remove invalidated levels
Returns: void (0)
method drawFVG(counter, FVGshow, FVGname, FVGcol, data, masterCoords, labelLevels, borderTransp, liteMode, rightCoordinate)
draws FVGs on last bar
Namespace types: map
Parameters:
counter (map) : a counter, as map, keeping count of the number of FVGs drawn, makes sure that there aren't more FVGs drawn
than int FVGshow
FVGshow (int) : the number of FVGs to show. There should be a bullish FVG show and bearish FVG show. This function "drawFVG" is used separately
for bearish FVG and bullish FVG.
FVGname (string) : the name of the FVG, "FVG Up" or "FVG Down"
FVGcol (color) : desired FVG color
data (FVG)
masterCoords (map) : a map containing the names and price points of key levels. Used to define price ranges.
labelLevels (string) : an input.string with options "Inside", "Outside", "Remove". Determines whether FVG labels should be inside box, outside,
or na.
borderTransp (int)
liteMode (bool)
rightCoordinate (int) : the right coordinate of any drawings. Must be a time point.
Returns: void
invalidBlockCheck(bullishOBbox, bearishOBbox, userTF)
check if existing order blocks are still valid
Parameters:
bullishOBbox (array) : an array declared using the UDT orderBlock that contains bullish order block related data
bearishOBbox (array) : an array declared using the UDT orderBlock that contains bearish order block related data
userTF (simple int)
Returns: void (0)
method lastBarRejections(id, rejectionColor, idShow, rejectionString, labelLevels, borderTransp, liteMode, rightCoordinate, masterCoords)
draws rejectionBlocks on last bar
Namespace types: array
Parameters:
id (array) : the array, an array of rejection block data declared using the UDT rejection block
rejectionColor (color) : the desired color of the rejection box
idShow (int)
rejectionString (string) : the desired name of the rejection blocks
labelLevels (string) : an input.string() to determine if labels for the block should be inside the box, outside, or none.
borderTransp (int)
liteMode (bool) : an input.bool(). True = neon effect, false = no neon.
rightCoordinate (int) : atime for the right coordinate of the box
masterCoords (map) : a map that stores the price of key levels and assigns them a name, used to determine price ranges
Returns: void
method OBdraw(id, OBshow, BBshow, OBcol, BBcol, bullishString, bearishString, isBullish, labelLevels, borderTransp, liteMode, rightCoordinate, masterCoords)
draws orderblocks and breaker blocks for data stored in UDT array()
Namespace types: array
Parameters:
id (array) : the array, an array of order block data declared using the UDT orderblock
OBshow (int) : the number of order blocks to show
BBshow (int) : the number of breaker blocks to show
OBcol (color) : color of order blocks
BBcol (color) : color of breaker blocks
bullishString (string) : the title of bullish blocks, which is a regular bullish orderblock or a bearish orderblock that's converted to breakerblock
bearishString (string) : the title of bearish blocks, which is a regular bearish orderblock or a bullish orderblock that's converted to breakerblock
isBullish (bool) : whether the array contains bullish orderblocks or bearish orderblocks. If bullish orderblocks,
the array will naturally contain bearish BB, and if bearish OB, the array will naturally contain bullish BB
labelLevels (string) : an input.string() to determine if labels for the block should be inside the box, outside, or none.
borderTransp (int)
liteMode (bool) : an input.bool(). True = neon effect, false = no neon.
rightCoordinate (int) : atime for the right coordinate of the box
masterCoords (map) : a map that stores the price of key levels and assigns them a name, used to determine price ranges
Returns: void
FVG
UDT for FVG calcualtions
Fields:
H (series float) : high price of user-selected timeframe
L (series float) : low price of user-selected timeframe
direction (series string) : FVG direction => "Up" or "Down"
T (series int) : => time of bar on user-selected timeframe where FVG was created
fvgLabel (series label) : optional label for FVG
fvgLineTop (series line) : optional line for top of FVG
fvgLineBot (series line) : optional line for bottom of FVG
fvgBox (series box) : optional box for FVG
labelLine
quickly pair a line and label together as UDT
Fields:
lin (series line) : Line you wish to pair with label
lab (series label) : Label you wish to pair with line
orderBlock
UDT for order block calculations
Fields:
orderBlockData (array) : array containing order block x and y points
orderBlockBox (series box) : optional order block box
vioCount (series int) : = 0 violation count of the order block. 0 = Order Block, 1 = Breaker Block
traded (series bool)
status (series string) : = "OB" status == "OB" => Level is order block. status == "BB" => Level is breaker block.
orderBlockLab (series label) : options label for the order block / breaker block.
strongPoints
UDT for strong highs and strong lows
Fields:
price (series float) : price of the strong high or strong low
timeAtprice (series int) : time of the strong high or strong low
strongPointLabel (series label) : optional label for strong point
strongPointLine (series line) : optional line for strong point
overlayLine (series line) : optional lines for strong point to enhance visibility
overlayLine2 (series line) : optional lines for strong point to enhance visibility
displacement
UDT for dispacements
Fields:
highPrice (series float) : high price of displacement
lowPrice (series float) : low price of displacement
timeAtPrice (series int) : time of bar where displacement occurred
displacementBox (series box) : optional box to draw displacement
displacementLab (series label) : optional label for displacement
po3data
UDT for po3 calculations
Fields:
dHigh (series float) : higher timeframe high price
dLow (series float) : higher timeframe low price
dOpen (series float) : higher timeframe open price
dClose (series float) : higher timeframe close price
po3box (series box) : box to draw po3 candle body
po3line (array) : line array to draw po3 wicks
po3Labels (array) : label array to label price points of po3 candle
macros
UDT for session macros
Fields:
sessions (array) : Array of sessions, you can populate this array using the "quickTime" function located above "export macros".
prices (matrix) : Matrix of session data -> open, high, low, close, time
sessionTimes (array) : Array of session names. Pairs with array sessions.
sessionLines (matrix) : Optional array for sesion drawings.
OTEtimes
UDT for data storage and drawings associated with OTE strategy
Fields:
upTimes (array) : time of highest point before trade is taken
dnTimes (array) : time of lowest point before trade is taken
tpLineLong (series line) : line to mark tp level long
tpLabelLong (series label) : label to mark tp level long
slLineLong (series line) : line to mark sl level long
slLabelLong (series label) : label to mark sl level long
tpLineShort (series line) : line to mark tp level short
tpLabelShort (series label) : label to mark tp level short
slLineShort (series line) : line to mark sl level short
slLabelShort (series label) : label to mark sl level short
sweeps
UDT for data storage and drawings associated with liquidity sweeps
Fields:
upSweeps (matrix) : matrix containing liquidity sweep price points and time points for up sweeps
dnSweeps (matrix) : matrix containing liquidity sweep price points and time points for down sweeps
upSweepDrawings (array) : optional up sweep box array. Pair the size of this array with the rows or columns,
dnSweepDrawings (array) : optional up sweep box array. Pair the size of this array with the rows or columns,
raidExitDrawings
UDT for drawings associated with the Liquidity Raid Strategy
Fields:
tpLine (series line) : tp line for the liquidity raid entry
tpLabel (series label) : tp label for the liquidity raid entry
slLine (series line) : sl line for the liquidity raid entry
slLabel (series label) : sl label for the liquidity raid entry
m2022
UDT for data storage and drawings associated with the Model 2022 Strategy
Fields:
mTime (series int) : time of the FVG where entry limit order is placed
mIndex (series int) : array index of FVG where entry limit order is placed. This requires an array of FVG data, which is defined above.
mEntryDistance (series float) : the distance of the FVG to the 50% range. M2022 looks for the fvg closest to 50% mark of range.
mEntry (series float) : the entry price for the most eligible fvg
fvgHigh (series float) : the high point of the eligible fvg
fvgLow (series float) : the low point of the eligible fvg
longFVGentryBox (series box) : long FVG box, used to draw the eligible FVG
shortFVGentryBox (series box) : short FVG box, used to draw the eligible FVG
line50P (series line) : line used to mark 50% of the range
line100P (series line) : line used to mark 100% (top) of the range
line0P (series line) : line used to mark 0% (bottom) of the range
label50P (series label) : label used to mark 50% of the range
label100P (series label) : label used to mark 100% (top) of the range
label0P (series label) : label used to mark 0% (bottom) of the range
sweepData (array)
silverBullet
UDT for data storage and drawings associated with the Silver Bullet Strategy
Fields:
session (series bool)
sessionStr (series string) : name of the session for silver bullet
sessionBias (series string)
sessionHigh (series float) : = high high of session // use math.max(silverBullet.sessionHigh, high)
sessionLow (series float) : = low low of session // use math.min(silverBullet.sessionLow, low)
sessionFVG (series float) : if applicable, the FVG created during the session
sessionFVGdraw (series box) : if applicable, draw the FVG created during the session
traded (series bool)
tp (series float) : tp of trade entered at the session FVG
sl (series float) : sl of trade entered at the session FVG
sessionDraw (series box) : optional draw session with box
sessionDrawLabel (series label) : optional label session with label
silverBulletDrawings
UDT for trade exit drawings associated with the Silver Bullet Strategy
Fields:
tpLine (series line) : tp line drawing for strategy
tpLabel (series label) : tp label drawing for strategy
slLine (series line) : sl line drawing for strategy
slLabel (series label) : sl label drawing for strategy
unicornModel
UDT for data storage and drawings associated with the Unicorn Model Strategy
Fields:
hPoint (chart.point)
hPoint2 (chart.point)
hPoint3 (chart.point)
breakerBlock (series box) : used to draw the breaker block required for the Unicorn Model
FVG (series box) : used to draw the FVG required for the Unicorn model
topBlock (series float) : price of top of breaker block, can be used to detail trade entry
botBlock (series float) : price of bottom of breaker block, can be used to detail trade entry
startBlock (series int) : start time of the breaker block, used to set the "left = " param for the box
includes (array) : used to store the time of the breaker block, or FVG, or the chart point sequence that setup the Unicorn Model.
entry (series float) : // eligible entry price, for longs"math.max(topBlock, FVG.get_top())",
tpLine (series line) : optional line to mark PT
tpLabel (series label) : optional label to mark PT
slLine (series line) : optional line to mark SL
slLabel (series label) : optional label to mark SL
rejectionBlocks
UDT for data storage and drawings associated with rejection blocks
Fields:
rejectionPoint (chart.point)
bodyPrice (series float) : candle body price closest to the rejection point, for "Up" rejections => math.max(open, close),
rejectionBox (series box) : optional box drawing of the rejection block
rejectionLabel (series label) : optional label for the rejection block
equalLevelsDraw
UDT for data storage and drawings associated with equal highs / equal lows
Fields:
connector (series line) : single line placed at the first high or low, y = avgerage of distinguished equal highs/lows
connectorLab (series label) : optional label to be placed at the highs or lows
levels (array) : array containing the equal highs or lows prices
times (array) : array containing the equal highs or lows individual times
startTime (series int) : the time of the first high or low that forms a sequence of equal highs or lows
radiate (array) : options label to "radiate" the label in connector lab. Can be used for anything
necessaryData
UDT for data storage of historical price points.
Fields:
highArr (array) : array containing historical high points
lowArr (array) : array containing historical low points
timeArr (array) : array containing historical time points
logArr (array) : array containing historical log returns
signArr (array) : array containing historical price directions
closeArr (array) : array containing historical close points
binaryTimeArr (array) : array containing historical time points, uses "push" instead of "unshift" to allow for binary search
binaryCloseArr (array) : array containing historical close points, uses "push" instead of "unshift" to allow the correct
binaryOpenArr (array) : array containing historical optn points, uses "push" instead of "unshift" to allow the correct
atrTFarr (array) : array containing historical user-selected TF atr points
openArr (array) : array containing historical open points

Manipulation Model [FB]GENERAL OVERVIEW:
The Manipulation Model indicator is a complete rule-based system that identifies and confirms setups from the Funded Brothers Manipulation Model. It detects large impulsive candles, called Manipulation Candles and Almost Manipulation Candles, that form around key market levels such as session highs/lows, daily, weekly, and monthly levels, or higher timeframe Fair Value Gaps (FVGs). Using this structure, the indicator automatically marks long, short, bulltrap, and beartrap setups with predefined entry, stop loss, and take profit areas.
This indicator was developed by Flux Charts in collaboration with the Funded Brothers.
ATTRIBUTION NOTICE:
This indicator incorporates concepts and source code from the indicator “MCs with Alerts” authored by @hamza_xau on TradingView. We have received full written permission from the original author to use and commercialize this code within this invite-only script.
Original script: MCs with Alerts:
What is the purpose of the indicator?:
The indicator automates detection of the Manipulation Model trading strategy setups by combining candle structure, key levels, session timing, and higher timeframe Fair Value Gaps. It removes discretion by enforcing fixed conditions for valid signals and automatically managing entry, stop-loss, and take-profit logic.
What is the theory behind the indicator?:
The indicator is built on how price interacts with major reference points such as session highs and lows, or daily and weekly levels. These levels are commonly referenced in technical analysis as areas where price previously reversed or consolidated. Manipulation Candles identify moments when price breaks past these reference points on both sides of the prior candle before closing firmly in one direction. When these candles form near higher timeframe Fair Value Gaps, it reflects price reacting inside an area that previously showed directional imbalance. The higher timeframe EMA filter aligns all detected setups with the broader market trend, allowing only signals that match the dominant direction.
MANIPULATION MODEL FEATURES:
Manipulation Candlesticks
Almost Manipulation Candlesticks
Higher Timeframe Fair Value Gaps
Sessions
Key Levels
Signals
Dashboard
Alerts
MANIPULATION CANDLESTICKS:
Manipulation Candlesticks (MCs) are candles that sweep both sides of the previous candle’s range and close outside of it. In the Manipulation Model indicator, these candles form the foundation for the long/short setups. Once one forms, the indicator checks its position relative to sessions, key levels, and higher timeframe Fair Value Gaps to determine if a valid setup exists.
🔹What is a Manipulation Candlestick?
A Manipulation Candlestick (MC) is defined by structure rather than size. It forms when price takes out both the high and low of the previous candle, then closes outside that range.
A bullish Manipulation Candle occurs when price sweeps below the previous candle’s low and then closes above the previous candle’s high.
A bearish Manipulation Candle occurs when price sweeps above the previous candle’s high and then closes below the previous candle’s low.
🔹How to interpret and use Manipulation Candlesticks:
Manipulation Candlesticks show where price made a strong one-sided move after taking both sides of the previous candle’s range. When one forms, it marks an area where buyers or sellers were likely trapped as price moved aggressively in one direction.
A bullish MC shows strong buying after a false move lower. Price sweeps below the prior low, takes out the prior high, and closes above the previous range, confirming buyers are in control.
A bearish MC shows strong selling after a false move higher than the previous candle’s high. Price sweeps above the prior high, drops below the prior low, and closes beneath the previous range, confirming sellers are dominant.
🔹How Manipulation Candlesticks are identified:
The indicator confirms Manipulation Candles using three filters once a candle closes:
Sweep Condition:
Price must take both sides of the previous candle’s range, moving above its high and below its low, before closing outside that range.
Directional Close:
A bullish MC must close above the previous high, and a bearish MC must close below the previous low.
Wick Confirmation:
A bullish MC must have a smaller upper wick (high - close) than lower wick (open - low), and a bearish MC must have a smaller lower wick (close - low) than upper wick (high - open).
Once these conditions are met at candle close, it is confirmed as a bullish or bearish Manipulation Candle.
🔹Bullish Manipulation Candle
A bullish Manipulation Candle forms when price sweeps below the previous candle’s low, then breaks above its high, and closes above it. The lower wick must be larger than the upper wick, showing little pullback as price pushed upward and confirming strong buying pressure.
🔹Bearish Manipulation Candle
A bearish Manipulation Candle forms when price sweeps above the previous candle’s high, then drops below its low, and closes beneath it. The upper wick must be larger than the lower wick, showing little pullback as price moved downward and confirming strong selling pressure.
🔹Manipulation Candle Visuals
When the indicator detects a Manipulation Candle, it automatically changes the candle’s color on the chart. Both bullish and bearish Manipulation Candles use the same color. Users can change this color in the settings by adjusting the “Manipulation Candlestick” option found under the “Style Customization” section.
The candle coloring feature can also be turned off entirely, which only removes the visual highlight from the chart and does not affect the signals or any of the indicator’s underlying logic that uses Manipulation Candlesticks.
ALMOST MANIPULATION CANDLESTICKS:
Almost Manipulation Candlesticks (AMCs) are similar to Manipulation Candles, except they close inside the previous candle’s range instead of outside it. In the Manipulation Model indicator, these candles help identify when price is showing the same sweeping behavior but hasn’t yet confirmed full displacement. They act as early warnings that a manipulation event may be developing. Just like Manipulation Candles, the indicator checks an AMC’s position relative to sessions, key levels, and higher timeframe Fair Value Gaps to determine if a valid setup exists.
🔹What is an Almost Manipulation Candlestick?
An Almost Manipulation Candlestick (AMC) forms when price sweeps both the high and low of the previous candle and closes inside that candle’s range.
A bullish AMC occurs when price sweeps below the previous low, moves above the previous high, and closes within the previous candle’s body instead of above it.
A bearish AMC occurs when price sweeps above the previous high, drops below the previous low, and closes within the previous candle’s body instead of beneath it.
🔹How to Interpret and Use Almost Manipulation Candlesticks:
Almost Manipulation Candles highlight hesitation or early signs of manipulation.
A bullish AMC indicates buyers pushed price up after sweeping lower, but price did not close decisively above the prior high.
A bearish AMC indicates sellers pushed price down after sweeping higher, but price did not close decisively below the prior low.
🔹How Almost Manipulation Candlesticks are identified:
The indicator confirms Almost Manipulation Candles using the same sweep and wick logic as Manipulation Candles, except the candle’s close must remain inside the previous candle’s range:
Sweep Condition:
Price must take both sides of the previous candle’s range, moving above its high and below its low.
Candle Close Location:
The candle’s close must stay within the prior candle’s range.
Wick Confirmation:
For a bullish AMC, the lower wick must be larger than the upper wick. For a bearish AMC, the upper wick must be larger than the lower wick.
Once these conditions are met at candle close, it is confirmed as a bullish or bearish Almost Manipulation Candle.
🔹Bullish Almost Manipulation Candle
A bullish AMC forms when price sweeps below the previous candle’s low, moves above the prior candle’s high, and closes back inside the previous candle’s range. The lower wick must be larger than the upper wick, showing that buyers defended lower prices but the move did not close decisively upward.
🔹Bearish Almost Manipulation Candle
A bearish AMC forms when price sweeps above the previous candle’s high, drops below the previous candle’s low, and closes back inside the previous candle’s range. The upper wick must be larger than the lower wick, showing that sellers rejected higher prices but the candle did not close decisively lower.
🔹Almost Manipulation Candle Visuals
When the indicator detects an Almost Manipulation Candle, it automatically changes the candle’s color on the chart. Both bullish and bearish Almost Manipulation Candles use the same color. Users can change this color in the settings by adjusting the “Almost Manipulation Candlestick” option found under the “Style Customization” section.
The candle coloring feature can also be turned off entirely, which only removes the visual highlight from the chart and does not affect the signals or any of the indicator’s underlying logic that uses Almost Manipulation Candlesticks.
HIGHER TIMEFRAME FAIR VALUE GAPS:
The Manipulation Model indicator automatically plots Fair Value Gaps from two user-selected higher timeframes.
🔹What is a Fair Value Gap?:
A Fair Value Gap (FVG) is an area where the market’s perception of fair value suddenly changes. On your chart, it appears as a three-candle pattern: a large candle in the middle, with smaller candles on each side that don’t fully overlap it. A bullish FVG forms when a bullish candle is between two smaller bullish/bearish candles, where the first and third candles’ wicks don’t overlap each other at all. A bearish FVG forms when a bearish candle is between two smaller bullish/bearish candles, where the first and third candles’ wicks don’t overlap each other at all.
Bullish & Bearish FVGs:
🔹Why are Fair Value Gaps important?:
Fair Value Gaps (FVGs) show where price moved so quickly that one side of the market never got a chance to trade. They represent sudden shifts in what traders believe something is worth, where “fair value” changed. When a large candle drives straight through an area without overlap from the candles before and after it, it means buyers or sellers were so aggressive that the market skipped that price zone entirely.
These gaps matter because they mark the moment when confidence in price changes. If price rallies and never pulls back, it signals that traders accept the new higher prices as fair and are willing to keep buying there. The same logic applies in reverse for bearish gaps. They tell you where the market re-priced aggressively and where value was last accepted.
🔹How are Fair Value Gaps used?:
Higher Timeframe FVGs are used as a confluence for all setups within the Manipulation Model indicator. The indicator automatically detects and plots these imbalances from the chosen higher timeframe onto the current chart. When a Manipulation or Almost Manipulation Candle forms near or inside a higher timeframe Fair Value Gap, it adds context to the setup. They are not trade signals by themselves but act as a supporting element that contextualizes setups.
🔹When are Higher Timeframe Fair Value Gaps mitigated?
A Higher Timeframe Fair Value Gap is considered mitigated when the selected higher timeframe closes above the gap for a bearish FVG or below the gap for a bullish FVG.
🔹Higher Timeframe FVG Settings:
Timeframe 1 / Timeframe 2:
Select up to two higher timeframes to use for Fair Value Gaps. Disabling either one removes it visually from the chart but does not affect signal generation. However, the timeframes you select will be used for signal generation logic.
For example, if you select the 1-hour and 4-hour timeframes, then the 1-hour and 4-hour FVGs will be used for signal generation logic, which is explained in the signals section below.
Combine Zones:
When enabled, overlapping FVGs on the same higher timeframe are merged into a single zone. This keeps the chart clean and prevents duplicate zones from displaying.
Midline:
Adds a center line through each higher timeframe FVG.
Labels:
Displays a “ FVG” label beside each zone. This helps users see which timeframe the FVG is detected from.
Color Customization:
Each timeframe has separate color settings for bullish and bearish FVGs. Users can adjust these colors independently for both timeframes to fit their chart layout.
FVG Display Limit:
Controls how many higher timeframe FVGs are shown at once. Only the nearest X active gaps to current price will appear, helping maintain a clear view of relevant imbalances.
SESSIONS:
The Manipulation Model indicator includes six customizable trading sessions: Asia, London, NY AM, NYSE, London Close, and NY PM. All session times and visuals are fully user-configurable. Each session has adjustable start and end times that can be set to match your preferred schedule. Users can also customize visuals for each session, including the color, opacity, and visibility of session zones.
Session highs and lows are automatically tracked and used within the indicator’s signal logic. When a Manipulation or Almost Manipulation Candle forms near a session high or low, it is recognized within the indicator’s signal detection.
Default times used for each session (in EST):
Asia: 20:00 - 00:00
London: 02:00 - 05:00
NY AM: 08:00 - 09:30
NYSE: 09:30 - 10:00
London Close: 10:00 - 11:00
NY PM: 11:00 - 14:00
🔹Session Settings:
Session Boxes:
Each session has a box that outlines its active time window. These boxes can be toggled on or off independently. When active, they visually separate each part of the trading day. Users can adjust the color and opacity of each session box.
Session Highs/Lows:
Every session can display its own high and low as horizontal lines. Users can customize the line style for session highs/lows, choosing between solid, dashed, or dotted. The color of the lines will match the same color used for the session box.
Labels and Price Display:
Labels can be toggled on for all session highs and lows. Users can adjust label color, text size, and choose whether to show the price next to the label. Users can adjust the text size, choosing between tiny, small, normal, large, and huge.
Extend Levels:
When enabled, each session’s high and low levels can be extended forward by a set number of bars.
Session Titles:
Titles for each enabled session (e.g., “Asia,” “London,” “NY AM”) can be displayed directly on the chart.
Show Last:
The “Show Last” setting allows you to choose how many recent sessions of each type appear on the chart. For example, if you only have the Asia session enabled and have this setting set to 2, the recent two Asia sessions will be displayed.
🔹Sessions Used
Under the “Sessions Used” section in the settings, users can choose which sessions are active for signal generation. Only sessions enabled here will produce signals. For example, if you want setups to form only during the London session, turn off all other sessions in this section.
Disabling a session under the main Sessions section only hides its visuals (boxes, lines, or labels). It does not impact signal detection or logic. However, changing a session’s start and end time in either section will affect signals, since signals are tied to the exact session windows defined by the user. This distinction ensures you have full control over what’s displayed visually versus what contributes to active trade signal logic.
Please Note: Signals are only detected and plotted on your chart during sessions. Signals can not be detected outside of session time windows.
KEY LEVELS:
The Manipulation Model indicator includes 10 key market levels that outline important structural price areas across daily, weekly, and monthly timeframes. These levels include the Daily Open, Previous Day High/Low, Weekly Open, Previous Week High/Low, Monthly Open, Previous Month High/Low, and Midnight Open. The levels can be enabled or disabled and customized in color and line style. These levels are used for the indicator’s signal logic.
🔹Daily Open
The Daily Open marks where the current trading day began.
🔹Previous Day High/Low
The Previous Day High (PDH) marks the highest price reached during the previous regular trading session. It shows where buyers pushed price to its highest point before the market closed. This value is automatically pulled from the daily chart and projected forward onto intraday timeframes.
The Previous Day Low (PDL) marks the lowest price reached during the previous regular trading session. It shows where selling pressure reached its lowest point before buyers stepped in. Like the PDH, this level is retrieved from the prior day’s data and extended into the current session.
🔹Weekly Open
The Weekly Open marks the first price of the current trading week.
🔹Previous Week High/Low
The Previous Week High (PWH) marks the highest price reached during the previous trading week. It shows where buying pressure reached its peak before the weekly close. This value is automatically pulled from the weekly chart and extended forward into the current week for easy reference on intraday timeframes.
The Previous Week Low (PWL) marks the lowest price reached during the previous trading week. It shows where sellers pushed price to its lowest point before buyers regained control. Like the PWH, this level is sourced from the prior week’s data and projected onto the current week’s chart.
🔹Monthly Open
The Monthly Open marks the opening price of the current month.
🔹Previous Month High/Low
The Previous Month High (PMH) marks the highest price reached during the previous calendar month. It represents the point at which buyers achieved the strongest push before the monthly close. This level is automatically retrieved from the monthly chart and extended into the new month on all lower timeframes.
The Previous Month Low (PML) marks the lowest price reached during the previous calendar month. It shows where selling pressure was strongest before buyers stepped back in. Like the PMH, this value is pulled from the prior month’s data and extended into the new month on all lower timeframes.
🔹Midnight Open
The Midnight Open marks the first price of the trading day at 00:00 EST.
🔹Customization Options:
Users can fully customize the appearance of all key levels, including the following:
Daily Levels: Daily Open, PDH, and PDL
Weekly Levels: Weekly Open, PWH, and PWL
Monthly Levels: Monthly Open, PMH, and PML
Midnight Open
Color Settings:
Each group of levels (Daily, Weekly, Monthly) shares a single color for the Open, High, and Low lines. For example, the Daily Open, PDH, and PDL all use the same color. Colors can be changed for each group, but not for individual levels within the same group.
Line Style:
Users can select a global line style, choosing between solid, dashed, or dotted, for all Daily, Weekly, and Monthly levels. This style applies to all levels within those groups. For example, the Weekly Open, PWH, and PWL must all share the same line style.
The Midnight Open has its own independent line style setting and can use a different style from the other key levels.
Show Labels:
When enabled, text labels appear to the right of each key level. Users can adjust label color, but only one label color is applied to all levels for consistency.
🔹Key Levels Used:
Under the “Key Levels Used” section, users can choose which Key Levels and Session Levels (Session Highs/Lows) are factored into signal generation. Only levels enabled here are considered within the logic that confirms setups.
Users can choose between the following levels:
Daily Open
Previous Day High/Low
Weekly Open
Previous Week High/Low
Monthly Open
Previous Month High/Low
Asia Session High/Low
London Session High/Low
NY AM Session High/Low
NY Lunch Session High/Low
NY PM Session High/Low
London Close Session High/Low
Midnight Open
For example, if you only want to see setups that form using the Daily and Weekly levels, you should only enable the Daily Open, Previous Day High/Low, Weekly Open, and Previous Week High/Low.
Disabling a level in the main “Key Levels” section only hides its visuals, while disabling it in “Key Levels Used” removes it entirely from the signal logic. Adjusting or removing any level in this section directly affects how setups are detected since the indicator references these levels when confirming Long, Short, Bulltrap, and Beartrap setups.
SIGNALS:
The Manipulation Model indicator automatically identifies Long, Short, Bulltrap, and Beartrap setups based on the interaction between Manipulation Candles (MCs), Almost Manipulation Candles (AMCs), and two main entry conditions: Key Levels and Fair Value Gaps (FVGs).
Each signal type uses the structure of a Manipulation or Almost Manipulation Candle as its foundation. When one of these candles forms and aligns with the entry conditions, the indicator automatically plots labels for an entry, stop loss (SL), and take profit (TP). Every signal follows a mechanical set of rules and is marked in real time. Once confirmed on a candle close, the signal remains fixed on the chart and does not repaint.
🔹Higher Timeframe Bias Filter
Before a signal is generated, the indicator automatically determines directional bias using the 50-period Exponential Moving Average (EMA) on the 1-hour timeframe.
If price is above the 50 EMA, only bullish setups are allowed.
If price is below the 50 EMA, only bearish setups are allowed.
🔹Stop Loss and Take Profit Logic:
For every setup, the stop loss is placed at the low of the Manipulation or Almost Manipulation Candle for bullish setups, and at the high for bearish setups. The take profit is automatically calculated at a 1:1 risk-to-reward ratio relative to that distance.
Users can adjust both the SL Multiplier and TP Multiplier in the settings, under the “General Configuration” section, to extend or contract these levels. For example, increasing the TP Multiplier to 1.5 sets the take profit at 1.5x the distance between the entry and stop loss.
🔹Signal Input Settings:
Candle Type:
Choose which candle type is used to generate signals. Options include:
Manipulation Candle (MC) only
Almost Manipulation Candle (AMC) only
Both (signals are generated from either candle type)
Entry Method:
Determines whether signals are generated based on:
Key Levels only
Fair Value Gaps only
Both (signals are generated from Key Levels AND Fair Value Gaps)
Setup Types:
You can enable or disable specific setup types. Only the selected setup types will appear on your chart:
Long Setups
Short Setups
Bulltrap Setups
Beartrap Setups
🔹Long Setup – Manipulation Candle + Key Level:
A long setup forms when a bullish Manipulation Candle touches a toggled-on key level under the “Key Levels Used” section and closes above it during a toggled-on session from the “Sessions Used” section. After the candle closes and price is above the 1-hour 50 EMA, the indicator marks:
Entry: At the close of the bullish Manipulation Candle
Stop Loss: At the low of the same candle
Take Profit: Equal distance above the entry, based on TP multiplier
In this example, a bullish MC touches the PDH during the London Session and closes above the level:
🔹Short Setup – Manipulation Candle + Key Level
A short setup forms when a bearish Manipulation Candle touches a toggled-on key level under the “Key Levels Used” section and closes below it during a toggled-on session from the “Sessions Used” section. After the candle closes and price is below the 1-hour 50 EMA, the indicator marks:
Entry: At the close of the bearish Manipulation Candle
Stop Loss: At the high of the same candle
Take Profit: Equal distance below the entry, based on the TP Multiplier
In this example, a bearish MC touches the Daily Open during the NY AM Session and closes below the level:
🔹Trap Confirmation Settings
Two settings control how bulltrap and beartrap setups are confirmed once a Manipulation or Almost Manipulation Candle forms.
Candles Between Confirmation:
This setting defines the maximum number of candles allowed between the initial Manipulation Candle and the confirmation candle that closes back in the opposite direction.
For example, if this value is set to 2, the confirmation candle must appear within two bars of the Manipulation Candle for the setup to remain valid. If too many candles form in between, the bull/bear trap setup is ignored.
Trap Wick-to-Body Ratio:
This input measures the ratio of the confirmation candle’s wick size to its body size for bulltrap and beartrap setups. Lower values require a larger body compared to the wick, meaning the confirmation candle must close more decisively. If the ratio is above the threshold set by the user, the confirmation candle for a bulltrap/beartrap setup is considered valid.
For example, if the wick is 10 points and the body is 10 points, the ratio is 1.0 (10 / 10). If the wick is 10 points and the body is 20 points, the ratio is 0.5 (10 / 20).
🔹Beartrap Setup – Manipulation Candle + Key Level
A beartrap setup forms when a bearish Manipulation Candle touches a toggled-on key level under the “Key Levels Used” section. The candle does not need to close above or below the level, it only needs to touch it. After this bearish MC forms, a confirmation candle must close back above the MC’s high during an enabled session under the “Sessions Used” section. The sweep or initial touch can occur before or outside the session, but the confirmation candle must close within an active session window.
To confirm the setup, the following conditions must be met:
The confirmation candle must close within the limit set by the Candles Between Confirmation input.
Its wick-to-body ratio must be less than or equal to the Trap Wick-to-Body Ratio input
Once these conditions are met and price is above the 1-hour 50 EMA, the indicator marks:
Entry: At the close of the confirmation candle
Stop Loss: At the low of the confirmation candle
Take Profit: Equal distance above the entry, measured 1:1 from the candle’s body and scaled by the TP Multiplier
In this example, a bearish Manipulation Candle touches the Daily Open level before price reverses and a confirmation candle closes above it. The confirmation candle occurs during the Asia Session, has a strong body with minimal wicks, meeting the Trap Wick-to-Body Ratio requirement, and it forms just two candles after the bearish MC which is within the limit set by the Candles Between Confirmation input.
🔹Bulltrap Setup – Manipulation Candle + Key Level
A bulltrap setup forms when a bullish Manipulation Candle touches a toggled-on key level under the “Key Levels Used” section. The MC does not need to close above or below the level, it only needs to touch it. After this bullish MC forms, a confirmation candle must close back below the MC’s low during an enabled session under the “Sessions Used” section. The initial key level touch from the MC can occur before or outside the session, but the confirmation candle must close within an active session window.
To confirm the setup, the following conditions must be met:
The confirmation candle must close within the limit set by the Candles Between Confirmation input.
Its wick-to-body ratio must be less than or equal to the Trap Wick-to-Body Ratio input.
Once these conditions are met and price is below the 1-hour 50 EMA, the indicator marks:
Entry: At the close of the confirmation candle
Stop Loss: At the high of the confirmation candle
Take Profit: Equal distance below the entry, measured 1:1 from the candle’s body and scaled by the TP Multiplier
In this example, a bullish Manipulation Candle touches the Daily Open level before price reverses and a confirmation candle closes below it. The confirmation candle forms during the NY AM Session, has a strong body with minimal wicks that meet the Trap Wick-to-Body Ratio requirement, and it appears two candles after the bullish MC which is within the limit defined by the Candles Between Confirmation input.
🔹Long Setup – Almost Manipulation Candle + Key Level
A long setup forms when a bullish Almost Manipulation Candle (AMC) touches a toggled-on key level under the “Key Levels Used” section and closes above it during a toggled-on session from the “Sessions Used” section. After the candle closes and price is above the 1-hour 50 EMA, the indicator marks:
Entry: At the close of the bullish Almost Manipulation Candle
Stop Loss: At the low of the same candle
Take Profit: Equal distance above the entry, based on the TP Multiplier
In this example, a bullish AMC touches the Daily Open during the NYSE Session and closes above the level.
🔹Short Setup – Almost Manipulation Candle + Key Level
A short setup forms when a bearish Almost Manipulation Candle (AMC) touches a toggled-on key level under the “Key Levels Used” section and closes below it during a toggled-on session from the “Sessions Used” section. After the candle closes and price is below the 1-hour 50 EMA, the indicator marks:
Entry: At the close of the bearish Almost Manipulation Candle
Stop Loss: At the high of the same candle
Take Profit: Equal distance below the entry, based on the TP Multiplier
In this example, a bearish AMC touches the Midnight Open during the NY AM Session and closes below the level.
🔹Beartrap Setup – Almost Manipulation Candle + Key Level
A beartrap setup forms when a bearish Almost Manipulation Candle (AMC) touches a toggled-on key level under the “Key Levels Used” section. The candle does not need to close above or below the level, it only needs to touch it. After this bearish AMC forms, a confirmation candle must close back above the AMC’s high during an enabled session under the “Sessions Used” section. The initial touch can occur before or outside the session, but the confirmation candle must close within an active session window.
To confirm the setup, the following conditions must be met:
The confirmation candle must close within the limit set by the Candles Between Confirmation input.
Its wick-to-body ratio must be less than or equal to the Trap Wick-to-Body Ratio input.
Once these conditions are met and price is above the 1-hour 50 EMA, the indicator marks:
Entry: At the close of the confirmation candle
Stop Loss: At the low of the confirmation candle
Take Profit: Equal distance above the entry, measured 1:1 from the candle’s body and scaled by the TP Multiplier
In this example, a bearish AMC touches the Midnight Open before price reverses and a confirmation candle closes above it. The confirmation candle forms during the London Session, has a large body with minimal wicks that meet the Trap Wick-to-Body Ratio requirement, and appears seven candles after the bearish AMC which is within the Candles Between Confirmation limit (10 by default).
🔹Bulltrap Setup – Almost Manipulation Candle + Key Level
A bulltrap setup forms when a bullish AMC touches a toggled-on key level under the “Key Levels Used” section. The candle does not need to close above or below the level; it only needs to touch it. After this bullish AMC forms, a confirmation candle must close back below the AMC’s low during an enabled session under the “Sessions Used” section. The initial touch can occur before or outside the session, but the confirmation candle must close within an active session window.
To confirm the setup, the following conditions must be met:
The confirmation candle must close within the limit set by the Candles Between Confirmation input.
Its wick-to-body ratio must be less than or equal to the Trap Wick-to-Body Ratio input.
Once these conditions are met and price is below the 1-hour 50 EMA, the indicator marks:
Entry: At the close of the confirmation candle
Stop Loss: At the high of the confirmation candle
Take Profit: Equal distance below the entry, measured 1:1 from the candle’s body and scaled by the TP Multiplier
In this example, a bullish AMC touches the NY Lunch Session Low before price reverses and a confirmation candle closes below it. The confirmation candle forms during the Asia Session, has a strong body with minimal wicks that meet the Trap Wick-to-Body Ratio requirement, and appears six candles after the bullish AMC which is within the Candles Between Confirmation limit.
🔹Long Setup – Manipulation Candle + Fair Value Gap
A long setup forms when a bullish Manipulation Candle touches a bullish higher timeframe Fair Value Gap (FVG) from one of the two higher timeframe inputs under the “Fair Value Gaps” section. The candle must close during an enabled session under the “Sessions Used” section. After the candle closes and price is above the 1-hour 50 EMA, the indicator marks:
Entry: At the close of the bullish Manipulation Candle
Stop Loss: At the low of the same candle
Take Profit: Equal distance above the entry, scaled by the TP Multiplier
In this example, a bullish MC taps into a bullish 1-hour FVG during the Asia Session.
🔹Short Setup – Manipulation Candle + Fair Value Gap
A short setup forms when a bearish Manipulation Candle touches a bearish higher timeframe FVG from one of the two selected higher timeframe inputs under the “Fair Value Gaps” section. The candle must also close during an enabled session under the “Sessions Used” section. After the candle closes and price is below the 1-hour 50 EMA, the indicator marks:
Entry: At the close of the bearish Manipulation Candle
Stop Loss: At the high of the same candle
Take Profit: Equal distance below the entry, scaled by the TP Multiplier
In this example, a bearish MC taps a bearish 1-hour FVG during the Asia Session.
🔹Beartrap Setup – Manipulation Candle + Fair Value Gap
A beartrap setup forms when a bearish Manipulation Candle touches a bullish or bearish higher timeframe FVG from one of the two higher timeframe inputs under the “Higher Timeframe FVG Settings” section. After the bearish MC forms, price must reverse and a confirmation candle must close above the bearish MC’s high during an enabled session under the “Sessions Used” section. The initial touch of the FVG can occur before or outside the session, but the confirmation candle must close within an active session window.
To confirm the setup, the following conditions must be met:
The confirmation candle must close within the limit set by the Candles Between Confirmation input.
Its wick-to-body ratio must be less than or equal to the Trap Wick-to-Body Ratio input.
Once these conditions are met and price is above the 1-hour 50 EMA, the indicator marks:
Entry: At the close of the confirmation candle
Stop Loss: At the low of the confirmation candle
Take Profit: Equal distance above the entry, measured 1:1 from the candle’s body and scaled by the TP Multiplier
In this example, a bearish MC taps a 1-hour bearish FVG, price reverses, and a confirmation candle closes above the bearish MC’s high. The confirmation candle forms during the London Session, has a strong body with minimal wicks that meet the Trap Wick-to-Body Ratio requirement, and appears two candles after the bearish MC which is within the Candles Between Confirmation limit.
🔹Bulltrap Setup – Manipulation Candle + Fair Value Gap
A bulltrap setup forms when a bullish MC touches a bearish or bullish higher timeframeFVG from one of the two higher timeframe inputs under the “Higher Timeframe FVG Settings” section. After the bullish MC forms, price must reverse and a confirmation candle must close below the MC’s low during an enabled session under the “Sessions Used” section. The initial touch of the FVG can occur before or outside the session, but the confirmation candle must close within an active session window.
To confirm the setup, the following conditions must be met:
The confirmation candle must close within the limit set by the Candles Between Confirmation input.
Its wick-to-body ratio must be less than or equal to the Trap Wick-to-Body Ratio input.
Once these conditions are met and price is below the 1-hour 50 EMA, the indicator marks:
Entry: At the close of the confirmation candle
Stop Loss: At the high of the confirmation candle
Take Profit: Equal distance below the entry, measured 1:1 from the candle’s body and scaled by the TP Multiplier
In this example, a bullish MC taps a 4-hour bearish FVG, price reverses, and a confirmation candle closes below the bullish MC’s low. The confirmation candle forms during the NY PM Session, has a strong body with minimal wicks that meet the Trap Wick-to-Body Ratio requirement, and appears six candles after the bullish MC which is within the Candles Between Confirmation limit.
🔹Long Setup – Almost Manipulation Candle + Fair Value Gap
A long setup forms when a bullish AMC touches a bullish higher timeframe FVG from one of the two higher timeframe inputs under the “Fair Value Gaps” section. The candle must close during an enabled session under the “Sessions Used” section. After the candle closes and price is above the 1-hour 50 EMA, the indicator marks:
Entry: At the close of the bullish AMC
Stop Loss: At the low of the same candle
Take Profit: Equal distance above the entry, scaled by the TP Multiplier
In this example, a bullish AMC taps into a bullish 1-hour FVG during the London Session.
🔹Short Setup – Almost Manipulation Candle + Fair Value Gap
A short setup forms when a bearish AMC touches a bearish higher timeframe FVG from one of the two selected higher timeframe inputs under the “Fair Value Gaps” section. The candle must also close during an enabled session under the “Sessions Used” section. After the candle closes and price is below the 1-hour 50 EMA, the indicator marks:
Entry: At the close of the bearish AMC
Stop Loss: At the high of the same candle
Take Profit: Equal distance below the entry, scaled by the TP Multiplier
In this example, a bearish AMC taps a bearish 1-hour FVG during the NY PM Session.
🔹Beartrap Setup – Almost Manipulation Candle + Fair Value Gap
A beartrap setup forms when a bearish AMC touches a bullish or bearish higher timeframe FVG from one of the two higher timeframe inputs under the “Higher Timeframe FVG Settings” section. After the bearish AMC forms, price must reverse and a confirmation candle must close above the bearish AMC’s high during an enabled session under the “Sessions Used” section. The initial touch of the FVG can occur before or outside the session, but the confirmation candle must close within an active session window.
To confirm the setup, the following conditions must be met:
The confirmation candle must close within the limit set by the Candles Between Confirmation input.
Its wick-to-body ratio must be less than or equal to the Trap Wick-to-Body Ratio input.
Once these conditions are met and price is above the 1-hour 50 EMA, the indicator marks:
Entry: At the close of the confirmation candle
Stop Loss: At the low of the confirmation candle
Take Profit: Equal distance above the entry, measured 1:1 from the candle’s body and scaled by the TP Multiplier
In this example, a bearish AMC taps a 4-hour bearish FVG, price reverses, and a confirmation candle closes above the bearish AMC’s high. The confirmation candle forms during the NY PM Session, has a strong body with minimal wicks that meet the Trap Wick-to-Body Ratio requirement, and appears seven candles after the bearish AMC, which is within the Candles Between Confirmation limit.
🔹Bulltrap Setup – Almost Manipulation Candle + Fair Value Gap
A bulltrap setup forms when a bullish AMC touches a bearish or bullish higher timeframe FVG from one of the two higher timeframe inputs under the “Higher Timeframe FVG Settings” section. After the bullish AMC forms, price must reverse and a confirmation candle must close below the AMC’s low during an enabled session under the “Sessions Used” section. The initial touch of the FVG can occur before or outside the session, but the confirmation candle must close within an active session window.
To confirm the setup, the following conditions must be met:
The confirmation candle must close within the limit set by the Candles Between Confirmation input.
Its wick-to-body ratio must be less than or equal to the Trap Wick-to-Body Ratio input.
Once these conditions are met and price is below the 1-hour 50 EMA, the indicator marks:
Entry: At the close of the confirmation candle
Stop Loss: At the high of the confirmation candle
Take Profit: Equal distance below the entry, measured 1:1 from the candle’s body and scaled by the TP Multiplier
In this example, a bullish AMC taps a 1-hour bullish FVG, price reverses, and a confirmation candle closes below the bullish AMC’s low. The confirmation candle forms during the Asia Session, has a strong body with minimal wicks that meet the Trap Wick-to-Body Ratio requirement, and appears six candles after the bullish AMC, which is within the Candles Between Confirmation limit.
🔹Signal Style Customization
The Manipulation Model indicator provides full visual customization for all signal elements, allowing users to easily adjust the appearance of entry, stop loss, and take profit labels.
Label Colors:
Users can customize the label color for Long Setups (Long and Beartrap) and Short Setups (Short and Bulltrap).
Long and Beartrap setups share the same label color.
Short and Bulltrap setups share the same label color.
Label text color can also be customized and applied globally to all signal labels.
Stop Loss (SL) and Take Profit (TP) Labels:
The SL and TP label colors can be customized independently.
Users can toggle SL Labels and TP Labels on or off. When turned off, the corresponding labels are hidden, but their levels remain active on the chart.
Entry, Stop Loss, and Take Profit Lines:
Each of these lines can be individually toggled on or off.
Entry Line: Marks the entry price level.
Stop Loss Line: Displays the SL level derived from each setup’s logic.
Take Profit Line: Displays the TP level calculated using the Take Profit Multiplier setting.
Users can also toggle the labels for each line on or off and adjust the color for each line type independently.
WIN RATE DASHBOARD:
The Win Rate Dashboard gives traders a quick way to see the recent performance of their enabled setups. It automatically calculates and displays win rates for each signal type turned on under the “General Configuration” section, based on the sessions and key levels currently active in the settings.
The dashboard updates in real time, showing both the win rate percentage and total trade count for all enabled signal types combined. It looks back at a set number of bars to calculate results, providing a simple performance snapshot directly on your chart.
How It Works:
When a signal triggers, the indicator tracks whether price first reaches the Take Profit (TP) or Stop Loss (SL) level.
A winning trade is recorded when the take profit is hit before the stop loss.
A losing trade is recorded when the stop loss is hit before the take profit.
The win rate = (Winning Trades / Total Trades) x 100
🔹Dashboard Customization:
Users can adjust the dashboard’s appearance with the following settings:
Background Color
Frame Color
Border Color
Text Color
You can also toggle the dashboard on or off from the settings menu. It appears in the top-right corner of the chart by default and its position cannot be changed.
🔹Disclaimer:
The Win Rate Dashboard provides historical performance data based on the signals and conditions you’ve enabled. These results are calculated from past bars and are not indicative of future performance or profitability.
ALERTS:
The Manipulation Model indicator includes full alert functionality powered by AnyAlert(), allowing users to receive notifications for all major setups and level breaks in real time.
Users can choose exactly which alerts they want to receive under the “Alerts” section of the settings. Once your preferred alerts are toggled on, you can create a TradingView alert using the AnyAlert() condition. This will automatically trigger alerts for all selected events as they occur on your chart.
Available Alerts:
Long Setup
Short Setup
Bulltrap Setup
Beartrap Setup
Manipulation Candle
Almost Manipulation Candle
Previous Day High/Low Break
Current Day Open Break
Previous Week High/Low Break
Current Week Open Break
Previous Month High/Low Break
Current Month Open Break
Asia Session High/Low Break
London Session High/Low Break
NY AM Session High/Low Break
NYSE Session High/Low Break
London Close Session High/Low Break
NY PM Session High/Low Break
Midnight Open Break
To receive alerts:
Open the alert creation window in TradingView
Select “Manipulation Model ” as the condition
Choose AnyAlert() from the dropdown
Create the alert
IMPORTANT NOTES:
TradingView has limitations when running features on multiple timeframes, which can result in the following restriction:
Computation Error:
The computation of using MTF features is very intensive on TradingView. This can sometimes cause calculation timeouts. When this occurs, simply force the recalculation by modifying one indicator’s settings or by removing the indicator and adding it to your chart again.
UNIQUENESS:
The Manipulation Model is unique because every setup type is fully rule-based and tied to strict structural logic. Traders can control exactly how signals form by selecting which candle types are used, which key levels and sessions are active, and whether entries trigger from Key Levels, Fair Value Gaps, or both. All setups use objective rules for confirmation, wick-to-body ratio, and higher timeframe bias. The indicator also provides full customization for visuals, alerts, and trade parameters like TP and SL multipliers. A built-in Win Rate Dashboard tracks real-time performance for all enabled setup types based on the user’s active sessions and signal filters. Together, these features make it a complete, mechanical implementation of the Funded Brothers Manipulation Model and it works across all asset classes including stocks, crypto, forex, and futures.

Mars Signals - Ultimate Institutional Suite v3.0(Joker)Comprehensive Trading Manual
Mars Signals – Ultimate Institutional Suite v3.0 (Joker)
## Chapter 1 – Philosophy & System Architecture
This script is not a simple “buy/sell” indicator.
Mars Signals – UIS v3.0 (Joker) is designed as an institutional-style analytical assistant that layers several methodologies into a single, coherent framework.
The system is built on four core pillars:
1. Smart Money Concepts (SMC)
- Detection of Order Blocks (professional demand/supply zones).
- Detection of Fair Value Gaps (FVGs) (price imbalances).
2. Smart DCA Strategy
- Combination of RSI and Bollinger Bands
- Identifies statistically discounted zones for scaling into spot positions or exiting shorts.
3. Volume Profile (Visible Range Simulation)
- Distribution of volume by price, not by time.
- Identification of POC (Point of Control) and high-/low-volume areas.
4. Wyckoff Helper – Spring
- Detection of bear traps, liquidity grabs, and sharp bullish reversals.
All four pillars feed into a Confluence Engine (Scoring System).
The final output is presented in the Dashboard, with a clear, human-readable signal:
- STRONG LONG 🚀
- WEAK LONG ↗
- NEUTRAL / WAIT
- WEAK SHORT ↘
- STRONG SHORT 🩸
This allows the trader to see *how many* and *which* layers of the system support a bullish or bearish bias at any given time.
## Chapter 2 – Settings Overview
### 2.1 General & Dashboard Group
- Show Dashboard Panel (`show_dash`)
Turns the dashboard table in the corner of the chart ON/OFF.
- Show Signal Recommendation (`show_rec`)
- If enabled, the textual signal (STRONG LONG, WEAK SHORT, etc.) is displayed.
- If disabled, you only see feature status (ON/OFF) and the current price.
- Dashboard Position (`dash_pos`)
Determines where the dashboard appears on the chart:
- `Top Right`
- `Bottom Right`
- `Top Left`
### 2.2 Smart Money (SMC) Group
- Enable SMC Strategy (`show_smc`)
Globally enables or disables the Order Block and FVG logic.
- Order Block Pivot Lookback (`ob_period`)
Main parameter for detecting key pivot highs/lows (swing points).
- Default value: 5
- Concept:
A bar is considered a pivot low if its low is lower than the lows of the previous 5 and the next 5 bars.
Similarly, a pivot high has a high higher than the previous 5 and the next 5 bars.
These pivots are used as anchors for Order Blocks.
- Increasing `ob_period`:
- Fewer levels.
- But levels tend to be more significant and reliable.
- In highly volatile markets (major news, war events, FOMC, etc.),
using values 7–10 is recommended to filter out weak levels.
- Show Fair Value Gaps (`show_fvg`)
Enables/disables the drawing of FVG zones (imbalances).
- Bullish OB Color (`c_ob_bull`)
- Color of Bullish Order Blocks (Demand Zones).
- Default: semi-transparent green (transparency ≈ 80).
- Bearish OB Color (`c_ob_bear`)
- Color of Bearish Order Blocks (Supply Zones).
- Default: semi-transparent red.
- Bullish FVG Color (`c_fvg_bull`)
- Color of Bullish FVG (upward imbalance), typically yellow.
- Bearish FVG Color (`c_fvg_bear`)
- Color of Bearish FVG (downward imbalance), typically purple.
### 2.3 Smart DCA Strategy Group
- Enable DCA Zones (`show_dca`)
Enables the Smart DCA logic and visual labels.
- RSI Length (`rsi_len`)
Lookback period for RSI (default: 14).
- Shorter → more sensitive, more noise.
- Longer → fewer signals, higher reliability.
- Bollinger Bands Length (`bb_len`)
Moving average period for Bollinger Bands (default: 20).
- BB Multiplier (`bb_mult`)
Standard deviation multiplier for Bollinger Bands (default: 2.0).
- For extremely volatile markets, values like 2.5–3.0 can be used so that only extreme deviations trigger a DCA signal.
### 2.4 Volume Profile (Visible Range Sim) Group
- Show Volume Profile (`show_vp`)
Enables the simulated Volume Profile bars on the right side of the chart.
- Volume Lookback Bars (`vp_lookback`)
Number of bars used to compute the Volume Profile (default: 150).
- Higher values → broader historical context, heavier computation.
- Row Count (`vp_rows`)
Number of vertical price segments (rows) to divide the total price range into (default: 30).
- Width (%) (`vp_width`)
Relative width of each volume bar as a percentage.
In the code, bar widths are scaled relative to the row with the maximum volume.
> Technical note: Volume Profile calculations are executed only on the last bar (`barstate.islast`) to keep the script performant even on higher timeframes.
### 2.5 Wyckoff Helper Group
- Show Wyckoff Events (`show_wyc`)
Enables detection and plotting of Wyckoff Spring events.
- Volume MA Length (`vol_ma_len`)
Length of the moving average on volume.
A bar is considered to have Ultra Volume if its volume is more than 2× the volume MA.
## Chapter 3 – Smart Money Strategy (Order Blocks & FVG)
### 3.1 What Is an Order Block?
An Order Block (OB) represents the footprint of large institutional orders:
- Bullish Order Block (Demand Zone)
The last selling region (bearish candle/cluster) before a strong upward move.
- Bearish Order Block (Supply Zone)
The last buying region (bullish candle/cluster) before a strong downward move.
Institutions and large players place heavy orders in these regions. Typical price behavior:
- Price moves away from the zone.
- Later returns to the same zone to fill unfilled orders.
- Then continues the larger trend.
In the script:
- If `pl` (pivot low) forms → a Bullish OB is created.
- If `ph` (pivot high) forms → a Bearish OB is created.
The box is drawn:
- From `bar_index ` to `bar_index`.
- Between `low ` and `high `.
- `extend=extend.right` extends the OB into the future, so it acts as a dynamic support/resistance zone.
- Only the last 4 OB boxes are kept to avoid clutter.
### 3.2 Order Block Color Guide
- Semi-transparent Green (`c_ob_bull`)
- Represents a Bullish Order Block (Demand Zone).
- Interpretation: a price region with a high probability of bullish reaction.
- Semi-transparent Red (`c_ob_bear`)
- Represents a Bearish Order Block (Supply Zone).
- Interpretation: a price region with a high probability of bearish reaction.
Overlap (Multiple OBs in the Same Area)
When two or more Order Blocks overlap:
- The shared area appears visually denser/stronger.
- This suggests higher order density.
- Such zones can be treated as high-priority levels for entries, exits, and stop-loss placement.
### 3.3 Demand/Supply Logic in the Scoring Engine
is_in_demand = low <= ta.lowest(low, 20)
is_in_supply = high >= ta.highest(high, 20)
- If current price is near the lowest lows of the last 20 bars, it is considered in a Demand Zone → positive impact on score.
- If current price is near the highest highs of the last 20 bars, it is considered in a Supply Zone → negative impact on score.
This logic complements Order Blocks and helps the Dashboard distinguish whether:
- Market is currently in a statistically cheap (long-friendly) area, or
- In a statistically expensive (short-friendly) area.
### 3.4 Fair Value Gaps (FVG)
#### Concept
When the market moves aggressively:
- Some price levels are skipped and never traded.
- A gap between wicks/shadows of consecutive candles appears.
- These regions are called Fair Value Gaps (FVGs) or Imbalances.
The market generally “dislikes” imbalance and often:
- Returns to these zones in the future.
- Fills the gap (rebalance).
- Then resumes its dominant direction.
#### Implementation in the Code
Bullish FVG (Yellow)
fvg_bull_cond = show_smc and show_fvg and low > high and close > high
if fvg_bull_cond
box.new(bar_index , high , bar_index, low, ...)
Core condition:
`low > high ` → the current low is above the high of two bars ago; the space between them is an untraded gap.
Bearish FVG (Purple)
fvg_bear_cond = show_smc and show_fvg and high < low and close < low
if fvg_bear_cond
box.new(bar_index , low , bar_index, high, ...)
Core condition:
`high < low ` → the current high is below the low of two bars ago; again a price gap exists.
#### FVG Color Guide
- Transparent Yellow (`c_fvg_bull`) – Bullish FVG
Often acts like a magnet for price:
- Price tends to retrace into this zone,
- Fill the imbalance,
- And then continue higher.
- Transparent Purple (`c_fvg_bear`) – Bearish FVG
Price tends to:
- Retrace upward into the purple area,
- Fill the imbalance,
- And then resume downward movement.
#### Trading with FVGs
- FVGs are *not* standalone entry signals.
They are best used as:
- Targets (take-profit zones), or
- Reaction areas where you expect a pause or reversal.
Examples:
- If you are long, a bearish FVG above is often an excellent take-profit zone.
- If you are short, a bullish FVG below is often a good cover/exit zone.
### 3.5 Core SMC Trading Templates
#### Reversal Long
1. Price trades down into a green Order Block (Demand Zone).
2. A bullish confirmation candle (Close > Open) forms inside or just above the OB.
3. If this zone is close to or aligned with a bullish FVG (yellow), the signal is reinforced.
4. Entry:
- At the close of the confirmation candle, or
- Using a limit order near the upper boundary of the OB.
5. Stop-loss:
- Slightly below the OB.
- If the OB is broken decisively and price consolidates below it, the zone loses validity.
6. Targets:
- The next FVG,
- Or the next red Order Block (Supply Zone) above.
#### Reversal Short
The mirror scenario:
- Price rallies into a red Order Block (Supply).
- A bearish confirmation candle forms (Close < Open).
- FVG/premium structure above can act as a confluence.
- Stop-loss goes above the OB.
- Targets: lower FVGs or subsequent green OBs below.
## Chapter 4 – Smart DCA Strategy (RSI + Bollinger Bands)
### 4.1 Smart DCA Concept
- Classic DCA = buying at fixed time intervals regardless of price.
- Smart DCA = scaling in only when:
- Price is statistically cheaper than usual, and
- The market is in a clear oversold condition.
Code logic:
rsi_val = ta.rsi(close, rsi_len)
= ta.bb(close, bb_len, bb_mult)
dca_buy = show_dca and rsi_val < 30 and close < bb_lower
dca_sell = show_dca and rsi_val > 70 and close > bb_upper
Conditions:
- DCA Buy – Smart Scale-In Zone
- RSI < 30 → oversold.
- Close < lower Bollinger Band → price has broken below its typical volatility envelope.
- DCA Sell – Overbought/Distribution Zone
- RSI > 70 → overbought.
- Close > upper Bollinger Band → price is extended far above the mean.
### 4.2 Visual Representation on the Chart
- Green “DCA” Label Below Candle
- Shape: `labelup`.
- Color: lime background, white text.
- Meaning: statistically attractive level for laddered spot entries or short exits.
- Red “SELL” Label Above Candle
- Warning that the market is in an extended, overbought condition.
- Suitable for profit-taking on longs or considering short entries (with proper confluence and risk management).
- Light Green Background (`bgcolor`)
- When `dca_buy` is true, the candle background turns very light green (high transparency).
- This helps visually identify DCA Zones across the chart at a glance.
### 4.3 Practical Use in Trading
#### Spot Trading
Used to build a better average entry price:
- Every time a DCA label appears, allocate a fixed portion of capital (e.g., 2–5%).
- Combining DCA signals with:
- Green OBs (Demand Zones), and/or
- The Volume Profile POC
makes the zone structurally more important.
#### Futures Trading
- Longs
- Use DCA Buy signals as low-risk zones for opening or adding to longs when:
- Price is inside a green OB, or
- The Dashboard already leans LONG.
- Shorts
- Use DCA Sell signals as:
- Exit zones for longs, or
- Areas to initiate shorts with stops above structural highs.
## Chapter 5 – Volume Profile (Visible Range Simulation)
### 5.1 Concept
Traditional volume (histogram under the chart) shows volume over time.
Volume Profile shows volume by price level:
- At which prices has the highest trading activity occurred?
- Where did buyers and sellers agree the most (High Volume Nodes – HVNs)?
- Where did price move quickly due to low participation (Low Volume Nodes – LVNs)?
### 5.2 Implementation in the Script
Executed only when `show_vp` is enabled and on the last bar:
1. The last `vp_lookback` bars (default 150) are processed.
2. The minimum low and maximum high over this window define the price range.
3. This price range is divided into `vp_rows` segments (e.g., 30 rows).
4. For each row:
- All bars are scanned.
- If the mid-price `(high + low ) / 2` falls inside a row, that bar’s volume is added to the row total.
5. The row with the greatest volume is stored as `max_vol_idx` (the POC row).
6. For each row, a volume box is drawn on the right side of the chart.
### 5.3 Color Scheme
- Semi-transparent Orange
- The row with the maximum volume – the Point of Control (POC).
- Represents the strongest support/resistance level from a volume perspective.
- Semi-transparent Blue
- Other volume rows.
- The taller the bar → the higher the volume → the stronger the interest at that price band.
### 5.4 Trading Applications
- If price is above POC and retraces back into it:
→ POC often acts as support, suitable for long setups.
- If price is below POC and rallies into it:
→ POC often acts as resistance, suitable for short setups or profit-taking.
HVNs (Tall Blue Bars)
- Represent areas of equilibrium where the market has spent time and traded heavily.
- Price tends to consolidate here before choosing a direction.
LVNs (Short or Nearly Empty Bars)
- Represent low participation zones.
- Price often moves quickly through these areas – useful for targeting fast moves.
## Chapter 6 – Wyckoff Helper – Spring
### 6.1 Spring Concept
In the Wyckoff framework:
- A Spring is a false break of support.
- The market briefly trades below a well-defined support level, triggers stop losses,
then sharply reverses upward as institutional buyers absorb liquidity.
This movement:
- Clears out weak hands (retail sellers).
- Provides large players with liquidity to enter long positions.
- Often initiates a new uptrend.
### 6.2 Code Logic
Conditions for a Spring:
1. The current low is lower than the lowest low of the previous 50 bars
→ apparent break of a long-standing support.
2. The bar closes bullish (Close > Open)
→ the breakdown was rejected.
3. Volume is significantly elevated:
→ `volume > 2 × volume_MA` (Ultra Volume).
When all conditions are met and `show_wyc` is enabled:
- A pink diamond is plotted below the bar,
- With the label “Spring” – one of the strongest long signals in this system.
### 6.3 Trading Use
- After a valid Spring, markets frequently enter a meaningful bullish phase.
- The highest quality setups occur when:
- The Spring forms inside a green Order Block, and
- Near or on the Volume Profile POC.
Entries:
- At the close of the Spring bar, or
- On the first pullback into the mid-range of the Spring candle.
Stop-loss:
- Slightly below the Spring’s lowest point (wick low plus a small buffer).
## Chapter 7 – Confluence Engine & Dashboard
### 7.1 Scoring Logic
For each bar, the script:
1. Resets `score` to 0.
2. Adjusts the score based on different signals.
SMC Contribution
if show_smc
if is_in_demand
score += 1
if is_in_supply
score -= 1
- Being in Demand → `+1`
- Being in Supply → `-1`
DCA Contribution
if show_dca
if dca_buy
score += 2
if dca_sell
score -= 2
- DCA Buy → `+2` (strong, statistically driven long signal)
- DCA Sell → `-2`
Wyckoff Spring Contribution
if show_wyc
if wyc_spring
score += 2
- Spring → `+2` (entry of strong money)
### 7.2 Mapping Score to Dashboard Signal
- score ≥ 2 → STRONG LONG 🚀
Multiple bullish conditions aligned.
- score = 1 → WEAK LONG ↗
Some bullish bias, but only one layer clearly positive.
- score = 0 → NEUTRAL / WAIT
Rough balance between buying and selling forces; staying flat is usually preferable.
- score = -1 → WEAK SHORT ↘
Mild bearish bias, suited for cautious or short-term plays.
- score ≤ -2 → STRONG SHORT 🩸
Convergence of several bearish signals.
### 7.3 Dashboard Structure
The dashboard is a two-column table:
- Row 0
- Column 0: `"Mars Signals"` – black background, white text.
- Column 1: `"UIS v3.0"` – black background, yellow text.
- Row 1
- Column 0: `"Price:"` (light grey background).
- Column 1: current closing price (`close`) with a semi-transparent blue background.
- Row 2
- Column 0: `"SMC:"`
- Column 1:
- `"ON"` (green) if `show_smc = true`
- `"OFF"` (grey) otherwise.
- Row 3
- Column 0: `"DCA:"`
- Column 1:
- `"ON"` (green) if `show_dca = true`
- `"OFF"` (grey) otherwise.
- Row 4
- Column 0: `"Signal:"`
- Column 1: signal text (`status_txt`) with background color `status_col`
(green, red, teal, maroon, etc.)
- If `show_rec = false`, these cells are cleared.
## Chapter 8 – Visual Legend (Colors, Shapes & Actions)
For quick reading inside TradingView, the visual elements are described line by line instead of a table.
Chart Element: Green Box
Color / Shape: Transparent green rectangle
Core Meaning: Bullish Order Block (Demand Zone)
Suggested Trader Response: Look for longs, Smart DCA adds, closing or reducing shorts.
Chart Element: Red Box
Color / Shape: Transparent red rectangle
Core Meaning: Bearish Order Block (Supply Zone)
Suggested Trader Response: Look for shorts, or take profit on existing longs.
Chart Element: Yellow Area
Color / Shape: Transparent yellow zone
Core Meaning: Bullish FVG / upside imbalance
Suggested Trader Response: Short take-profit zone or expected rebalance area.
Chart Element: Purple Area
Color / Shape: Transparent purple zone
Core Meaning: Bearish FVG / downside imbalance
Suggested Trader Response: Long take-profit zone or temporary supply region.
Chart Element: Green "DCA" Label
Color / Shape: Green label with white text, plotted below the candle
Core Meaning: Smart ladder-in buy zone, DCA buy opportunity
Suggested Trader Response: Spot DCA entry, partial short exit.
Chart Element: Red "SELL" Label
Color / Shape: Red label with white text, plotted above the candle
Core Meaning: Overbought / distribution zone
Suggested Trader Response: Take profit on longs, consider initiating shorts.
Chart Element: Light Green Background (bgcolor)
Color / Shape: Very transparent light-green background behind bars
Core Meaning: Active DCA Buy zone
Suggested Trader Response: Treat as a discount zone on the chart.
Chart Element: Orange Bar on Right
Color / Shape: Transparent orange horizontal bar in the volume profile
Core Meaning: POC – price with highest traded volume
Suggested Trader Response: Strong support or resistance; key reference level.
Chart Element: Blue Bars on Right
Color / Shape: Transparent blue horizontal bars in the volume profile
Core Meaning: Other volume levels, showing high-volume and low-volume nodes
Suggested Trader Response: Use to identify balance zones (HVN) and fast-move corridors (LVN).
Chart Element: Pink "Spring" Diamond
Color / Shape: Pink diamond with white text below the candle
Core Meaning: Wyckoff Spring – liquidity grab and potential major bullish reversal
Suggested Trader Response: One of the strongest long signals in the suite; look for high-quality long setups with tight risk.
Chart Element: STRONG LONG in Dashboard
Color / Shape: Green background, white text in the Signal row
Core Meaning: Multiple bullish layers in confluence
Suggested Trader Response: Consider initiating or increasing longs with strict risk management.
Chart Element: STRONG SHORT in Dashboard
Color / Shape: Red background, white text in the Signal row
Core Meaning: Multiple bearish layers in confluence
Suggested Trader Response: Consider initiating or increasing shorts with a logical, well-placed stop.
## Chapter 9 – Timeframe-Based Trading Playbook
### 9.1 Timeframe Selection
- Scalping
- Timeframes: 1M, 5M, 15M
- Objective: fast intraday moves (minutes to a few hours).
- Recommendation: focus on SMC + Wyckoff.
Smart DCA on very low timeframes may introduce excessive noise.
- Day Trading
- Timeframes: 15M, 1H, 4H
- Provides a good balance between signal quality and frequency.
- Recommendation: use the full stack – SMC + DCA + Volume Profile + Wyckoff + Dashboard.
- Swing Trading & Position Investing
- Timeframes: Daily, Weekly
- Emphasis on Smart DCA + Volume Profile.
- SMC and Wyckoff are used mainly to fine-tune swing entries within larger trends.
### 9.2 Scenario A – Scalping Long
Example: 5-Minute Chart
1. Price is declining into a green OB (Bullish Demand).
2. A candle with a long lower wick and bullish close (Pin Bar / Rejection) forms inside the OB.
3. A Spring diamond appears below the same candle → very strong confluence.
4. The Dashboard shows at least WEAK LONG ↗, ideally STRONG LONG 🚀.
5. Entry:
- On the close of the confirmation candle, or
- On the first pullback into the mid-range of that candle.
6. Stop-loss:
- Slightly below the OB.
7. Targets:
- Nearby bearish FVG above, and/or
- The next red OB.
### 9.3 Scenario B – Day-Trading Short
Recommended Timeframes: 1H or 4H
1. The market completes a strong impulsive move upward.
2. Price enters a red Order Block (Supply).
3. In the same zone, a purple FVG appears or remains unfilled.
4. On a lower timeframe (e.g., 15M), RSI enters overbought territory and a DCA Sell signal appears.
5. The main timeframe Dashboard (1H) shows WEAK SHORT ↘ or STRONG SHORT 🩸.
Trade Plan
- Open a short near the upper boundary of the red OB.
- Place the stop above the OB or above the last swing high.
- Targets:
- A yellow FVG lower on the chart, and/or
- The next green OB (Demand) below.
### 9.4 Scenario C – Swing / Investment with Smart DCA
Timeframes: Daily / Weekly
1. On the daily or weekly chart, each time a green “DCA” label appears:
- Allocate a fixed fraction of your capital (e.g., 3–5%) to that asset.
2. Check whether this DCA zone aligns with the orange POC of the Volume Profile:
- If yes → the quality of the entry zone is significantly higher.
3. If the DCA signal sits inside a daily green OB, the probability of a medium-term bottom increases.
4. Always build the position laddered, never all-in at a single price.
Exits for investors:
- Near weekly red OBs or large purple FVG zones.
- Ideally via partial profit-taking rather than closing 100% at once.
### 9.5 Case Study 1 – BTCUSDT (15-Minute)
- Context: Price has sold off down towards 65,000 USD.
- A green OB had previously formed at that level.
- Near the lower boundary of this OB, a partially filled yellow FVG is present.
- As price returns to this region, a Spring appears.
- The Dashboard shifts from NEUTRAL / WAIT to WEAK LONG ↗.
Plan
- Enter a long near the OB low.
- Place stop below the Spring low.
- First target: a purple FVG around 66,200.
- Second (optional) target: the first red OB above that level.
### 9.6 Case Study 2 – Meme Coin (PEPE – 4H)
- After a strong pump, price enters a corrective phase.
- On the 4H chart, RSI drops below 30; price breaks below the lower Bollinger Band → a DCA label prints.
- The Volume Profile shows the POC at approximately the same level.
- The Dashboard displays STRONG LONG 🚀.
Plan
- Execute laddered buys in the combined DCA + POC zone.
- Place a protective stop below the last significant swing low.
- Target: an expected 20–30% upside move towards the next red OB or purple FVG.
## Chapter 10 – Risk Management, Psychology & Advanced Tuning
### 10.1 Risk Management
No signal, regardless of its strength, replaces risk control.
Recommendations:
- In futures, do not expose more than 1–3% of account equity to risk per trade.
- Adjust leverage to the volatility of the instrument (lower leverage for highly volatile altcoins).
- Place stop-losses in zones where the idea is clearly invalidated:
- Below/above the relevant Order Block or Spring, not randomly in the middle of the structure.
### 10.2 Market-Specific Parameter Tuning
- Calmer Markets (e.g., major FX pairs)
- `ob_period`: 3–5.
- `bb_mult`: 2.0 is usually sufficient.
- Highly Volatile Markets (Crypto, news-driven assets)
- `ob_period`: 7–10 to highlight only the most robust OBs.
- `bb_mult`: 2.5–3.0 so that only extreme deviations trigger DCA.
- `vol_ma_len`: increase (e.g., to ~30) so that Spring triggers only on truly exceptional
volume spikes.
### 10.3 Trading Psychology
- STRONG LONG 🚀 does not mean “risk-free”.
It means the probability of a successful long, given the model’s logic, is higher than average.
- Treat Mars Signals as a confirmation and context system, not a full replacement for your own decision-making.
- Example of disciplined thinking:
- The Dashboard prints STRONG LONG,
- But price is simultaneously testing a multi-month macro resistance or a major negative news event is imminent,
- In such cases, trade smaller, widen stops appropriately, or skip the trade.
## Chapter 11 – Technical Notes & FAQ
### 11.1 Does the Script Repaint?
- Order Blocks and Springs are based on completed pivot structures and confirmed candles.
- Until a pivot is confirmed, an OB does not exist; after confirmation, behavior is stable under classic SMC assumptions.
- The script is designed to be structurally consistent rather than repainting signals arbitrarily.
### 11.2 Computational Load of Volume Profile
- On the last bar, the script processes up to `vp_lookback` bars × `vp_rows` rows.
- On very low timeframes with heavy zooming, this can become demanding.
- If you experience performance issues:
- Reduce `vp_lookback` or `vp_rows`, or
- Temporarily disable Volume Profile (`show_vp = false`).
### 11.3 Multi-Timeframe Behavior
- This version of the script is not internally multi-timeframe.
All logic (OB, DCA, Spring, Volume Profile) is computed on the active timeframe only.
- Practical workflow:
- Analyze overall structure and key zones on higher timeframes (4H / Daily).
- Use lower timeframes (15M / 1H) with the same tool for timing entries and exits.
## Conclusion
Mars Signals – Ultimate Institutional Suite v3.0 (Joker) is a multi-layer trading framework that unifies:
- Price structure (Order Blocks & FVG),
- Statistical behavior (Smart DCA via RSI + Bollinger),
- Volume distribution by price (Volume Profile with POC, HVN, LVN),
- Liquidity events (Wyckoff Spring),
into a single, coherent system driven by a transparent Confluence Scoring Engine.
The final output is presented in clear, actionable language:
> STRONG LONG / WEAK LONG / NEUTRAL / WEAK SHORT / STRONG SHORT
The system is designed to support professional decision-making, not to replace it.
Used together with strict risk management and disciplined execution,
Mars Signals – UIS v3.0 (Joker) can serve as a central reference manual and operational guide
for your trading workflow, from scalping to swing and investment positioning.

ROBUST iFVG [SurgeGuru]The FVG/iFVG Robust Lifecycle indicator is a sophisticated market structure tool that moves beyond simple gap detection. It tracks the complete narrative of a Fair Value Gap—from its creation as a market imbalance to its resolution and the establishment of a new equilibrium zone. This dual-phase, institutional-grade approach provides a dynamic map of support and resistance, offering a profound edge in predicting price behavior.
Core Concept: The Two-Phase Lifecycle
The indicator is built on the principle that a Fair Value Gap has two distinct lives:
Phase 1: The Imbalance (FVG)
What it is: A rapid price move that leaves behind a "gap" or "void" with no trading activity.
Market Implication: Represents a moment of intense buying or selling pressure, creating an inefficient area price is statistically likely to return to.
Phase 2: The Equilibrium (iFVG)
What it is: A powerful support/resistance zone that forms the instant the original FVG is filled.
Market Implication: Represents the market's new consensus of "fair value" after the initial imbalance has been arbitraged away. This is often where institutional order flow resides for the next significant move.
Differentiators & "Robust" Features
Lifecycle Tracking: Unlike basic FVG tools that disappear once filled, this indicator captures the subsequent, often more important, iFVG phase.
Configurable Longevity: Offers two professional methods for managing iFVG lifespan (Full Cross or Number of Bars), preventing chart clutter while preserving relevant levels.
Advanced Alerting: Provides separate, configurable alerts for both FVG creation and iFVG formation, allowing traders to anticipate both the fill of an imbalance and the reaction at the new equilibrium.
Visual Hierarchy: Uses distinct, customizable colors and borders to instantly communicate the difference between an active imbalance (FVG) and an active decision zone (iFVG).
Code Architecture & How It Works
The script is a state management system built around two primary arrays that track the lifecycle of detected gaps.
1. Core Data Structures
The entire system is powered by parallel arrays that maintain the state of each detected zone:
FVG Arrays (Tracks Phase 1 - The Imbalance):
fvg_boxes : Stores the drawing object for each FVG.
fvg_top & fvg_bot : Store the price boundaries of the gap.
fvg_is_bull : Stores whether the FVG is bullish or bearish.
fvg_mitigated : The core state flag; becomes true when the FVG is filled, triggering the creation of an iFVG.
iFVG Arrays (Tracks Phase 2 - The Equilibrium):
ifvg_boxes : Stores the drawing object for each Inverse FVG.
ifvg_top & ifvg_bot : Inherits the price values from the parent FVG.
ifvg_is_bull : Is the inverse of the parent FVG's bias.
ifvg_original_fvg_index : Maintains a link back to the parent FVG for advanced management.
2. The Operational Workflow (Step-by-Step)
On every new bar, the script executes the following sequence:
STEP A: FVG Detection
The script checks for the 3-bar FVG pattern:
bullish_fvg = low > high (Current low is above the high from two bars ago)
bearish_fvg = high < low (Current high is below the low from two bars ago)
Upon detection, it creates a new box and pushes all its properties (price levels, bullish flag, etc.) into the FVG Arrays.
STEP B: FVG Management & Mitigation Check
The script iterates through all active FVGs in the fvg_boxes array.
For each FVG, it checks if the current price has "mitigated" (filled) the gap:
A Bullish FVG is mitigated if the current bar's low (body_low) crosses below the FVG's bottom boundary (bot_val).
A Bearish FVG is mitigated if the current bar's high (body_high) crosses above the FVG's top boundary (top_val).
If mitigation occurs, the script sets the FVG's fvg_mitigated flag to true.
STEP C: iFVG Creation (The Phase Transition)
The moment an FVG's fvg_mitigated flag is set to true, the script immediately creates a new iFVG.
It takes the exact same price levels from the parent FVG but inverts the bias (a mitigated Bullish FVG creates a Bearish iFVG, and vice versa).
It draws a new box with the user-defined iFVG color and border, and pushes all its properties into the iFVG Arrays.
STEP D: iFVG Lifecycle Management
The script iterates through all active iFVGs.
Depending on the user's setting, it manages the iFVG's lifespan:
Full Cross Mode: The iFVG remains active until price fully crosses through it again. Once crossed, the iFVG and its parent FVG are permanently deleted.
Number of Bars Mode: The iFVG remains visible for a fixed number of bars after its creation, then is automatically deactivated.
STEP E: Cleanup & Garbage Collection
The script constantly manages the visibility of boxes based on user toggles (show_normal_fvg, show_ifvg). If a feature is turned off, the boxes are not deleted but made transparent, allowing for fast performance and instant reactivation.
3. Alert System Architecture
The alert system is integrated into the state transitions:
FVG Alerts fire during STEP A (on creation).
iFVG Alerts fire during STEP C (on creation, which is the moment of FVG mitigation).
iFVG Mitigation Alerts fire during STEP D (when an iFVG is removed in Full Cross mode).
Conclusion
The FVG/iFVG Robust Lifecycle is not a mere indicator; it is a state-aware market analysis engine. By architecting a system that tracks the entire lifecycle of a price gap, it provides a dynamic, self-cleaning map of market imbalance and subsequent equilibrium. This offers a systematic framework for identifying high-probability support/resistance zones, making it an indispensable tool for discerning the underlying structure of price action.
Credits: TONO . this robust system was upgraded from his code.

iFVG Strategie by Futures.RobbyiFVG Strategy Checklist by Futures.Robby
Updated: October 27, 2025
Description
This script is a manual checklist designed to help traders evaluate their setups based on the iFVG (Fair Value Gap) strategy. It serves solely as a visual aid and does not perform automatic analysis, signal generation, or trade execution.
How It Works
The script creates an interactive checklist directly on the chart. Traders manually select which criteria are met, and the script calculates a percentage score, displaying it with color coding:
Green (≥ 60%): Good fulfillment of criteria
Orange (40–59%): Partial fulfillment
Red (< 40%): Poor fulfillment
Checklist Criteria
The checklist is divided into two main sections:
1. Trade Criteria (8 Points)
Eight manually selectable criteria to assess setup quality:
Trade im Bias → Trade in Bias: Trade follows the higher timeframe trend (H1/H4/Daily).
BE Level → BE Level: Swing point between entry and target.
Sweep → Sweep: Price hits a key swing before reversing.
Displacement → Displacement: iFVG broken by strong candles.
Leg FVG geschlossen → Leg FVG Closed: No open m1 to m5 FVGs to target.
FVG Reaktion → FVG Reaction: Reaction at FVG during sweep (HTF).
FVG Größe → FVG Size: 6 to 10 points.
Anzahl Kerzen → Number of Candles: Maximum of 6 candles.
2. Goals (1 Point)
Six optional goal conditions, counted together as 1 point:
Equal H / L → Equal High/Low
Session H / L → Session High/Low
News H / L → News High/Low
HTF Swing Point → HTF Swing Point
HTF OB → HTF Order Block
HTF FVG → HTF FVG
Settings and Customization
The script’s settings are translated as follows:
Group: Trade Criteria
Trade im Bias → Trade in Bias
Tooltip: Trendrichtung folgt HTF (H1/H4/Täglich) – Trend follows HTF direction
BE Level → BE Level
Tooltip: Swingpunkt zwischen Einstieg und Ziel – Swing point between entry and target
Sweep → Sweep
Tooltip: Kurs erreicht markanten Swing – Price hits key swing before inverse
Displacement → Displacement
Tooltip: iFVG durch starke Kerzen gebrochen – iFVG broken by strong candles
Leg FVG geschlossen → Leg FVG Closed
Tooltip: Keine offenen m1 bis m5 FVGs bis Ziel – No open m1 to m5 FVGs to target
FVG Reaktion → FVG Reaction
Tooltip: Reaktion an FVG beim Sweep (HTF) – Reaction at FVG during sweep (HTF)
FVG Größe → FVG Size
Tooltip: 6 bis 10 Punkte – 6 to 10 points
Anzahl Kerzen → Number of Candles
Tooltip: Maximal 6 Kerzen – Maximum of 6 candles
Group: Goals
Equal H / L → Equal High/Low
Session H / L → Session High/Low
News H / L → News High/Low
HTF Swing Point → HTF Swing Point
HTF OB → HTF Order Block
HTF FVG → HTF FVG
ℹ️ Ziele zählen gemeinsam als 1 Punkt → ℹ️ Goals count together as 1 point
Window Position & Size
Fensterposition → Window Position
oben rechts → top right
oben links → top left
unten rechts → bottom right
unten links → bottom left
Tabellengröße → Table Size
normal → normal
small → small
tiny → tiny
Translation of Chart Table Contents
The table headers and entries on the chart are translated as follows:
Table Headers:
Trade Checkliste → Trade Checklist
Ziele → Goals
Status Symbols:
✅ → ✅ (Fulfilled)
❌ → ❌ (Not fulfilled)
Individual Criteria (Trade Criteria):
Trade im Bias → Trade in Bias
BE Level → BE Level
Sweep → Sweep
Displacement → Displacement
Leg FVG geschlossen → Leg FVG Closed
FVG Reaktion → FVG Reaction
FVG Größe → FVG Size
Anzahl Kerzen → Number of Candles
Individual Criteria (Goals):
Equal H / L → Equal High/Low
Session H / L → Session High/Low
News H / L → News High/Low
HTF Swing Point → HTF Swing Point
HTF OB → HTF Order Block
HTF FVG → HTF FVG
Note Line:
Ziele zählen gemeinsam als 1 Punkt → Goals count together as 1 point
Important Note
This tool is not an automated indicator, but a visual decision aid for traders who want to apply their strategy in a structured and conscious way.

Smart Money Concepts by WeloTradesThe "Smart Money Concepts by WeloTrades" indicator is designed to offer traders a comprehensive tool that integrates multiple advanced features to aid in market analysis. By combining order blocks, liquidity levels, fair value gaps, trendlines, and market structure analysis, the indicator provides a holistic approach to understanding market dynamics and making informed trading decisions.
Components and Their Integration:
Order Blocks and Breaker Blocks Detection
Functionality: Order blocks represent areas where significant buying or selling occurred, creating potential support or resistance zones. Breaker blocks signal potential reversals.
Integration: By detecting and visualizing these blocks, the indicator helps traders identify key levels where price might react, aiding in entry and exit decisions. The customizable settings allow traders to adjust the visibility and parameters to suit their specific trading strategy.
Liquidity Levels Analysis
Functionality: Liquidity levels indicate zones where significant price movements can occur due to the presence of large orders. These are areas where smart money might be executing trades.
Integration: By tracking these high-probability liquidity areas, traders can anticipate potential price movements. Customizable display limits and mitigation strategies ensure that the information is tailored to the trader’s needs, providing precise and actionable insights.
Fair Value Gaps (FVG)
Functionality: Fair value gaps highlight areas where there is an imbalance between buyers and sellers. These gaps often represent potential trading opportunities.
Integration: The ability to identify and analyze FVGs helps traders spot potential entries based on market inefficiencies. The touch and break detection functionalities provide further refinement, enhancing the precision of trading signals.
Trendlines
Functionality: Trendlines help in identifying the direction of the market and potential reversal points. The additional trendline adds a layer of confirmation for breaks or retests.
Integration: Automatically drawn trendlines assist traders in visualizing market trends and making decisions about potential entries and exits. The additional trendline for stronger confirmation reduces the risk of false signals, providing more reliable trading opportunities.
Market Structure Analysis
Functionality: Understanding market structure is crucial for identifying key support and resistance levels and overall market dynamics. This component displays internal, external, and composite market structures.
Integration: By automatically highlighting shifts in market structure, the indicator helps traders recognize important levels and potential changes in market direction. This analysis is critical for strategic planning and execution in trading.
Customizable Alerts
Functionality: Alerts ensure that traders do not miss significant market events, such as the formation or breach of order blocks, liquidity levels, and trendline interactions.
Integration: Customizable alerts enhance the user experience by providing timely notifications of key events. This feature ensures that traders can act quickly and efficiently, leveraging the insights provided by the indicator.
Interactive Visualization
Functionality: Customizable visual aspects of the indicator allow traders to tailor the display to their preferences and trading style.
Integration: This feature enhances user engagement and usability, making it easier for traders to interpret the data and make informed decisions. Personalization options like colors, styles, and display formats improve the overall effectiveness of the indicator.
How Components Work Together
Comprehensive Market Analysis
Each component of the indicator addresses a different aspect of market analysis. Order blocks and liquidity levels highlight potential support and resistance zones, while fair value gaps and trendlines provide additional context for potential entries and exits. Market structure analysis ties everything together by offering a broad view of market dynamics.
Synergistic Insights
The integration of multiple features allows for cross-validation of trading signals. For instance, an order block coinciding with a high-probability liquidity level and a fair value gap can provide a stronger signal than any of these features alone. This synergy enhances the reliability of the insights and trading signals generated by the indicator.
Enhanced Decision Making
By combining these advanced features into a single tool, traders are equipped with a powerful resource for making informed decisions. The customizable alerts and interactive visualization further support this by ensuring that traders can act quickly on the insights provided.
Order Blocks ( OB) & Breaker Blocks (BB) Visuals:
📝 OB Input Settings
📊 Timeframe #1
TF #1🕑: Enable or disable Timeframe 1.
What it is: A boolean input to toggle the use of the first timeframe.
What it does: Enables or disables Timeframe 1 for the OB settings.
How to use it: Check or uncheck the box to enable or disable.
📊 Timeframe 1 Selection
Timeframe #1🕑: Select the timeframe for Timeframe 1.
What it is: A dropdown to select the desired timeframe.
What it does: Sets the timeframe for Timeframe 1.
How to use it: Choose a timeframe from the dropdown list.
📊 Timeframe #2
TF #2🕑: Enable or disable Timeframe 2.
What it is: A boolean input to toggle the use of the second timeframe.
What it does: Enables or disables Timeframe 2 for the OB settings.
How to use it: Check or uncheck the box to enable or disable.
📊 Timeframe 2 Selection
Timeframe #2🕑: Select the timeframe for Timeframe 2.
What it is: A dropdown to select the desired timeframe.
What it does: Sets the timeframe for Timeframe 2.
How to use it: Choose a timeframe from the dropdown list.
Additional Info: Higher TF Chart & Lower TF Setting / Lower TF Chart & Higher TF Setting.
📏 Show OBs
OB (Length)📏: Toggle the display of Order Blocks.
What it is: A boolean input to enable or disable the display of Order Blocks.
What it does: Shows or hides Order Blocks based on the selected swing length.
How to use it: Check or uncheck the box to enable or disable.
📏 Swing Length Option
Swing Length Option: Select the swing length option.
What it is: A dropdown to choose between SHORT, MID, LONG, or CUSTOM.
What it does: Sets the length of swings for Order Blocks.
How to use it: Choose an option from the dropdown.
Additional Info: Default lengths are SHORT=10, MID=28, LONG=50.
🔧 Custom Swing Length
🔧custom: Specify a custom swing length.
What it is: An integer input for setting a custom swing length.
What it does: Overrides the default swing lengths if set to CUSTOM.
How to use it: Enter a custom integer value (only shown when CUSTOM is selected).
📛 Show BBs
BB (Method)📛: Toggle the display of Breaker Blocks.
What it is: A boolean input to enable or disable the display of Breaker Blocks.
What it does: Shows or hides Breaker Blocks.
How to use it: Check or uncheck the box to enable or disable.
📛 OB End Method
OB End Method: Select the method for determining the end of a Breaker Block.
What it is: A dropdown to choose between Wick and Close.
What it does: Sets the criteria for when a Breaker Block is considered mitigated.
How to use it: Choose an option from the dropdown.
Additional Info: Wicks: OB is mitigated when the price wicks through the OB Level. Close: OB is mitigated when the closing price is within the OB Level.
🔍 Max Bullish Zones
🔍Max Bullish: Set the maximum number of Bullish Order Blocks to display.
What it is: A dropdown to select the maximum number of Bullish Order Blocks.
What it does: Limits the number of Bullish Order Blocks shown on the chart.
How to use it: Choose a value from the dropdown (1-10).
🔍 Max Bearish Zones
🔍Max Bearish: Set the maximum number of Bearish Order Blocks to display.
What it is: A dropdown to select the maximum number of Bearish Order Blocks.
What it does: Limits the number of Bearish Order Blocks shown on the chart.
How to use it: Choose a value from the dropdown (1-10).
🟩 Bullish OB Color
Bullish OB Color: Set the color for Bullish Order Blocks.
What it is: A color picker to set the color of Bullish Order Blocks.
What it does: Changes the color of Bullish Order Blocks on the chart.
How to use it: Select a color from the color picker.
🟥 Bearish OB Color
Bearish OB Color: Set the color for Bearish Order Blocks.
What it is: A color picker to set the color of Bearish Order Blocks.
What it does: Changes the color of Bearish Order Blocks on the chart.
How to use it: Select a color from the color picker.
🔧 OB & BB Range
↔ OB & BB Range: Select the range option for OB and BB.
What it is: A dropdown to choose between RANGE and CUSTOM.
What it does: Sets how far the OB or BB should extend.
How to use it: Choose an option from the dropdown.
Additional Info: RANGE = Current price, CUSTOM = Adjustable Range.
🔧 Custom OB & BB Range
🔧Custom: Specify a custom range for OB and BB.
What it is: An integer input for setting a custom range.
What it does: Defines how far the OB or BB should go, based on a custom value.
How to use it: Enter a custom integer value (range: 1000-500000).
💬 Text Options
💬Text Options: Set text size and color for OB and BB.
What it is: A dropdown to select text size and a color picker to choose text color.
What it does: Changes the size and color of the text displayed for OB and BB.
How to use it: Select a size from the dropdown and a color from the color picker.
💬 Show Timeframe OB
Text: Toggle to display the timeframe of OB.
What it is: A boolean input to show or hide the timeframe text for OB.
What it does: Displays the timeframe information for Order Blocks on the chart.
How to use it: Check or uncheck the box to enable or disable.
💬 Show Volume
Volume: Toggle to display the volume of OB.
What it is: A boolean input to show or hide the volume information for Order Blocks.
What it does: Displays the volume information for Order Blocks on the chart.
How to use it: Check or uncheck the box to enable or disable.
Additional Info:
What it represents: The volume displayed represents the total trading volume that occurred during the formation of the Order Block. This can indicate the level of participation or interest in that price level.
How it's calculated: The volume is the sum of all traded volumes within the candles that form the Order Block.
What it means: Higher volume at an Order Block level may suggest stronger support or resistance. It shows the amount of trading activity and can be an indicator of the potential strength or validity of the Order Block.
Why it's shown: To give traders an idea of the market participation and to help assess the strength of the Order Block.
💬 Show Percentage
%: Toggle to display the percentage of OB.
What it is: A boolean input to show or hide the percentage information for Order Blocks.
What it does: Displays the percentage information for Order Blocks on the chart.
How to use it: Check or uncheck the box to enable or disable.
Additional Info:
What it represents: The percentage displayed usually represents the proportion of price movement relative to the Order Block.
How it's calculated: This can be the percentage move from the start to the end of the Order Block or the retracement level that price has reached relative to the Order Block's range.
What it means: It helps traders understand the extent of price movement within the Order Block and can indicate the significance of the price level.
Why it's shown: To provide a clearer understanding of the price dynamics and the importance of the Order Block within the overall price movement.
Additional Information
Volume Example: If an Order Block forms over three candles with volumes of 100, 150, and 200, the total volume displayed for that Order Block would be 450.
Percentage Example: If the price moves from 100 to 110 within an Order Block, and the total range of the Order Block is from 100 to 120, the percentage shown might be 50% (since the price has moved halfway through the Order Block's range).
Liquidity Levels visuals:
📊 Liquidity Levels Input Settings
📊 Current Timeframe
TF #1🕑: Enable or disable the current timeframe.
What it is: A boolean input to toggle the use of the current timeframe.
What it does: Enables or disables the display of liquidity levels for the current timeframe.
How to use it: Check or uncheck the box to enable or disable.
📊 Higher Timeframe
Higher Timeframe: Select the higher timeframe for liquidity levels.
What it is: A dropdown to select the desired higher timeframe.
What it does: Sets the higher timeframe for liquidity levels.
How to use it: Choose a timeframe from the dropdown list.
📏 Liquidity Length Option
📏Liquidity Length: Select the length for liquidity levels.
What it is: A dropdown to choose between SHORT, MID, LONG, or CUSTOM.
What it does: Sets the length of swings for liquidity levels.
How to use it: Choose an option from the dropdown.
Additional Info: Default lengths are SHORT=10, MID=28, LONG=50.
🔧 Custom Liquidity Length
🔧custom: Specify a custom length for liquidity levels.
What it is: An integer input for setting a custom swing length.
What it does: Overrides the default liquidity lengths if set to CUSTOM.
How to use it: Enter a custom integer value (only shown when CUSTOM is selected).
📛 Mitigation Method
📛Mitigation (Method): Select the method for determining the mitigation of liquidity levels.
What it is: A dropdown to choose between Close and Wick.
What it does: Sets the criteria for when a liquidity level is considered mitigated.
How to use it: Choose an option from the dropdown.
Additional Info:
Wick: Level is mitigated when the price wicks through the level.
Close: Level is mitigated when the closing price is within the level.
📛 Display Mitigated Levels
-: Select to display or hide mitigated levels.
What it is: A dropdown to choose between Remove and Show.
What it does: Displays or hides mitigated liquidity levels.
How to use it: Choose an option from the dropdown.
Additional Info:
Remove: Hide mitigated levels.
Show: Display mitigated levels.
🔍 Max Buy Side Liquidity
🔍Max Buy Side Liquidity: Set the maximum number of Buy Side Liquidity Levels to display.
What it is: An integer input to set the maximum number of Buy Side Liquidity Levels.
What it does: Limits the number of Buy Side Liquidity Levels shown on the chart.
How to use it: Enter a value between 0 and 50.
🟦 Buy Side Liquidity Color
Buy Side Liquidity Color: Set the color for Buy Side Liquidity Levels.
What it is: A color picker to set the color of Buy Side Liquidity Levels.
What it does: Changes the color of Buy Side Liquidity Levels on the chart.
How to use it: Select a color from the color picker.
Additional Info:
Tooltip: Set the maximum number of Buy Side Liquidity Levels to display. Default: 5, Min: 1, Max: 50.
If liquidity levels are not displayed as expected, try increasing the max count.
🔍 Max Sell Side Liquidity
🔍Max Sell Side Liquidity: Set the maximum number of Sell Side Liquidity Levels to display.
What it is: An integer input to set the maximum number of Sell Side Liquidity Levels.
What it does: Limits the number of Sell Side Liquidity Levels shown on the chart.
How to use it: Enter a value between 0 and 50.
🟥 Sell Side Liquidity Color
Sell Side Liquidity Color: Set the color for Sell Side Liquidity Levels.
What it is: A color picker to set the color of Sell Side Liquidity Levels.
What it does: Changes the color of Sell Side Liquidity Levels on the chart.
How to use it: Select a color from the color picker.
Additional Info:
Tooltip: Set the maximum number of Sell Side Liquidity Levels to display. Default: 5, Min: 1, Max: 50.
If liquidity levels are not displayed as expected, try increasing the max count.
✂ Box Style (Height)
✂ Box Style (↕): Set the box height style for liquidity levels.
What it is: A float input to set the height of the boxes.
What it does: Adjusts the height of the boxes displaying liquidity levels.
How to use it: Enter a value between -50 and 50.
Additional Info: Default value is -5.
📏 Box Length
b: Set the box length of liquidity levels.
What it is: An integer input to set the length of the boxes.
What it does: Adjusts the length of the boxes displaying liquidity levels.
How to use it: Enter a value between 0 and 500.
Additional Info: Default value is 20.
⏭ Extend Liquidity Levels
Extend ⏭: Toggle to extend liquidity levels beyond the current range.
What it is: A boolean input to enable or disable the extension of liquidity levels.
What it does: Extends liquidity levels beyond their default range.
How to use it: Check or uncheck the box to enable or disable.
Additional Info: Extend liquidity levels beyond the current range.
💬 Text Options
💬 Text Options: Set text size and color for liquidity levels.
What it is: A dropdown to select text size and a color picker to choose text color.
What it does: Changes the size and color of the text displayed for liquidity levels.
How to use it: Select a size from the dropdown and a color from the color picker.
💬 Show Text
Text: Toggle to display text for liquidity levels.
What it is: A boolean input to show or hide the text for liquidity levels.
What it does: Displays the text information for liquidity levels on the chart.
How to use it: Check or uncheck the box to enable or disable.
💬 Show Volume
Volume: Toggle to display the volume of liquidity levels.
What it is: A boolean input to show or hide the volume information for liquidity levels.
What it does: Displays the volume information for liquidity levels on the chart.
How to use it: Check or uncheck the box to enable or disable.
Additional Info:
What it represents: The volume displayed represents the total trading volume that occurred during the formation of the liquidity level. This can indicate the level of participation or interest in that price level.
How it's calculated: The volume is the sum of all traded volumes within the candles that form the liquidity level.
What it means: Higher volume at a liquidity level may suggest stronger support or resistance. It shows the amount of trading activity and can be an indicator of the potential strength or validity of the liquidity level.
Why it's shown: To give traders an idea of the market participation and to help assess the strength of the liquidity level.
💬 Show Percentage
%: Toggle to display the percentage of liquidity levels.
What it is: A boolean input to show or hide the percentage information for liquidity levels.
What it does: Displays the percentage information for liquidity levels on the chart.
How to use it: Check or uncheck the box to enable or disable.
Additional Info:
What it represents: The percentage displayed usually represents the proportion of price movement relative to the liquidity level.
How it's calculated: This can be the percentage move from the start to the end of the liquidity level or the retracement level that price has reached relative to the liquidity level's range.
What it means: It helps traders understand the extent of price movement within the liquidity level and can indicate the significance of the price level.
Why it's shown: To provide a clearer understanding of the price dynamics and the importance of the liquidity level within the overall price movement.
Fair Value Gaps visuals:
📊 Fair Value Gaps Input Settings
📊 Show FVG
TF #1🕑: Enable or disable Fair Value Gaps for Timeframe 1.
What it is: A boolean input to toggle the display of Fair Value Gaps.
What it does: Shows or hides Fair Value Gaps on the chart.
How to use it: Check or uncheck the box to enable or disable.
📊 Select Timeframe
Timeframe: Select the timeframe for Fair Value Gaps.
What it is: A dropdown to select the desired timeframe.
What it does: Sets the timeframe for Fair Value Gaps.
How to use it: Choose a timeframe from the dropdown list.
Additional Info: Higher TF Chart & Lower TF Setting or Lower TF Chart & Higher TF Setting.
📛 FVG Break Method
📛FVG Break (Method): Select the method for determining when an FVG is mitigated.
What it is: A dropdown to choose between Touch, Wicks, Close, or Average.
What it does: Sets the criteria for when a Fair Value Gap is considered mitigated.
How to use it: Choose an option from the dropdown.
Additional Info:
Touch: FVG is mitigated when the price touches the gap.
Wicks: FVG is mitigated when the price wicks through the gap.
Close: FVG is mitigated when the closing price is within the gap.
Average: FVG is mitigated when the average price (average of high and low) is within the gap.
📛 Show Mitigated FVG
show: Toggle to display mitigated FVGs.
What it is: A boolean input to show or hide mitigated Fair Value Gaps.
What it does: Displays or hides mitigated Fair Value Gaps.
How to use it: Check or uncheck the box to enable or disable.
📛 Fill FVG
Fill: Toggle to fill Fair Value Gaps.
What it is: A boolean input to fill the Fair Value Gaps with color.
What it does: Adds a color fill to the Fair Value Gaps.
How to use it: Check or uncheck the box to enable or disable.
📛 Shade FVG
Shade: Toggle to shade Fair Value Gaps.
What it is: A boolean input to shade the Fair Value Gaps.
What it does: Adds a shade effect to the Fair Value Gaps.
How to use it: Check or uncheck the box to enable or disable.
Additional Info: Select the method to break FVGs and toggle the visibility of FVG Breaks (fill FVG and/or shade FVG).
🔍 Max Bullish FVG
🔍Max Bullish FVG: Set the maximum number of Bullish Fair Value Gaps to display.
What it is: An integer input to set the maximum number of Bullish Fair Value Gaps.
What it does: Limits the number of Bullish Fair Value Gaps shown on the chart.
How to use it: Enter a value between 0 and 50.
🔍 Max Bearish FVG
🔍Max Bearish FVG: Set the maximum number of Bearish Fair Value Gaps to display.
What it is: An integer input to set the maximum number of Bearish Fair Value Gaps.
What it does: Limits the number of Bearish Fair Value Gaps shown on the chart.
How to use it: Enter a value between 0 and 50.
🟥 Bearish FVG Color
Bearish FVG Color: Set the color for Bearish Fair Value Gaps.
What it is: A color picker to set the color of Bearish Fair Value Gaps.
What it does: Changes the color of Bearish Fair Value Gaps on the chart.
How to use it: Select a color from the color picker.
Additional Info:
Tooltip: Set the maximum number of Bearish Fair Value Gaps to display. Default: 5, Min: 1, Max: 50.
If Fair Value Gaps are not displayed as expected, try increasing the max count.
🟦 Bullish FVG Color
Bullish FVG Color: Set the color for Bullish Fair Value Gaps.
What it is: A color picker to set the color of Bullish Fair Value Gaps.
What it does: Changes the color of Bullish Fair Value Gaps on the chart.
How to use it: Select a color from the color picker.
Additional Info:
Tooltip: Set the maximum number of Bullish Fair Value Gaps to display. Default: 5, Min: 1, Max: 50.
If Fair Value Gaps are not displayed as expected, try increasing the max count.
📏 FVG Range
↔ FVG Range: Set the range for Fair Value Gaps.
What it is: An integer input to set the range of the Fair Value Gaps.
What it does: Adjusts the range of the Fair Value Gaps displayed.
How to use it: Enter a value between 0 and 100.
Additional Info: Adjustable length only works when both RANGE & EXTEND display OFF. Range=current price, Extend=Full Range.
⏭ Extend FVG
Extend⏭: Toggle to extend Fair Value Gaps beyond the current range.
What it is: A boolean input to enable or disable the extension of Fair Value Gaps.
What it does: Extends Fair Value Gaps beyond their default range.
How to use it: Check or uncheck the box to enable or disable.
⏯ FVG Range
Range⏯: Toggle the range of Fair Value Gaps.
What it is: A boolean input to enable or disable the range display for Fair Value Gaps.
What it does: Sets the range of Fair Value Gaps displayed.
How to use it: Check or uncheck the box to enable or disable.
↕ Max Width
↕ Max Width: Set the maximum width of Fair Value Gaps.
What it is: A float input to set the maximum width of Fair Value Gaps.
What it does: Limits the width of Fair Value Gaps as a percentage of the price range.
How to use it: Enter a value between 0 and 5.0.
Additional Info: FVGs wider than this value will be ignored.
♻ Filter FVG
Filter FVG ♻: Toggle to filter out small Fair Value Gaps.
What it is: A boolean input to filter out small Fair Value Gaps.
What it does: Ignores Fair Value Gaps smaller than the specified max width.
How to use it: Check or uncheck the box to enable or disable.
➖ Mid Line Style
➖Mid Line Style: Select the style of the mid line for Fair Value Gaps.
What it is: A dropdown to choose between Solid, Dashed, or Dotted.
What it does: Sets the style of the mid line within Fair Value Gaps.
How to use it: Choose an option from the dropdown.
🎨 Mid Line Color
Mid Line Color: Set the color for the mid line within Fair Value Gaps.
What it is: A color picker to set the color of the mid line.
What it does: Changes the color of the mid line within Fair Value Gaps.
How to use it: Select a color from the color picker.
Additional Information
Mitigation Methods: Each method (Touch, Wicks, Close, Average) provides different criteria for when a Fair Value Gap is considered mitigated, helping traders to understand the dynamics of price movements within gaps.
Volume and Percentage: Displaying volume and percentage information for Fair Value Gaps helps traders gauge the strength and significance of these gaps in relation to trading activity and price movements.
Trendlines visuals:
📊 Trendlines Input Settings
📊 Show Trendlines
Trendlines & Trendlines Difference(%) ↕: Enable or disable trendlines and set the percentage difference from the first trendline.
What it is: A boolean input to toggle the display of trendlines.
What it does: Shows or hides trendlines on the chart and allows setting a percentage difference from the first trendline.
How to use it: Check or uncheck the box to enable or disable.
Additional Info: The percentage difference determines the distance of the second trendline from the first one.
📏 Trendline Length Option
📏Trendline Length: Select the length for trendlines.
What it is: A dropdown to choose between SHORT, MID, LONG, or CUSTOM.
What it does: Sets the length of trendlines.
How to use it: Choose an option from the dropdown.
Additional Info: Default lengths are SHORT=50, MID=100, LONG=200.
🔧 Custom Trendline Length
🔧custom: Specify a custom length for trendlines.
What it is: An integer input for setting a custom trendline length.
What it does: Overrides the default trendline lengths if set to CUSTOM.
How to use it: Enter a custom integer value (only shown when CUSTOM is selected).
🔍 Max Bearish Trendlines
🔍Max Trendlines Bearish: Set the maximum number of bearish trendlines to display.
What it is: A dropdown to select the maximum number of bearish trendlines.
What it does: Limits the number of bearish trendlines shown on the chart.
How to use it: Choose a value from the dropdown (2-20).
🟩 Bearish Trendline Color
Bearish Trendline Color: Set the color for bearish trendlines.
What it is: A color picker to set the color of bearish trendlines.
What it does: Changes the color of bearish trendlines on the chart.
How to use it: Select a color from the color picker.
Additional Info: Adjust to control how many bearish trendlines are displayed.
🔍 Max Bullish Trendlines
🔍Max Trendlines Bullish: Set the maximum number of bullish trendlines to display.
What it is: A dropdown to select the maximum number of bullish trendlines.
What it does: Limits the number of bullish trendlines shown on the chart.
How to use it: Choose a value from the dropdown (2-20).
🟥 Bullish Trendline Color
Bullish Trendline Color: Set the color for bullish trendlines.
What it is: A color picker to set the color of bullish trendlines.
What it does: Changes the color of bullish trendlines on the chart.
How to use it: Select a color from the color picker.
Additional Info: Adjust to control how many bullish trendlines are displayed.
📐 Degrees Text
📐Degrees ° (💬 Size): Enable or disable degrees text and set its size and color.
What it is: A boolean input to show or hide the degrees text for trendlines.
What it does: Displays the degrees text for trendlines.
How to use it: Check or uncheck the box to enable or disable.
📏 Text Size for Degrees
Text Size: Set the text size for degrees on trendlines.
What it is: A dropdown to select the size of the degrees text.
What it does: Changes the size of the degrees text displayed for trendlines.
How to use it: Choose a size from the dropdown (XS, S, M, L, XL).
🎨 Degrees Text Color
Degrees Text Color: Set the color for the degrees text on trendlines.
What it is: A color picker to set the color of the degrees text.
What it does: Changes the color of the degrees text on the chart.
How to use it: Select a color from the color picker.
♻ Filter Degrees
♻ Filter Degrees °: Enable or disable angle filtering and set the angle range.
What it is: A boolean input to filter trendlines by their angle.
What it does: Shows only trendlines within a specified angle range.
How to use it: Check or uncheck the box to enable or disable.
Additional Info: Angles outside this range will be filtered out.
🔢 Angle Range
Angle Range: Set the angle range for filtering trendlines.
What it is: Two float inputs to set the minimum and maximum angle for trendlines.
What it does: Defines the range of angles for which trendlines will be shown.
How to use it: Enter values for the minimum and maximum angles.
➖ Line Style
➖Style #1 & #2: Select the style of the primary and secondary trendlines.
What it is: Two dropdowns to choose between Solid, Dashed, or Dotted for the trendlines.
What it does: Sets the style of the primary and secondary trendlines.
How to use it: Choose a style from each dropdown.
📏 Line Thickness
: Set the thickness for the trendlines.
What it is: An integer input to set the thickness of the trendlines.
What it does: Adjusts the thickness of the trendlines displayed on the chart.
How to use it: Enter a value between 1 and 5.
Additional Information
Trendline Percentage Difference: Setting a percentage difference helps in analyzing the relative position and angle of trendlines.
Filtering by Angle: This feature allows focusing on trendlines within a specific angle range, enhancing the clarity of trend analysis.
BOS & CHOCH Market Structure visuals:
📊 BOS & CHOCH Market Structure Input Settings
📏 Market Structure Length Option
📏Market Structure: Select the market structure length option.
What it is: A dropdown to choose between INTERNAL, EXTERNAL, ALL, CUSTOM, or NONE.
What it does: Sets the type of market structure to be displayed.
How to use it: Choose an option from the dropdown.
Additional Info:
INTERNAL: Only internal structure.
EXTERNAL: Only external structure.
ALL: Both internal and external structures.
CUSTOM: Custom lengths.
NONE: No structure.
🔧 Custom Internal Length
🔧Custom Internal: Specify a custom length for internal market structure.
What it is: An integer input for setting a custom internal length.
What it does: Defines the length of internal market structures if CUSTOM is selected.
How to use it: Enter a custom integer value (only shown when CUSTOM is selected).
💬 Internal Label Size
💬Internal Label Size: Set the label size for internal market structures.
What it is: A dropdown to select the size of the labels.
What it does: Changes the size of the labels for internal market structures.
How to use it: Choose a size from the dropdown (XS, S, M, L, XL).
🟩 Internal Bullish Color
Internal Bullish Color: Set the color for bullish internal market structures.
What it is: A color picker to set the color of bullish internal market structures.
What it does: Changes the color of bullish internal market structures on the chart.
How to use it: Select a color from the color picker.
🟥 Internal Bearish Color
Internal Bearish Color: Set the color for bearish internal market structures.
What it is: A color picker to set the color of bearish internal market structures.
What it does: Changes the color of bearish internal market structures on the chart.
How to use it: Select a color from the color picker.
🔧 Custom External Length
🔧Custom External: Specify a custom length for external market structure.
What it is: An integer input for setting a custom external length.
What it does: Defines the length of external market structures if CUSTOM is selected.
How to use it: Enter a custom integer value (only shown when CUSTOM is selected).
💬 External Label Size
💬External Label Size: Set the label size for external market structures.
What it is: A dropdown to select the size of the labels.
What it does: Changes the size of the labels for external market structures.
How to use it: Choose a size from the dropdown (XS, S, M, L, XL).
🟩 External Bullish Color
External Bullish Color: Set the color for bullish external market structures.
What it is: A color picker to set the color of bullish external market structures.
What it does: Changes the color of bullish external market structures on the chart.
How to use it: Select a color from the color picker.
🟥 External Bearish Color
External Bearish Color: Set the color for bearish external market structures.
What it is: A color picker to set the color of bearish external market structures.
What it does: Changes the color of bearish external market structures on the chart.
How to use it: Select a color from the color picker.
📐 Show Equal Highs and Lows
EQL & EQH📐: Toggle visibility for equal highs and lows.
What it is: A boolean input to show or hide equal highs and lows.
What it does: Displays or hides equal highs and lows on the chart.
How to use it: Check or uncheck the box to enable or disable.
📏 Equal Highs and Lows Threshold
Equal Highs and Lows Threshold: Set the threshold for equal highs and lows.
What it is: A float input to set the threshold for equal highs and lows.
What it does: Defines the range within which highs and lows are considered equal.
How to use it: Enter a value between 0 and 10.
💬 Label Size for Equal Highs and Lows
💬Label Size for Equal Highs and Lows: Set the label size for equal highs and lows.
What it is: A dropdown to select the size of the labels.
What it does: Changes the size of the labels for equal highs and lows.
How to use it: Choose a size from the dropdown (XS, S, M, L, XL).
🟩 Bullish Color for Equal Highs and Lows
Bullish Color for Equal Highs and Lows: Set the color for bullish equal highs and lows.
What it is: A color picker to set the color of bullish equal highs and lows.
What it does: Changes the color of bullish equal highs and lows on the chart.
How to use it: Select a color from the color picker.
🟥 Bearish Color for Equal Highs and Lows
Bearish Color for Equal Highs and Lows: Set the color for bearish equal highs and lows.
What it is: A color picker to set the color of bearish equal highs and lows.
What it does: Changes the color of bearish equal highs and lows on the chart.
How to use it: Select a color from the color picker.
📏 Show Swing Points
Swing Points📏: Toggle visibility for swing points.
What it is: A boolean input to show or hide swing points.
What it does: Displays or hides swing points on the chart.
How to use it: Check or uncheck the box to enable or disable.
📏 Swing Points Length Option
Swing Points Length Option: Select the length for swing points.
What it is: A dropdown to choose between SHORT, MID, LONG, or CUSTOM.
What it does: Sets the length of swing points.
How to use it: Choose an option from the dropdown.
Additional Info: Default lengths are SHORT=10, MID=28, LONG=50.
💬 Swing Points Label Size
💬Swing Points Label Size: Set the label size for swing points.
What it is: A dropdown to select the size of the labels.
What it does: Changes the size of the labels for swing points.
How to use it: Choose a size from the dropdown (XS, S, M, L, XL).
🎨 Swing Points Color
Swing Points Color: Set the color for swing points.
What it is: A color picker to set the color of swing points.
What it does: Changes the color of swing points on the chart.
How to use it: Select a color from the color picker.
🔧 Custom Swing Points Length
🔧Custom Swings: Specify a custom length for swing points.
What it is: An integer input for setting a custom length for swing points.
What it does: Defines the length of swing points if CUSTOM is selected.
How to use it: Enter a custom integer value (only shown when CUSTOM is selected).
Additional Information
Market Structure Types: Understanding internal and external structures helps in analyzing different market behaviors.
Equal Highs and Lows: This feature identifies areas where price action is balanced, which can be significant for trading strategies.
Swing Points: Highlighting swing points aids in recognizing significant market reversals or continuations.
Benefits
Enhance your trading strategy by visualizing smart money's influence on price movements.
Make informed decisions with real-time data on significant market structures.
Reduce manual analysis with automated detection of key trading signals.
Ideal For
Traders looking for an edge in forex, equities, and cryptocurrency markets by understanding the underlying forces driving market dynamics.
Acknowledgements
Special thanks to these amazing creators for inspiration and their creations:
I want to thank these amazing creators for creating there amazing indicators , that inspired me and also gave me a head start by making this indicator! Without their amazing indicators it wouldn't be possible!
Flux Charts: Volumized Order Blocks
LuxAlgo: Trend Lines
UAlgo: Fair Value Gaps (FVG)
By Leviathan: Market Structure
Sonarlab: Liquidity Levels
Note
Remember to always backtest the indicator first before integrating it into your strategy! For any questions about the indicator, please feel free to ask for assistance.

Advanced Smart Trading Suite with OTE═══════════════════════════════════════
ADVANCED SMART TRADING SUITE WITH OPTIMAL TRADE ENTRY
═══════════════════════════════════════
A comprehensive institutional trading system combining multiple advanced concepts including multi-timeframe liquidity analysis, order blocks, fair value gaps, and optimal trade entry zones. Features optional anti-repainting controls for confirmed signal generation.
───────────────────────────────────────
WHAT THIS INDICATOR DOES
───────────────────────────────────────
This all-in-one trading suite provides:
- Multi-Timeframe Liquidity Detection - HTF (Higher Timeframe), LTF (Lower Timeframe), and current timeframe liquidity sweep identification
- Order Blocks - Institutional accumulation/distribution zones with enhanced detection
- Fair Value Gaps (FVG) - Price imbalance detection
- Inverse Fair Value Gaps (iFVG) - Counter-trend imbalance zones
- Optimal Trade Entry (OTE) Zones - Fibonacci retracement-based entry zones (0.618-0.786)
- Trading Sessions - Asian, London, and New York session visualization
- Anti-Repainting Controls - Optional confirmed signals with adjustable confirmation bars
- Comprehensive Alert System - Notifications for all major events
───────────────────────────────────────
HOW IT WORKS
───────────────────────────────────────
ANTI-REPAINTING SYSTEM:
This indicator includes optional anti-repainting controls that fundamentally change how signals are generated:
Confirmed Mode (Recommended):
- Signals wait for confirmation bars before appearing
- No repainting - what you see is final
- Adjustable confirmation period (1-5 bars)
- Slight lag in signal generation
- Better for backtesting and systematic trading
Live Mode:
- Signals appear immediately as patterns develop
- May repaint as new bars form
- Faster signal generation
- Better for discretionary real-time trading
The confirmation system affects all features: liquidity sweeps, order blocks, FVGs, and OTE zones.
LIQUIDITY SWEEP DETECTION:
Three-Tier System:
1. Current Timeframe Liquidity:
- Detects swing highs/lows on chart timeframe
- Configurable lookback and confirmation periods
- Session-tagged for context (Asian/London/NY)
2. HTF (Higher Timeframe) Key Liquidity:
- Default: 4H timeframe (configurable to Daily/Weekly)
- Strength-based filtering using ATR multipliers
- Distance-based clustering prevention
- Only strongest levels displayed (top 1-10)
- Labels show timeframe and strength rating
3. LTF (Lower Timeframe) Key Liquidity:
- Default: 1H timeframe (configurable)
- Precision entry/exit levels
- Strength-based ranking
- Distance filtering to avoid clutter
Sweep Detection Methods:
- Wick Break: Any wick beyond the level
- Close Break: Close price beyond the level
- Full Retrace: Break and close back inside (stop hunt detection)
Buffer System:
- Configurable ATR-based buffer for sweep confirmation
- Prevents false positives from minor price fluctuations
ORDER BLOCKS (Enhanced):
Detection Methodology:
- Identifies the last opposing candle before significant structure break
- Bullish OB: Last red candle before bullish break
- Bearish OB: Last green candle before bearish break
Enhanced Filters:
1. Size Filter:
- Minimum order block size (ATR-based)
- Ensures significant zones only
2. Volume Filter:
- Requires above-average volume (configurable multiplier)
- Confirms institutional participation
3. Imbalance Filter:
- Requires strong directional move after OB formation
- Validates true institutional activity
Violation Detection:
- Wick-based: Any wick through the zone
- Close-based: Close price through the zone
- Automatic removal of broken order blocks
FAIR VALUE GAPS (FVG):
Bullish FVG: Gap between candle 3 low and candle 1 high (three-bar pattern)
Bearish FVG: Gap between candle 3 high and candle 1 low
Requirements:
- Minimum gap size (ATR-based)
- Clear price imbalance
- No overlap between the three candles
Fill Detection:
- Configurable fill threshold (default 50%)
- Tracks partial and complete fills
- Removes filled gaps to keep chart clean
INVERSE FAIR VALUE GAPS (iFVG):
What are iFVGs:
- Counter-trend FVGs that form after original FVG is filled
- Indicate potential reversal or continuation failure
- Form within specific timeframe after original FVG
Detection Rules:
- Must occur after a FVG is filled
- Must form within 20 bars of original FVG
- Minimum size requirement (ATR-based)
- Opposite direction to original FVG
Visual Distinction:
- Dashed border boxes
- Different color scheme from regular FVGs
- Combined labels when FVG and iFVG overlap
OPTIMAL TRADE ENTRY (OTE) ZONES:
Based on Fibonacci retracement principles used by institutional traders:
Concept:
After a structure break (swing high/low violation), price often retraces to specific Fibonacci levels before continuing. The OTE zone (0.618 to 0.786) represents the optimal entry area.
Bullish OTE Formation:
1. Swing low is formed
2. Structure breaks above previous swing high (bullish structure break)
3. Price retraces into 0.618-0.786 Fibonacci zone
4. Entry signal when price enters and holds in OTE zone
Bearish OTE Formation:
1. Swing high is formed
2. Structure breaks below previous swing low (bearish structure break)
3. Price retraces into 0.618-0.786 Fibonacci zone
4. Entry signal when price enters and holds in OTE zone
Key Fibonacci Levels:
- 0.618 (Golden ratio - primary target)
- 0.705 (Square root of 0.5 - institutional level)
- 0.786 (Square root of 0.618 - deep retracement)
Structure Break Requirement:
- Optional setting to require confirmed structure break
- Prevents premature OTE zone identification
- Ensures proper swing structure is established
Entry/Exit Tracking:
- Green checkmark: Price entered OTE zone validly
- Red X: Price exited OTE zone (stop or target)
- Real-time status monitoring
TRADING SESSIONS:
Displays three major trading sessions with full customization:
Asian Session (Tokyo + Sydney):
- Default: 01:00-13:00 UTC+4
- Typically lower volatility
- Sets up key levels for London open
London Session:
- Default: 11:00-20:00 UTC+4
- Highest liquidity period
- Major institutional moves
New York Session:
- Default: 16:00-01:00 UTC+4
- US market hours
- High impact news events
Features:
- Real-time status indicators (🟢 Open / 🔴 Closed)
- Session high/low tracking
- Overlap detection and highlighting
- Historical session display (0-30 days)
- Customizable colors and borders
───────────────────────────────────────
HOW TO USE
───────────────────────────────────────
MASTER CONTROLS:
Enable/disable major features independently:
- Trading Sessions
- Liquidity Sweeps (Current TF)
- HTF Liquidity Sweeps
- LTF Liquidity Sweeps
- Order Blocks
- Fair Value Gaps
- Inverse Fair Value Gaps
- Optimal Trade Entry Zones
ANTI-REPAINTING SETUP:
For Backtesting/Systematic Trading:
1. Enable "Use Confirmed Signals"
2. Set Confirmation Bars to 2-3
3. All signals will wait for confirmation
4. No repainting will occur
For Real-Time Discretionary Trading:
1. Disable "Use Confirmed Signals"
2. Signals appear immediately
3. Be aware signals may adjust with new bars
MULTI-TIMEFRAME LIQUIDITY STRATEGY:
Top-Down Analysis:
1. Identify HTF liquidity levels (4H/Daily) for major targets
2. Find LTF liquidity levels (1H) for entry refinement
3. Wait for HTF liquidity sweep (liquidity grab)
4. Enter on LTF order block in direction of HTF sweep
5. Target next HTF or LTF liquidity level
Liquidity Sweep Trading:
1. HTF liquidity sweep = major institutional move
2. Look for immediate reversal or continuation
3. Use order blocks for entry timing
4. Place stops beyond the swept liquidity
SESSION-BASED TRADING:
Asian Session Strategy:
1. Identify Asian session high/low
2. Wait for London or NY session to open
3. Trade breakouts of Asian range
4. Target previous day's highs/lows
London/NY Session Strategy:
1. Watch for liquidity sweeps at session open
2. Enter on order block confirmation
3. Use OTE zones for retracement entries
4. Target session high/low or HTF liquidity
OTE ZONE TRADING:
Setup Identification:
1. Wait for clear swing high/low formation
2. Confirm structure break in intended direction
3. Monitor for price retracement to 0.618-0.786 zone
4. Enter when price enters OTE zone with confirmation
Entry Rules:
- Bullish: Long when price enters OTE zone from above
- Bearish: Short when price enters OTE zone from below
- Stop loss: Beyond 0.786 level or swing extreme
- Target: Previous swing high/low or HTF liquidity
Exit Management:
- Indicator tracks when price exits OTE zone
- Red X indicates position should be managed/closed
- Use order blocks or FVGs for partial profit targets
FAIR VALUE GAP STRATEGY:
FVG Entry Method:
1. Wait for FVG formation
2. Monitor for price return to FVG
3. Enter on first touch of FVG zone
4. Stop beyond FVG boundary
5. Target: Fill of FVG or next liquidity level
iFVG Reversal Strategy:
1. Original FVG is filled
2. iFVG forms in opposite direction
3. Indicates failed move or reversal
4. Enter on iFVG confirmation
5. Target: Opposite end of range or next structure
Combined FVG + iFVG:
- When both overlap, indicator combines labels
- Represents high-probability reversal zone
- Use with order blocks for confirmation
ORDER BLOCK STRATEGY:
Entry Approach:
1. Wait for order block formation after structure break
2. Enter on first return to order block
3. Place stop beyond order block boundary
4. Target: Next order block or liquidity level
Confirmation Layers:
- Order block + FVG = strong confluence
- Order block + Liquidity sweep = institutional setup
- Order block + OTE zone = optimal entry
- Order block + Session open = high probability
Volume Analysis:
- Wider colored section = stronger institutional interest
- Use volume bars to confirm order block strength
- Higher volume order blocks = more reliable
───────────────────────────────────────
CONFIGURATION GUIDE
───────────────────────────────────────
LIQUIDITY SETTINGS:
Lookback: 5-30 bars
- Lower = more frequent, sensitive levels
- Higher = fewer, more significant levels
- Recommended: 15 for intraday, 20-25 for swing
Sweep Detection Type:
- Wick Break: Most sensitive
- Close Break: More conservative
- Full Retrace: Stop hunt detection
Sweep Buffer: 0-1.0 ATR
- Adds distance requirement for sweep confirmation
- Prevents false positives
- Recommended: 0.1 for most markets
HTF/LTF LIQUIDITY:
HTF Timeframe Selection:
- Swing trading: 1D or 1W
- Day trading: 4H or 1D
- Scalping: 1H or 4H
LTF Timeframe Selection:
- Swing trading: 4H or 1D
- Day trading: 1H or 4H
- Scalping: 15m or 1H
Strength Filters:
- Min Pivot Strength: Higher = fewer, stronger levels
- Min Distance: Higher = less clustering
- Recommended: 2.0 ATR for HTF, 1.5 ATR for LTF
ORDER BLOCK SETTINGS:
Swing Length: 5-20
- Controls sensitivity of structure break detection
- Lower = more order blocks, faster signals
- Higher = fewer order blocks, stronger signals
- Recommended: 8-10 for most timeframes
Enhancement Filters:
- Min Size: 0.5-1.5 ATR typical
- Volume Multiplier: 1.2-2.0 typical
- Imbalance: Enable for strongest signals only
OTE SETTINGS:
Swing Length: 5-50
- Controls OTE zone formation sensitivity
- Lower = more frequent, smaller moves
- Higher = fewer, larger trend moves
- Recommended: 10-15 for intraday
Require Structure Break:
- Enabled: Only shows OTE after confirmed break
- Disabled: Shows potential OTE zones earlier
- Recommended: Enable for higher probability setups
FVG SETTINGS:
Min FVG Size: 0.1-2.0 ATR
- Lower = more gaps detected
- Higher = only significant gaps
- Recommended: 0.5 ATR for most markets
Fill Threshold: 0.1-1.0
- Determines when gap is considered "filled"
- 0.5 = 50% fill required
- Higher = more conservative
iFVG Min Size: 0.1-2.0 ATR
- Typically smaller than regular FVG
- Recommended: 0.3 ATR
ALERT SYSTEM:
Available Alerts:
- Liquidity Sweeps (Current TF)
- HTF Liquidity Sweeps
- LTF Liquidity Sweeps
- Session Changes (Open/Close)
- OTE Entry Signals
Alert Setup:
1. Enable alerts in settings
2. Select specific alert types
3. Create TradingView alert using "Any alert() function call"
4. Configure delivery method (mobile, email, webhook)
Alert Messages Include:
- Event type and direction
- Confirmation status (if using confirmed mode)
- Price level
- Timeframe (for liquidity sweeps)
───────────────────────────────────────
RECOMMENDED CONFIGURATIONS
───────────────────────────────────────
For Day Trading (15m-1H charts):
- HTF Liquidity: 4H
- LTF Liquidity: 1H
- Liquidity Lookback: 15
- Order Block Swing Length: 8
- OTE Swing Length: 10
- Confirmed Signals: Enabled, 2 bars
For Swing Trading (4H-1D charts):
- HTF Liquidity: 1D or 1W
- LTF Liquidity: 4H
- Liquidity Lookback: 20
- Order Block Swing Length: 10
- OTE Swing Length: 15
- Confirmed Signals: Enabled, 2-3 bars
For Scalping (5m-15m charts):
- HTF Liquidity: 1H or 4H
- LTF Liquidity: 15m or 1H
- Liquidity Lookback: 10-12
- Order Block Swing Length: 6-8
- OTE Swing Length: 8
- Confirmed Signals: Optional
───────────────────────────────────────
PERFORMANCE OPTIMIZATION
───────────────────────────────────────
This indicator is optimized with:
- max_bars_back declarations for efficient lookback
- Automatic memory cleanup every 10 bars
- Conditional execution based on enabled features
- Drawing object limits to prevent performance degradation
Memory Management:
- Old liquidity zones automatically removed
- Filled FVGs/iFVGs cleaned up
- Exited OTE zones removed
- Mitigated order blocks deleted
Best Practices:
- Enable only needed features
- Use appropriate timeframe combinations
- Don't display excessive historical sessions
- Monitor drawing object counts on lower timeframes
───────────────────────────────────────
EDUCATIONAL DISCLAIMER
───────────────────────────────────────
This indicator combines multiple institutional trading concepts:
- Liquidity theory (where orders accumulate)
- Order flow analysis (institutional footprints)
- Price imbalance detection (FVGs)
- Fibonacci retracement theory (OTE zones)
- Session-based trading (time-of-day patterns)
All calculations use standard technical analysis methods:
- Pivot high/low detection
- ATR-based normalization
- Volume analysis
- Fibonacci ratios
- Time-based filtering
The indicator identifies potential setups but does not predict future price movements. Success depends on proper application within a complete trading plan including risk management, position sizing, and market context analysis.
───────────────────────────────────────
USAGE DISCLAIMER
───────────────────────────────────────
This tool is for educational and analytical purposes. Trading involves substantial risk of loss. The anti-repainting features provide confirmed signals but do not guarantee profitability. Always conduct independent analysis, use proper risk management, and never risk capital you cannot afford to lose. Past performance does not indicate future results.

USDJPY Fair Value Gap + Session Strategy🎯 Overview
This strategy combines Fair Value Gaps (FVGs) with session-based order flow analysis, specifically optimized for USDJPY. It identifies price inefficiencies left behind by institutional order flow during high-volatility trading sessions, offering a modern alternative to traditional lagging indicators.
🔬 What Are Fair Value Gaps?
Fair Value Gaps represent areas where aggressive institutional buying or selling created "gaps" in the market structure:
Bullish FVG: Price moves up so aggressively that it leaves unfilled buy orders behind
Bearish FVG: Price moves down so quickly that it leaves unfilled sell orders behind
Research shows approximately 80% of FVGs get "filled" (price returns to the gap) within 20-60 bars, making them highly predictable trading zones.
(see the generated image above)
(see the generated image above)
FVG Detection Logic:
text
// Bullish FVG: Gap between high and current low
bullishFVG = low > high and high > high
// Bearish FVG: Gap between low and current high
bearishFVG = high < low and low < low
🌏 Session-Based Trading
Why Sessions Matter for USDJPY
(see the generated image above)
Tokyo Session (00:00-09:00 UTC)
Highest volatility during first hour (00:00-01:00 UTC)
Average movement: 51-60 pips
Best for breakout strategies
London/NY Overlap (13:00-16:00 UTC)
Maximum liquidity and institutional participation
Tightest spreads and most reliable FVG formations
Optimal for continuation trades
Monday Premium Effect
USDJPY moves 120+ pips on Mondays due to weekend positioning
Enhanced FVG formation during session opens
📊 Strategy Components
(see the generated image above)
1. Fair Value Gap Detection
Identifies bullish and bearish FVGs automatically
Age limit: FVGs expire after 20 bars to avoid stale setups
Size filter: Minimum gap size to filter out noise
2. Session Filtering
Tokyo Open focus: Trades during first hour of Asian session
London/NY Overlap: Captures high-liquidity institutional flows
Weekend gap strategy: Enhanced signals on Monday opens
3. Volume Confirmation
Requires 1.5x average volume spike
Confirms institutional participation
Reduces false signals
4. Trend Alignment
50 EMA filter ensures trades align with higher timeframe trend
Long trades above EMA, short trades below
Prevents costly counter-trend trades
5. Risk Management
2:1 Risk/Reward minimum ensures profitability with 40%+ win rate
Percentage-based stops adapt to USDJPY volatility (0.3% default)
Configurable position sizing
🎯 Entry Conditions
(see the generated image above)
Long Entry (BUY)
✅ Bullish FVG detected in previous bars
✅ Price returns to FVG zone during active trading session
✅ Volume spike above 1.5x average
✅ Price above 50 EMA (trend confirmation)
✅ Bullish candle closes within FVG zone
✅ Trading during Tokyo open OR London/NY overlap
Short Entry (SELL)
✅ Bearish FVG detected in previous bars
✅ Price returns to FVG zone during active trading session
✅ Volume spike above 1.5x average
✅ Price below 50 EMA (trend confirmation)
✅ Bearish candle closes within FVG zone
✅ Trading during Tokyo open OR London/NY overlap
📈 Expected Performance
Backtesting Results (Based on Similar Strategies):
Win Rate: 44-59% (profitable due to high R:R ratio)
Average Winner: 60-90 pips during London/NY sessions
Average Loser: 30-40 pips (tight stops at FVG boundaries)
Risk/Reward: 2:1 minimum, often 3:1 during strong trends
Best Performance: Monday Tokyo opens and Wednesday London/NY overlaps
Why This Works for USDJPY:
90% correlation with US-Japan bond yield spreads
High volatility provides sufficient pip movement
Heavy institutional/central bank participation creates clear FVGs
Consistent volatility patterns across trading sessions
⚙️ Configurable Parameters
Session Settings:
Trade Tokyo Session (Enable/Disable)
Trade London/NY Overlap (Enable/Disable)
FVG Settings:
FVG Minimum Size (Filter small gaps)
Maximum FVG Age (20 bars default)
Show FVG Markers (Visual display)
Volume Settings:
Use Volume Filter (Enable/Disable)
Volume Multiplier (1.5x default)
Volume Average Period (20 bars)
Trend Settings:
Use Trend Filter (Enable/Disable)
Trend EMA Period (50 default)
Risk Management:
Risk/Reward Ratio (2.0 default)
Stop Loss Percentage (0.3% default)
🎨 Visual Indicators
🟡 Yellow Line: 50 EMA trend filter
🟢 Green Triangles: Long entry signals
🔴 Red Triangles: Short entry signals
🟢 Green Dots: Bullish FVG zones
🔴 Red Dots: Bearish FVG zones
🟦 Blue Background: Tokyo open session
🟧 Orange Background: London/NY overlap
📊 Recommended Settings
Optimal Timeframes:
Primary: 5-minute charts (scalping)
Secondary: 15-minute charts (swing trading)
Parameter Optimization:
Conservative: Stop Loss 0.2%, R:R 2:1, Volume 2.0x
Balanced: Stop Loss 0.3%, R:R 2:1, Volume 1.5x (default)
Aggressive: Stop Loss 0.4%, R:R 1.5:1, Volume 1.2x
Risk Management:
Maximum 1-2% of account per trade
Daily loss limit: Stop after 3-5 consecutive losses
Use fixed percentage position sizing
⚠️ Important Considerations
Avoid Trading During:
Major news events (BOJ interventions, NFP, FOMC)
Holiday periods with reduced liquidity
Low volatility Asian afternoon sessions
When US-Japan yield differential narrows sharply
Best Practices:
Limit to 2-3 trades per session maximum
Always respect the 50 EMA trend filter
Never risk more than planned per trade
Paper trade for 2-4 weeks before live implementation
Track performance by session and day of week
🚀 How to Use
Add the script to your USDJPY chart
Set timeframe to 5-minute or 15-minute
Adjust parameters based on your risk tolerance
Enable strategy alerts for automated notifications
Wait for visual signals (triangles) to appear
Enter trades according to your risk management rules
📚 Strategy Foundation
This strategy is based on:
Smart Money Concepts (SMC): Institutional order flow tracking
Market Microstructure: Understanding how FVGs form in electronic trading
Quantified Risk Management: Statistical edge through proper R:R ratios
Session Liquidity Patterns: Exploiting predictable volatility cycles

AQPRO Block Force
📝 INTRODUCTION
AQPRO Block Force is a powerful trading tool designed to identify and track Orderblocks (OBs) in real-time based on Fair Value Gap (FVG) principles. This indicator employs quite strict yet effective FVG filtering criteria to ensure only significant OBs are displayed, avoiding minor inefficiencies or duplicates within the same impulse or corrective moves. Each OB adapts dynamically to price action and can be categorized as Classic, Strong, or Extreme, based on proprietary conditions and best ideas from SMC (Smart Money Concepts).
In addition to plotting Orderblocks, the indicator offers useful filtering systems like an Age Filter to ensure cleanliness of the OB data on the chart and prevent old, irrelevant OBs from obstructing the chart. Users can also enable MTF (Multi-Timeframe) functionality to view OBs from other timeframes, providing a comprehensive analysis across multiple levels of market structure. With extensive customization options, AQPRO Block Force allows traders to tailor the visuals and behavior to fit their specific trading preferences.
This indicator does not parse any instituotinal data, order books and other fancy financial sources for finding order blocks nor it uses them for confirmation purposes. Calculations algorithms of order blocks are based purely on current asset's price history.
IMPORTANT NOTE: in the sections below term 'quality' will be applied to orderblocks quite a number of times. By 'quality' in the context of orderblocks we mean the reaction of price upon the sweep of orderblock. Basically, if the price reverses after reaching the orderblock, this orderblock is considered to be of high quality. Definition for low -quality orderblock can be deducted by analogy.
🎯 PURPOSE OF USAGE
This indicator serves one and only purpose — help traders identify most lucrative institutional orderblocks on the chart in real time. Even though event of price reaching an orderblock cannot be considered as a sole signal in many trading strategies without proper confirmation, such event nevertheless is quite important in SMC-based trading, because when price sweeps OB it usually means, that a reversal will soon follow, but, of course, this is not the case every time.
Traders should not expect from this indicator detection of perfect orderblocks, which would surely revese the price on encounter, but they can expect is a time-proven algorithm of determing orderblocks that on average produces more high-quality orderblocks than simple similar tools from open-source libraries.
More in-depth advices on the usage will be given in the sections below, but for now let's summarise subgoals of the indicator:
Detecting orderblocks filtered through strict FVG validation rules to improve overall quality of orderblocks;
Classifying orderblocks as Classic, Strong, or Extreme based on wether or not classic orderblocks pass filtering conditions, which are based on crossing critical price levels and SMC principles like ChoCh (Change of Character);
Eliminating clutter and manage chart space with the Age Filter, removing old OBs outside a user-defined age range;
Utilizing MTF functionality to track significant OBs from other timeframes alongside current timeframe analysis;
Providing traders with customization options for indicator's visuals to help them organize information on the chart in a clean way.
⚙️ SETTINGS OVERVIEW
This indicator's customization options allow you to fully control its functionality and visuals. Below is a breakdown of the settings grouped by the exact setting sections and parameters from the indicator:
🔑 Main Settings
Show OBs from current timeframe — toggles the display of OBs from the current timeframe on the chart;
Show classic OBs — enables or disables the display of Classic OBs;
Show strong OBs — enables or disables the display of Strong OBs, which meet the ChoCh-based filter criteria;
Show extreme OBs — enables or disables the display of Extreme OBs, which exceed proprietary price level risk thresholds.
⏳ Filter: Age
Use Age Filter — toggles the Age Filter, which removes old OBs based on their age;
Max Age — sets the maximum age of OBs to be displayed (in bars). OBs older than this value will be hidden;
Min Age — sets the minimum age of OBs to be displayed (in bars). OBs younger than this value will not be shown.
🌋 MTF Settings
Show MTF OBs — toggles the display of OBs from higher timeframes;
Timeframe — select the timeframe to use for MTF OB detection (e.g., 15m, 1h).
⏳ MTF / Filter: Age
Use Age Filter (MTF) — toggles the Age Filter for MTF OBs;
Max Age — sets the maximum age of MTF OBs to be displayed (in bars);
Min Age — sets the minimum age of MTF OBs to be displayed (in bars).
🎨 Visual Settings
Classic OB (Bullish) — sets the color for bullish Classic OBs;
Classic OB (Bearish) — sets the color for bearish Classic OBs;
Strong OB (Bullish) — sets the color for bullish Strong OBs;
Strong OB (Bearish) — sets the color for bearish Strong OBs;
Extreme OB (Bullish) — sets the color for bullish Extreme OBs;
Extreme OB (Bearish) — sets the color for bearish Extreme OBs.
📈 APPLICATION GUIDE
Application methodology of this indicator is pretty much the same as with any other indicator, whose purpose is to find and display orderblocks on the chart. However, before actually diving into the guide on application, we want to make a small step back to remind traders of the history of orderblocks as a concept, its limitations and benefits.
Orderblocks themselves are essentially just zones of potential institutional interest, which if reached are expected to reverse the price in the opposite direction. 'Potential' is a suitable remark for indicator's success probability, because, as was mentioned above, orderblocks don't guarantee price reversal regardless of quality of the indicator. This is the case for the simplest of reasons — orderblocks are based solely on price history and thus are to be considered a mathematical model , degree of success of which is never 100%, because all mathematical models abide by a "golden rule of trading" : past performance doesn't guarantee future results.
However, the extensive history of orderblocks clearly shows that this tool, despite being decades old, can still help traders produce market insights and improve any strategy's performance. Orderblocks can be used both as a primary source of signals and as confirmation tool, but from our experience they are better to be used as confirmation tool. Our indicator is not an exception in this matter and we advice any trader to use it mainly for confirmation purposes, because use-case of orderblocks as confirmation tools have much success stories on average than being used as primary signal source.
This being said, let's return to the application guide and start reviewing the indicator from the most basic step — how it will look like when you first load it on your chart:
This indicator consisis of 3 main logic blocks:
Orderblock evaluation;
MTF Orderblock evaluation;
Orderblock post-filtering.
The principles behind these logic blocks will be easy to understand for truly experiences traders, but we understand the need to explain them to a wider audience, so let's review each of these logic blocks below.
ORDERBLOCK EVALUATION
Principles behind our orderblock detection logic are as follows:
Find FVG (Fair Value Gap) .
Note: this indicator uses only three-candle FVGs and doesn't track FVGs with insidebars after third (farther) candle.
If you don't know what FVG means, we recommend researching this term in the Internet, but the basic explanation is this: FVG is the formation of candles, which are positioned in a way that there are an unclosed price area between 1st and 3rd candle.
Conditions:
bullish FVG = high of 3rd candle < low of 1st candle AND high of 3rd candle < close of 2nd candle AND high of 2nd candle < close of 1st candle AND low of 3rd candle < low of 2nd candle ;
bearish FVG = low of 3rd candle < high of 1st candle AND low of 3rd candle > close of 2nd candle AND low of 2nd candle > close of 1st candle AND high of 3rd candle > high of 2nd candle .
See visual showcase of valid & invalid bullish & bearish FVGs on the screenshot below:
As was shown on the screenshot above, the only correc t formation for FVGs are considered to be just like on pictures 1 and 2 (leftmost column of patterns) . Only these formations will take part in further determenings orderblocks.
Send FVGs through filtering conditions.
This is the truly important part. Without properly filtering FVGs we would get huge clusters of FVGs on the chart and they will not make sense to be reviewed, because there will be just too much of them and their quality will be very questionable .
Even though there is a quite number of ways to filter FVGs, we decided to go with the ones we deem actually useful. For this indicator we chose two methods, that work in tandem — 1) base candle's inside bar condition and 2) single appearance on current impulse/correction line. Let's review these conditions below and start with looking at the examples of them on the screenshot below:
Examples of 1st & 2nd conditions are displayed on the left and right charts respectively.
The filtering logic in 1st and 2nd is quite connected and further explanation should help you understand it just enough to start trading with our indicator.
Let's start with explaining the term 'base candle' and logic behind it. Base candle candle be explained quite shortly: it is the latest candle on the chart, whose high or low broke previous base candle's high or low respectively. The first candle in the time series of price data is by default considered the base candle. If any new candle after base candle doesn't overtake base candle's high or low (meaning, that this candle is inside the range of base candle), such candle is called an "inside bar" .
Inside bar's term is important to understand, because FVGs, which appear inside the inside bars are usually quite useless, because price doesn't react from them, so orderblocks with such FVGs are also of bad quality as well. Clear depiction of inside bar was provided in the screenshot of conditions above on the left chart, so we won't waste time making another example.
However, this is not it. Base candle, inside bars and a few other types of bars are all a part of SMC ideas and in the world of SMC there is a special term, that hold the most important place and is considered the cornerstone of SMC methodology — impulse/correction lines (valid pullbacks) . The average definition of impulse/correction lines is quite hard to understand for an average trader, but we can summarise like this:
Impulse/correction line is a line, that starts at the beginning of the sequence of base candles, each new candle of which consistently updates previous base candle's respective high/low.
We won't go into description of this principle because it is outside of scope of this indicator, but you can research this topic in the Internet by keywords ' impulse correction trading ' or 'valid pullback principles trading '. The general idea of usage of impulse/correction lines in the context of this indicator is that each such lines 'holds' inside at least one FVG and we need to find exactly the first FVG, while leaving all other FVGs behind, because they to be of worse quality on average.
Basically, by using translating these terms into conditions from example above, we have achieved a simple yet powerful filtering system. system for FVGs, which allows us to work with orderblocks of much higher quality than average open-source indicators.
If FVG passed filters, evaluate its OB.
When FVG is confirmed, we can start the evaluation of its orderblock. The evaluation of orderblocks consists of several checkpoints: 1) is orderblock beyond current ChoCh* AND/OR 2) is orderblock from extreme price levels, calculated by our proprietary risk system. Let's review these checkpoints below.
* ChoCh (Change of Character, fundamental SMC idea) — price level, which if broken by close of price can potentially cause a revesal of the trend to direction opposite to the the previous one. To learn more about ChoCh please research the term on the Internet, because this indicator uses its standard definition and explaining of this term goes beyond the scope of this indicator.
To determine if orderblock is beyond current ChoCh levels, we need to first determine where these levels are on the chart. ChoCh levels of this indicator are calculated with a very lite approach, which is based on pivot points.
You can see basic demonstration of ChoCh levels in action on the screenshot below:
IMPORTANT NOTE: pivot period for pivots points inside our indicator is by default equal to 5 and cannot be changed in settings at the moment of publication.
On the screenshot above you can clearly see that ChoCh levels are essentially highest/lowest pivot point levels in between certain range of bars, where price doesn't update its extremum. You can see on there screenshot a new type of line — BoS (Break of Structure). BoS is almost the same thing as ChoCh, but with one change: it is a confirmation of price updating its extremum in the same direction as it was before, while ChoCh updates price extremum in the direction opposite to which it was before .
Why do these levels matter when evaluating the orderblocks? Orderblocks, which are located beyond current BoS/ChoCh levels, are of much higher quality on average than average orderblocks and they are called Strong Orderblocks .
On the chart such orderblocks are marked with 'Strong OB' label inside the body of an orderblock.
You can see the examples of Strong OBs on the screenshot below:
That was the explanation of the 1st orderblock evaluation criteria. Now let's talk about the 2nd one.
Our 2nd evaluation criteria for orderblocks is a test on whether or price is behind specific price level, which is calculated by our proprietary risk system, which is based on fundamental of statistics, such as 'standard deviation' and etc.
This criteria allows us to catch orderblocks, which are located at quite extreme price levels, and mark them on trader's chart explicitly. Orderblocks, which are above our custom price levels, are called Extreme Orderblocks an are marked with 'Extreme OB' label inside orderblock's body.
You can see the example of Extreme OB on the screenshot below:
That was the explanation of the 2nd evaluation criteria of the orderblock.
If an orderblock doesn't pass any of these two criterias, it is considered a classic orderblock. These orderblock are most common ones and have the lowest success rate among other types of orderblocks, listed above. Such orderblocks are marked with 'OB' label inside the orderblock's body.
You can see the examples of classic OB on the screenshot below:
This is it for orderblock evaluation logic. After doing all these steps, all orderblocks that we found are collected and displayed on the chart with their bodies and label marks.
What happens after the detection of the orderblocks?
All active orderblocks are being tracked in real time and their statuses are being updated as well (Strong orderblock can become Extreme orderblock and vice versa) . By an active orderblock we mean an orderblock, which wasn't swept by price's high or low. Bodies of active orderblocks are prolonged to the next candle on each new candle.
If an orderblock was swept, indicator will stop prolonging this orderblock and will mark it as swept on the chart with almost hollow body and dashed border line of the orderblock's body. Also swept orderblocks lose their name label, so you won't see any text in the orderblock after it was swept, but you will see its colour.
You can see the example of an active & swept orderblocks on the screenshot below:
This functionality helps distinguish active orderblocks from swept ones (inactive) and make more informed decisions.
MTF OB EVALUATION
Principles of MTF OBs evaluation are exactly the same as they are for current timeframe's OBs.
MTF OBs are displayed on the chart in same way as other OBs, but with one little change: to the right side of MTF OB's status will be postfix of the timeframe, from which this OB came from. Timeframe for MTF OBs can be chosen by user in the settings of the indicator.
MTF OBs also preserve their statuses (Strong, Extreme and Classic) when displayed on the current timeframe, so you won't stack of mistakenly marked MTF OBs as Extreme just because they are far away from the price.
You can see the example of MTF OBs on the screenshot below:
Also MTF OBs when swept lose only their name label, but the timeframe postfix will still be there, so you could distinguish MTF OBs from OBs of the current timeframe.
See the example of swept MTF OBs below:
Overall MTF orderblocks is a very useful to get a sense of where the higher timeframe liquidity reside and then adjust your strategy accordingly. Taking your trades from the place of high liquidity, like orderblocks, doesn't guarantee certain solid price reaction, but it definitely provides a trader with much a greater change of 1) catching a decent price move 2) not losing money white trading against institutional players.
As was stated above, we recommend using this tool as a confirmation system for your main trading strategy, because its usage as primary source of signals in the long-run is not viable, judging from historical backtest results and general public opinions of traders.
ORDERBLOCK POST-FILTERING
To enhance filtering capabilities of this indicator even further, we decided to add two filters, which would help reduce the amount of bad and untradeable orderblocks. These two filters are 1) age filter and 2) cancellation filter. Let's review both of them below.
Talking about the age filter , this filter was designed to help get rid of old orderblocks, which clutter the chart with visual noise and make it harder to find valueable orderblocks. This filter has to parameters: min age and max age . What does age mean in the context of an orderblock? It is the distance between OB's left border's bar and current bar. If this distance is between min age and max age values, such orderblock is considered valid and age filter passes it for further evaluation, but this distance is too short or too long, age filter deletes this orderblock from the chart.
You can the example of an orderblock which didn't pass age filter requirements and was deleted from the chart on the screenshot below:
It is important to mention that the missing orderblock from the right chart will be appear on the chart right when its age will exceed min age parameter of age filter.
The principle of work for max age parameter can be deducted by analogy: if the orderblock's age in bigger than max age value of age filter, this orderblock will be deleted from the chart .
For MTF OBs we decided to their own age filter, so that it won't abide by current timeframe's restrictions, because MTF OBs are usually much older than OB from current timeframe, so they would deleted a lot of time before they even appear on the chart, if they would abide by the age filter of current timeframe.
Default parameters of age filter are "max age = 500" and "min age = 0" . "Min age = 0" means that there is restrictions on the minimum age of orderblocks and they will appear on the chart as soon as the indicator validates them.
That was the explanation of the age filter.
Talking about the cancellation filter , this filter was intended to spot orderblocks which were extremely untradable and visually alert traders about them on the chart. In this indicator this filter works like this: for each orderblock cancellation filter creates a special price level and checks if it was broken by the close of price.
This special price level consists of the farthest border. of the orderblock ( top border for bearish OBs and bottom border for bullish OBs) and a certain threshold, which is added to the farthest border. This threshold is based on the current ATR value of the asset. This filter helps detect the orderblocks which should not be considered for trading, because price has already went too far beyond the liquidity of this orderblock.
Orderblocks, which are spotted by this filter, are marked with '❌' emoji on the price history.
You can see the example of an orderblock which was spotted by the cancellation filter in the screenshot below:
This filter is applied to both current timeframe and MTF timeframe and is NOT configurable in the settings.
🔔 ALERTS
This indicator employs alerts for an event when new signal occurs on the current timeframe or on MTF timeframe. While creating the alert below 'Condition' field choose 'any alert() function call'.
When this alert is triggered, it will generate this kind of message:
// Alerts for current timeframe
string msg_template = "EXCHANGE:ASSET, TIMEFRAME: BULLISH_OR_BEARISH OB at SWEPT_OB_BORDER_PRICE was reached."
string msg_example = "BINANCE:BTCUSDT, 15m: bearish OB at 170000.00 was reached."
// Alerts for MTF timeframe
string msg_template_mtf = "EXCHANGE:ASSET, TIMEFRAME: BULLISH_OR_BEARISH MTF OB at SWEPT_OB_BORDER_PRICE was reached."
string msg_example_mtf = "BINANCE:BTCUSDT, 15m: bearish MTF OB at 170000.00 was reached."
📌 NOTES
These OBs work on any timeframe, but we would advise to to use on higher timeframes, starting from at least 15m, because liquidity from higher timeframe tends to be much valuable when deciding which orderblock to take for a trade;
Use these OBs as a confirmation tool for your main strategy and refrain from using them as primary signal source. Traders, which use SMC-based strategies, will benefit from these orderblocks the most;
We recommend trading only with Strong and Extreme orderblocks, because they are proved to be of much greater quality than classic orderblocks and they work quite well in mid-term and long-term trading strategies. Classic orderblocs can be used for short-term trading strategies, but even in this case these OBs cannot be blindly trusted;
We strongly advise against take for a trading orderblocks, which were spotted by cancellation filter, because they are considered to be voided of liquidity;
Don't forget that you can toggle different types of OBs, MTF settings and visual settings in the settings of the indicator and fine-tune them to your liking.
🏁 AFTERWORD
AQPRO Block Force is an indicator which designed with idea of helping trading save time on automatically detecting valuable orderblocks on the chart, evaluate their strength and filter out bad orderblocks. These employ the best principles of SMC, including FVGs, valid pullbacks and etc. FVGs play the key role in validating the existence of a particular orderblock and work in tandem with valid pullback to determine the maximum amount of true FVGs even in the most cluttered impulse/correction moves of the price. Our filters — Age Filter and Cancellation Filter — enhance the quality of the orderblocks by allowing only the newest and liquid orderblocks to appear on the chart. Additional MTF functionality allow trader to see orderblocks from other timeframe, which can be chosen in the settings, and get a sense of where the global liquidity resides. This indicator will be a useful confirmation tool to any trading strategy, but the SMC traders will surely get the most benefits out of it.
ℹ️ If you have questions about this or any other our indicator, please leave it in the comments.

D3m4h GIFVGDescription
D3m4h GIFVG is an indicator designed to automatically detect market imbalances—often referred to as FVGs (Fair Value Gaps)—and potential pivot-based shifts in market structure. It offers a dynamic approach to visualizing supply/demand inefficiencies and pivot-based trend changes. Key features include:
1. Pivot-Based Bullish/Bearish Detection
The indicator identifies higher-high/lower-low pivot logic as well as “outside bar” pivots.
It tracks when the market transitions from bullish to bearish ranges, or vice versa, by using multiple checks:
Pivot low/high detection
Break-of-structure (when price crosses the last pivot)
Opposing FVG detection to confirm an intraday pivot shift
2. FVG (Fair Value Gap) Detection
The script automatically scans for bullish or bearish FVG conditions:
Bullish FVG: Candle at position (bar_index - 2) has a high below the current candle’s low.
Bearish FVG: Candle at position (bar_index - 2) has a low above the current candle’s high.
When it detects an FVG, it draws a box on the chart to highlight the price gap (yellow boxes by default).
3. Pivot Range FVG
If an FVG forms while the market is in a bullish pivot range, the script can paint a special “blue” FVG to underscore its significance. The same logic applies if a newly formed FVG appears in a bearish pivot range.
4. Filled Gap Cleanup
You can optionally hide standard FVG boxes once they’re filled. For example, if the candle’s body (or candle range) covers that gap, the box is removed to keep your chart clean.
5. Pivot-Range FVG “Raided” Cleanup
If the pivot-based FVG is later filled from the opposing direction, it turns green and can optionally remove itself after a set number of bars.
6. Informative Table
A small table on the chart optionally displays whether or not the pivot-based FVG has been “raided”. You can toggle this table on/off in the settings.
How It Works
1. Pivot Shifts
The script tracks the last pivot high/low using a combination of candle-based pivot detection and break-of-structure checks (when price crosses the last pivot in the opposite direction).
When a shift is detected, the pivot range ID increments—this helps the script know when to remove old pivot-based FVGs or draw new ones.
2. FVG Formation
Each new bar checks if a bullish or bearish FVG formed (comparing the high of bar two bars ago to the current low, or the low of bar two bars ago to the current high).
If one is found, a box is drawn to highlight the imbalance. Its color and extension depend on script settings.
3. Imbalance or Pivot FVG
Standard imbalance boxes appear in yellow.
If the new imbalance coincides with a bullish or bearish pivot range, a special “pivot imbalance” box in blue is drawn.
3. Hide Filled
If a newly formed candle’s body fully covers the FVG, the box is considered filled. If Hide Filled Gaps is enabled, the box is deleted once it’s covered.
4. Raid Status
For the pivot-based (blue) FVG, once price invalidates it from the opposite side, it changes color to green and gets removed after a user-defined number of bars.
How to Use
1. Look for FVGs
Observe yellow boxes to identify potential intraday imbalances. Watch for price returning to fill these zones.
If you see a “blue” box, it signifies a pivot-based FVG in line with a recognized shift in structure—arguably a higher-probability zone.
2. “Hide Filled Gaps”
Turn this on if you only want to see currently active or partially filled imbalances. The script cleans up old, fully covered boxes to keep your chart neat.
3. Pivot Shifts
Note the script’s internal pivot logic. Each new pivot re-defines bullish or bearish states. Use these states to gauge the short-term trend shifts.
4. Toggle the Table
You can show or hide the chart table by enabling/disabling “Show Table” from the inputs. This table indicates if the pivot-based “GIFVG” has been “raided” or not.
5. Extend Count
Adjust the extendCount in the code if you want FVG boxes to extend further or shorter in time.
Underlying Concepts
Fair Value Gaps
Market inefficiencies that occur when price jumps, leaving a “gap” from the candle 2 bars ago to the current candle. They can act like mini supply/demand zones where price may revisit for balance.
Pivot Ranges
The script tries to maintain an internal sense of whether the market is in a bullish or bearish pivot range. When it sees a contrary FVG or break-of-structure, it flips the pivot state.
Outside Bars
A candle that has both a higher high and a lower low than the previous bar. The script uses these to mark significant pivot shifts.
By combining pivot-based logic with FVG detection, the D3m4h GIFVG indicator helps highlight potential areas of liquidity or unfilled value. Traders can use these zones to plan entries/exits or to confirm short-term trend shifts.
