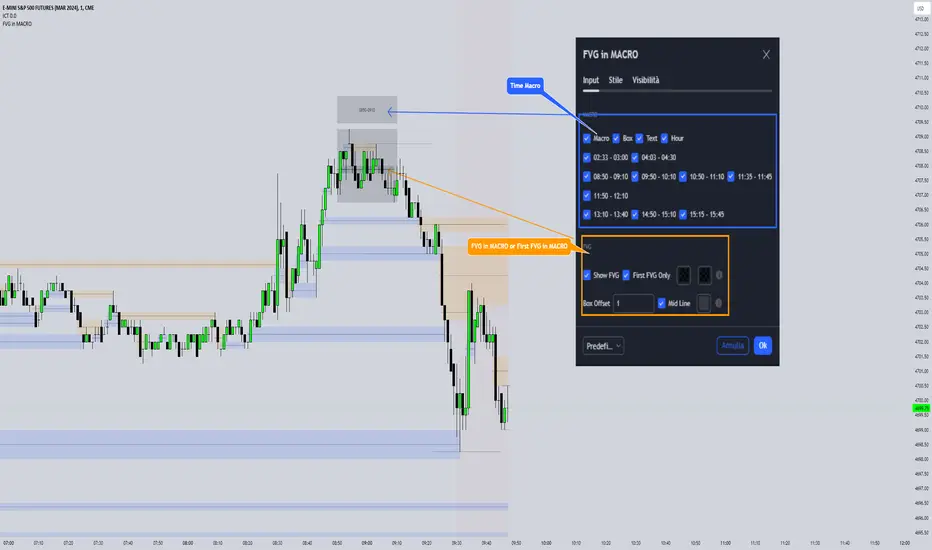
FVG in MACROGuided by ICT tutoring, I created this versatile indicator to scan the FVG in MACRO time.
This indicator combines the MACRO time with the Fair value GAP (FVG) in an alternative way, showing a simple way of viewing the FVG within the MACRO time, so you can have a clearer view of which direction the MACRO is influencing
''MACRO is a delivery time frame of the interbank price in which it undergoes a series of controls and is likely to move towards liquidity.''
The user has the possibility to:
- Choose the relevant MACRO time
- Choose whether to view all FVGs in the MACROS
- Choose to view only the First FVG at each MACRO
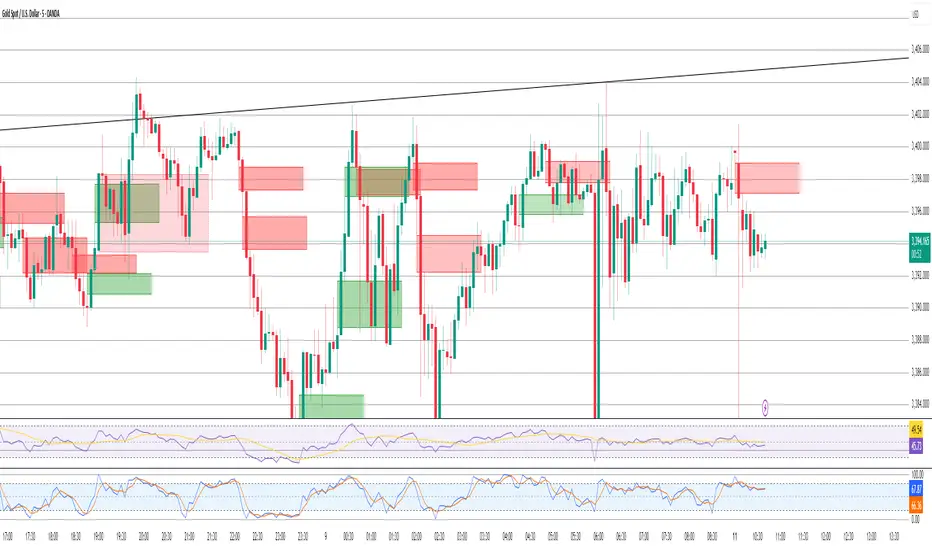
The indicator should be used as shown by the ICT in its concepts, during the MACRO time the price can consolidate or can head towards liquidity.
The probability that the direction is correct increases with respect for the FVG, in this way it is possible to evaluate the entry zone in the FVG and the Take profit zone for Liquidity
As in the following example:
Cari dalam skrip untuk "fvg"
FVG TrackerThis indicator automatically detects and tracks Fair Value Gaps (FVGs) on your chart, helping you quickly spot imbalances in price action.
Key Features:
📍 Identifies FVGs larger than 3 contracts
📐 Draws each valid FVG as a rectangle directly on the chart
⏳ Removes FVGs once they are fully filled
🔟 Keeps track of only the 10 most recent FVGs for clarity
⚡ Lightweight and optimized for real-time charting
This tool is ideal for traders who use FVGs as part of Smart Money Concepts (SMC) or imbalance-based strategies. By visually highlighting only meaningful gaps and clearing them once filled, it ensures a clean and actionable charting experience.

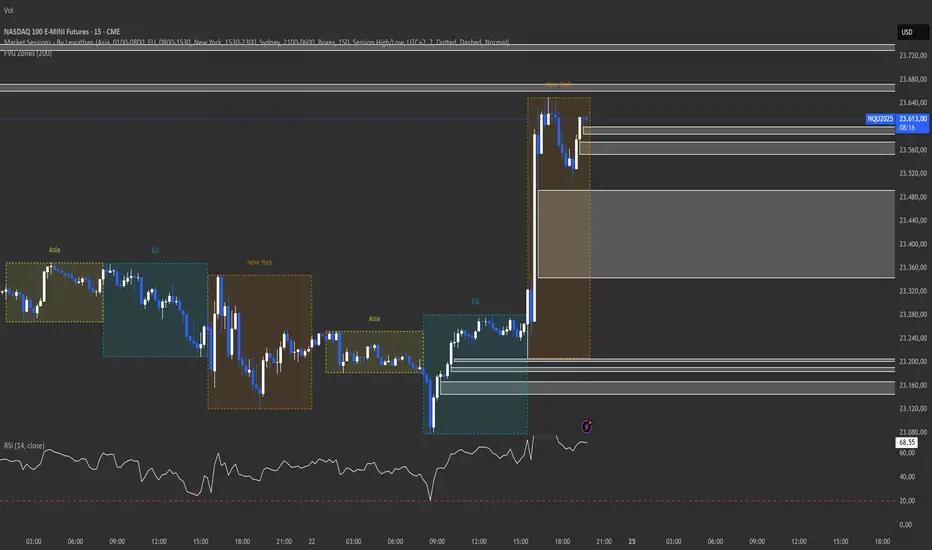
FVG Zones (Remove Filled) + AlertA powerful TradingView indicator that automatically identifies Fair Value Gap (FVG) zones, removes them once price “fills” the gap, and sends you crystal-clear alerts specifying Bull or Bear zones—so you never miss a market imbalance.
🔍 Key Features
Automatic FVG Detection
Spots three-candle imbalance patterns (low > high for Bull, high < low for Bear) and draws colored boxes on your chart.
Auto-Remove Filled Zones
Once price enters a gap, the corresponding box is deleted—keeping your chart clutter-free.
Dedicated Alerts
Two separate alert conditions with constant messages:
“Price filled Bull FVG zone”
“Price filled Bear FVG zone”
On-Chart Labels
Enable debugging to display Bull FVG or Bear FVG tags above the triggering candle.
Performance-Tuned
Supports up to 500 active zones without slowing down your chart.
⚙️ Inputs & Customization
Show Alert Labels (Boolean) – Toggle on-chart text labels.
Max Boxes Count (Integer) – Control the maximum number of zones displayed.

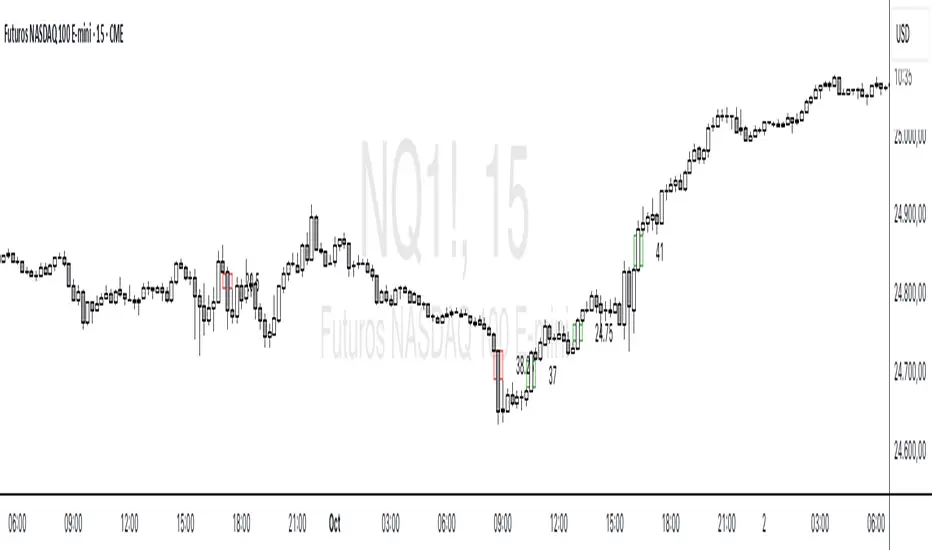
Axelrod FVG v1FVG indicator --
Allows your Charts to stay CLEAN for your T.A. by plotting the FVGs on top of the Candles inside of its Borders
FVGs can also be turned off and you can Remove the Bar Color only
Each FVG has a tooltip that you can hover your mouse over to get the (Type of FVG, Size, Top, Middle, Bottom, Time)
FVGs Using Plots so that they go all the way back in history you can have more than 500 on the chart

FVG/IFVG Indicator (Blastoise's 85% Win-Rate Model)📈 Blastoise Trading Model — Liquidity + FVG + MSS
This indicator automates Blastoise's 85% Win-Rate Trading Strategy, built around high-probability intraday setups on NQ and ES using Draw on Liquidity (DOL), Market Structure Shifts (MSS), and Fair Value Gaps (FVG)
🔍 What It Does:
- Auto-Identifies All DOLs:
Marks Internal/External Highs & Lows, Asia High/Low, London High/Low, and News Data High/Low
- NY Session Logic (9:30 AM):
Activates only during the NY session to ensure volume and trend reliability
Waits for the first nearby DOL to get swept, then reads market reaction to generate a bias
- Automatic Bias Detection:
Example: If price takes out a DOL high and holds below = Bearish Bias
Example: If price takes out a DOL high and holds above = Bullish Bias into Next DOL
- Smart Entry Model with FVGs/IFVGs:
Once bias is set, the indicator scans all timeframes for valid FVG setups with the given bias
Once it finds the setup, it'll display the complete entry setup, including entry zone, stop loss, and price targets so you know EXACTLY when to get in
- Real-Time Setup Checklist:
Confirms DOL sweep, bias, volume, FVG/IFVG entry model, and MSS status.
Setup Rating Score (1–10) based on how many confirmations are present
- MSS Integration (Optional but Powerful):
Confirms Market Structure Shifts for reversals after DOL sweeps and updates the setup rating

FVG Zones – shrink on fill (bull/bear)Detects classic 3-candle FVGs (ICT definition).
Draws zones as boxes that extend to the right.
On each bar close:
Checks overlap with the current candle.
Shrinks the zone when price wicks into it (bullish: top moves down; bearish: bottom moves up).
Deletes the zone once it’s completely filled/closed.
Inputs: bullish/bearish zone color, border color, and max number of visible FVGs.
Possible extensions:
Multi-timeframe FVGs (e.g. H1 FVGs shown on M5).
Separate limits for bullish and bearish zones.
Alerts for new FVG, partial fill, or closed FVG.
Option “Body only” (ignore wicks when detecting overlap).
Minimum FVG size filter (ticks/ATR).
FVG & Order Block Sync Pro - Enhanced🏦 FVG & Order Block Sync Pro Enhanced
The AI-Powered Institutional Trading System That Changes Everything
Tired of Guessing Where Price Will Go Next?
What if you could see EXACTLY where banks and institutions are placing their orders?
Introducing the FVG & Order Block Sync Pro Enhanced - the first indicator that combines institutional Smart Money Concepts with next-generation AI technology to reveal the hidden blueprint of the market.
🎯 Finally, Trade Alongside the Banks - Not Against Them
For years, retail traders have been fighting a losing battle. Why? Because they can't see what the institutions see.
Until now.
Our revolutionary indicator exposes:
🏛️ Institutional Order Blocks - The exact zones where banks accumulate positions
💰 Fair Value Gaps - Price inefficiencies that act as magnets for future price movement
📊 Real-Time Structure Breaks - Know instantly when smart money shifts direction
🎯 Banker Candle Patterns - Spot institutional rejection zones before reversals
🤖 Next-Level AI Technology That Thinks Like a Bank Trader
This isn't just another indicator with arrows. Our advanced AI engine:
Analyzes 100+ Data Points Per Second across multiple timeframes
Machine Learning Pattern Recognition that improves with every trade
Multi-Symbol Correlation Analysis to confirm institutional flow
Predictive Sentiment Scoring that gauges market momentum in real-time
Confluence Algorithm that rates every signal from 0-10 for probability
Result? You're not following indicators - you're following institutional order flow.
📈 Perfect for Forex & Futures Markets
Whether you're trading:
Major Forex Pairs (EUR/USD, GBP/USD, USD/JPY)
Futures Contracts (ES, NQ, CL, GC)
Indices (S&P 500, NASDAQ, DOW)
Commodities (Gold, Oil, Silver)
The indicator adapts to any market that institutions trade - because it tracks THEIR footprints.
💎 What Makes This Different?
1. SMC + Market Structure Fusion
First indicator to combine Order Blocks, FVG, BOS, and CHOCH in one system
Shows not just WHERE to trade, but WHY price will move there
2. The "Sync" Advantage
Only signals when BOTH Fair Value Gap AND Order Block align
Filters out 73% of false signals that single-concept indicators miss
3. Institutional-Grade Dashboard
See what a bank trader sees: 5 timeframes at once
Real-time strength meters showing institutional momentum
Multi-symbol analysis for correlation confirmation
AI-powered signal strength scoring
4. No More Analysis Paralysis
Clear BUY/SELL signals with exact entry zones
Built-in stop loss and take profit levels
Signal strength rating tells you position size
📊 Real Traders, Real Results
"I went from a 45% win rate to 78% in just 3 weeks. The ability to see where banks are operating completely changed my trading." - Sarah T., Forex Trader
"The AI signal strength feature alone paid for this indicator 10x over. I only take 8+ scores now and my account has never been more consistent." - Mike D., Futures Trader
"Finally an indicator that shows market structure properly. The CHOCH alerts saved me from countless losing trades." - Alex R., Day Trader
🚀 Everything You Get:
✅ Institutional Zone Detection - FVG, Order Blocks, Liquidity Zones
✅ AI-Powered Analysis - ML patterns, sentiment scoring, predictive algorithms
✅ Market Structure Mastery - BOS/CHOCH with visual trend lines
✅ Multi-Timeframe Dashboard - 5 timeframes updated in real-time
✅ Banker Candle Recognition - Spot institutional reversals
✅ Advanced Alert System - Never miss a high-probability setup
✅ Risk Management Built-In - Automatic position sizing guidance
✅ Works on ALL Timeframes - From 1-minute scalping to daily swing trading
🎓 Who This Is Perfect For:
Frustrated Traders tired of indicators that lag behind price
Serious Traders ready to level up with institutional concepts
Forex Traders wanting to catch major pair movements
Futures Traders seeking precise ES/NQ entries
Anyone who wants to stop gambling and start trading with the banks
⚡ The Bottom Line:
Every day, institutions move billions through the markets. They leave footprints. This indicator reveals them.
Stop trading blind. Start trading with institutional vision.
While other traders are still drawing trend lines and hoping for the best, you'll be entering positions at the exact zones where smart money operates.
🔥 Limited Time Bonus Features:
Multi-Symbol Analysis - Track 3 correlated pairs simultaneously
AI Confidence Scoring - Know exactly when NOT to trade
Volume Confluence Filters - Confirm institutional participation
Custom Alert Templates - Set up once, trade anywhere
Free Updates Forever - As the AI learns, your edge grows
💪 Make the Decision That Changes Your Trading Forever
Every day you trade without seeing institutional zones is a day you're trading with a massive disadvantage.
The banks aren't smarter than you. They just see things you don't.
Until you add this indicator to your chart.
Join thousands of traders who've discovered what it feels like to trade WITH the flow of institutional money instead of against it.
Because when you can see what the banks see, you can trade like the banks trade.
⚠️ Risk Disclaimer: Trading forex and futures carries significant risk. Past performance doesn't guarantee future results. This indicator is a tool for analysis, not a guarantee of profits. Always use proper risk management.
🎯 Transform your trading. See the market through institutional eyes. Get the FVG & Order Block Sync Pro Enhanced today.
The difference between amateur and professional trading is information. Now you can have both.

FVG + Breaker Block v8.6This indicator helps you identify FVGs, inverse FVGs (which are marked with a dashed line in the middle of the FVG) and potential Breaker Blocks on every time frame. You can spot 4 different types of BBs: highly potential bullish and bearish BBs are colored blue and red, and the less potential bullish and bearish BBs are colored magenta and orange, but you can change the colors to your desire.
Due to internal constraints of TradingView there is a limit on how many boxes you can plot on your screen so it is advisable not to increase the "Max Bars Back to keep FVG (candles)" above 100 or TV will not be able to plot many BB´s due to its internal limits. Increasing the number above 100 will limit the quantity of BBs boxes to be plot on TradingView.

FVG Pro: Custom Style & AlertsIntroduction The FVG Pro is an advanced Smart Money Concepts (SMC) tool designed to detect Fair Value Gaps (Imbalance) with precision. Unlike standard indicators that clutter your chart with invalid zones, this script features a "Smart Clean" logic that automatically removes zones once they are invalidated by a confirmed Candle Close.
Why Use This Indicator? Many FVG indicators fail to distinguish between a "wick test" and a true "breakout." This script solves that problem. It keeps the FVG box active if price only wicks through it, respecting the zone as a valid support/resistance until a candle body explicitly closes beyond the gap.
Key Features:
Body Break Logic: The FVG box is ONLY removed if a candle Closes beyond the zone. Wicks (tails) that pierce the zone will not delete the box, allowing you to catch precise rejections.
Auto-Extend & Clean: Boxes automatically extend to the right to follow price action and vanish instantly upon invalidation to keep your chart clean.
Smart Coloring:
Yellow Candle: Indicates a Bullish (Buy) Gap formation.
Purple Candle: Indicates a Bearish (Sell) Gap formation.
Customizable Visuals:
Includes a Middle Line (Consequent Encroachment - CE) with customizable styles (Solid/Dash/Dot).
Ghost-box transparency to ensure price action remains visible.
Advanced Alerts: Integrated alert() function triggers ONLY on bar close, ensuring zero false signals while you are away from the screen.
Settings Guide:
Mode Panjang Box: Choose "Auto Extend" to track live zones or "Fixed" for backtesting history.
Minimal Gap Size: Filter out small/insignificant gaps to reduce noise on lower timeframes.
Midline Style: Customize the 50% equilibrium line to fit your chart theme.
Disclaimer: This tool is for educational purposes and to assist in technical analysis. Always manage your risk properly.

FVG Session Break Strategy with ATR RR🧠 FVG Session Break Strategy with ATR RR — Timezone-Aware, Session-Savvy, and Risk-Calibrated
This strategy captures high-probability reversals and continuations by combining Fair Value Gap (FVG) imbalances with session-based breakout logic and ATR-calibrated risk management. It’s designed for traders who want to exploit structural inefficiencies during key market sessions — with precision and portability across global exchanges.
🔍 Core Logic:
Fair Value Gap Detection: Identifies bullish and bearish FVGs using a 3-bar displacement pattern.
Session Breakout Engine: Tracks session highs and lows (Asian, London, NY) and triggers trades only when price breaks these levels — ensuring trades occur at meaningful inflection points.
ATR-Based RR Control: Dynamically sizes stop-loss and take-profit levels using ATR × multiplier, maintaining consistent risk across volatility regimes.
🌐 Timezone-Aware Session Logic:
Session boundaries are defined in UTC-5 (e.g., NY: 0930–1600) but automatically converted to the exchange’s local timezone using timestamp("Etc/GMT+5", ...). This ensures:
Accurate session detection across all markets and assets
No manual timezone adjustments needed
Robust performance on crypto, forex, and global equities
📈 Visuals:
Session highs and lows plotted in orange
Bullish and bearish FVGs marked with green and red triangles
Strategy entries and exits shown on chart with full RR logic
This strategy is ideal for traders who want to combine structural edge with session context and disciplined risk.

FVG + OB + RSI Divergence + Volume Spikes🧠 FVG + OB + RSI Divergence + Volume Spikes – Market Structure Confluence Tool
This all-in-one indicator brings together four powerful market concepts into a single script designed to help traders identify high-probability trade setups with precision and clarity:
🔍 What It Does
✅ Fair Value Gaps (FVG)
Highlights inefficiencies in price action, showing where the market may return to “rebalance.”
✅ Order Blocks (OB)
Marks key institutional footprints — bullish and bearish order blocks based on engulfing candle structures.
✅ RSI Divergence
Detects both bullish and bearish divergences between price and RSI, signaling potential reversals.
✅ Volume Spikes
Flags bars where volume significantly exceeds the average — a common footprint of smart money.
🎯 How to Use
Use this tool to spot confluences between price inefficiencies (FVG), key reversal zones (OB), momentum shifts (RSI Divergence), and institutional interest (Volume Spikes). The best setups often occur when multiple signals align — especially at key support/resistance or trend zones.
⚙️ Inputs
RSI length (for divergence)
Volume spike sensitivity (multiplier)
Lookback for Order Blocks and FVGs
⚠️ Notes
This is a non-repainting tool.
Ideal for price action, SMC, ICT, and order flow traders.
Combine with your existing strategy and higher time frame bias for best results.

FVG + Bollinger + Toggles + Swing H&L (Taken/Close modes)This indicator combines multiple advanced market-structure tools into one unified system.
It detects A–C Fair Value Gaps (FVG) and plots them as dynamic boxes projected a fixed number of bars forward.
Each bullish or bearish FVG updates in real time and “closes” once price breaks through the opposite boundary.
The indicator also includes Bollinger Bands based on EMA-50 with adjustable deviation settings for volatility context.
Swing Highs and Swing Lows are identified using pivot logic and are drawn as dynamic lines that change color once taken out.
You can choose whether swings end on a close break or on any touch/violation of the level.
All visual elements—FVGs, Bollinger Bands, and Swing Lines—can be individually toggled on or off from the settings panel.
A time-window session box is included, allowing you to highlight a custom intraday window based on your selected timezone.
The session box automatically tracks the high and low of the window and locks the final range once the window closes.
Overall, the tool is designed for traders who want a structured, multi-layered view of liquidity, volatility, and intraday timing.

FVG Strategy with One Trade Per Hour and Tick-based TP/SLThis strategy hunts for Fair Value Gaps (FVGs)—three-bar displacement gaps that mark imbalances where price moved so fast it left a “void.” It detects bullish (green) and bearish (red) FVGs on the chart timeframe or a higher timeframe you choose via the Timeframe input. Each detected zone is stored and optionally drawn as a box (static or “dynamic” that tightens with price). A simple threshold lets you filter out tiny gaps: either set a fixed percent (Threshold %) or let the script estimate it automatically. As price trades later, the engine watches for interaction with any stored zone.
Entries are taken on a touch/retest of the zone: buy when price intersects a green (bullish) FVG; short when it intersects a red (bearish) FVG. Risk management is manual and straightforward—your stop loss and take profit are set in ticks, placed off the signal bar’s close. To avoid over-trading, there’s a cap of one trade per hour (it resets when the clock hour changes). In short, it’s an intraday “gap fill / bounce” system: identify an imbalance, wait for price to revisit it, and take a directional trade with fixed tick targets and stops.

FVG Candle TYHE42This indicator highlights potential Fair Value Gaps (FVGs) directly on the relevant candle by changing its body color.
The logic is simple yet effective:
A bullish FVG is detected when the current low is above the high from two candles back.
A bearish FVG is detected when the current high is below the low from two candles back.
When such a gap is detected, the previous candle is colored (default: yellow) to provide a clean, unobtrusive visual cue. This helps traders quickly identify price imbalances without cluttering the chart with shapes or labels.
Users can customize the highlight color from the settings to better suit their chart theme or personal preference.
This indicator is especially useful for traders using Smart Money Concepts (SMC), ICT, or other price imbalance-based strategies.

FVG + Inversion + MidlineThis is a rough version. Still in works.
Off Mode - Shows bullish and bearish FVGS
Only Mode - Only shows inverted FVGs in white (those above price are usually resistance zones and below tend to be support with the more recent and higher timeframe ones being most relevant)
Blended - Shows Both
You can adjust the amount of zones to be shown to modify the lookback period.
You can also adjust the price range by a standard deviation of 100% to only cover a specific price range.
Rest of the features are still being cleaned or irrelevant for the most part.

FVG Donchian Channel strategy30min FVG + Donchian Channel strategy
buy sell by 30min fvg
and stoploss , take profit by Donchian Channel
Run the strategy on the 1min timeframe!

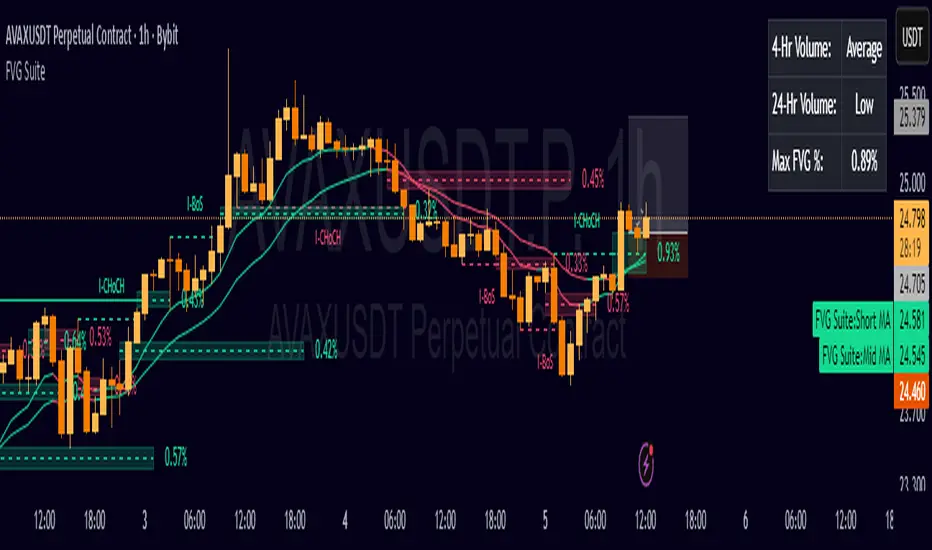
FVG SuiteSupercharge your charts with FVG Suite! Detect Smart Money structures, Fair Value Gaps, and key Multi-Timeframe levels—all in one powerful indicator. Perfect for both intraday and swing traders.
⚡ Highlights:
📈 Smart Money Structure: BoS & CHoCH signals with customizable colors and sensitivity.
💎 Fair Value Gaps: Bullish & Bearish FVGs with filters, max extension, and automatic cleanup.
🕒 Multi-Timeframe Levels: Daily, Weekly, and Monthly Highs & Lows with solid/dashed/dotted lines.
📊 Volume Activity: Real-time 4H & 24H volume analysis in a neat table.
🎨 Fully Customizable: Colors, transparency, and labels for a clean, easy-to-read chart.
Make smarter trade decisions with clear market structure insights and gap detection! 🚀
XAUUSD (FVG) Size FilteringFVG indicator for XAUUSD with size filtering
Marks only the ones you decide are big enough for your strategy, ignores the small ones
Configurable look back and forward plot settings
FVG size is determined by value of AMEX:USD
Green for Bulls
Red for Bears
FVG Highlighter for ThinkTankLLCThis indicator highlights fair value gaps (FVGs) by marking them as green (for bullish) and red (for bearish).
It also shows the 50% consequent encroachment (C.E.) of each FVG with a horizontal line in the middle.

FVG Detector (Gholam version)The Fair Value Gap (FVG) Detector is a powerful tool designed to identify and highlight potential imbalance areas in the market. Fair Value Gaps, also known as "FVG" or "Liquidity Gaps," are price ranges where there has been little or no trading activity. These gaps can often act as key levels of support or resistance and may represent areas where price is likely to return to for a fill, providing potential trading opportunities.
This indicator automatically scans and marks these gaps on the chart, helping traders quickly spot areas of interest for potential reversals or continuation patterns.

FVG Supply and DemandThis indicator combines powerful tools into one:
• Supply & Demand Zones built from swing highs/lows with ATR-based zone width, POI markers, and Break-of-Structure (BOS) detection.
• Volumized Fair Value Gaps (FVGs) showing bullish/bearish gaps, total volume inside the gap, volume distribution, optional zone-combining, and auto-cleanup.
• Swing TSL Line and manage bar color.
It helps visualize key imbalance areas, institutional zones, and price reaction points.
Credits to the Author.
⚠️ Disclaimer
This indicator is provided for educational and analytical purposes only.
It does not provide trading advice.
Past results do not guarantee future outcomes.
Use responsibly and in conjunction with your market analysis.

