FVG Theory - MTFThe indicator displays FVGs and Swings from different timeframes and marks the resistance!
Components:
Swings:
A swing is a 3-candle formation based on the Williams Fractal Indicator.
The interaction with the last swing is always displayed as a red line. This allows you to recognize the last interaction directly and draw conclusions about the further course of the price (sweep / break).
In addition, the closest fractal is always shown as a green line, which acts as a potential target.
2. FVGs:
FVGs are also known as Inbalance, it is a 3 candle formation where a gap is created in the market. The market often runs into this and reacts.
Theory:
When the weekly timeframe creates an bullish FVG, the market often reacts to it and reaches the high.
However, resistance must also be taken into account: this is the FVG that has not yet been reached and is in a higher timeframe than the entry.
For example: we have a weekly FVG as context and are trading in H4.
If an open daily FVG is against us in this way, it is marked as resistance.
The market must first react to this in H4 and break this resistance high for a good trade setup!
That is why the indicator shows the FVGs from the different timeframes, displaying the last reaction as well as the closest FVG that is still open.
The same applies if you take everything one timeframe lower: e.g. daily, H4 and H1.
You can easily set the different timeframes in the indicator.
Here we have a daily context, an H4 resistance (FVG against us) and the H1 structure!
Higher FVG are stronger!
If, for example, we follow the H4 FVG and a daily FVG forms below us, it is more likely that the market will take the larger FVG. This is always shown with the indicator!
Structure:
Overlaps are drawn when the new FVG overlaps with the structure (body or wick).
The FVG has differnt codes!
FVG codes:
↑ = bullish FVG
↓ = bearish FVG
↑↑ = breakaway gaps --> close of the third candle is above the second candle
↓↓ = breakaway gaps --> close of the third candle is below the second candle
❗ = 3rd candle of the FVG has already reacted deeply into the potential FVG!
🔪 = Sharp Turn --> FVG is taken out from the new FVG in the other direction!
🔥 = Order flow (reaction from previous FVG)
🚀 = 2CR --> reaction high/low from previous FVG is run down with FVG!
Indicator settings:
You can set the FVGs, overlaps, and swings in up to 4 different timeframes. You can switch these on and off, as well as change all colours!
The highest timeframe has the additional function of displaying the context (last fractal high and low from the current FVG).
Cari dalam skrip untuk "fvg"

First FVG After 9:30 AM ET + Opening Range (1min) OK# FVG + Opening Range Breakout Indicator (1M)
## Overview
A professional trading indicator designed for 1-minute candlestick charts that identifies Fair Value Gaps (FVG) and Opening Range breakout patterns with precise entry signals for institutional trading strategies.
## Key Features
### 1. Fair Value Gap Detection (FVG)
- **Automatic Detection**: Identifies the first FVG after 9:30 AM ET
- **Support for Both Types**:
- **Bearish FVG**: Gap formed when candle 3 high is below candle 1 low (downward gap)
- **Bullish FVG**: Gap formed when candle 3 low is above candle 1 high (upward gap)
- **Visual Representation**: Blue box marking the exact gap zone
- **Active Period**: 9:30 AM - 2:00 PM ET only
### 2. FVG Entry Signals
- **SELL Signal (Bearish FVG)**: Generated when price enters and respects the gap
- Triggers when close stays within the FVG range
- Multiple signals allowed on retests
- Position label placed above bearish candles
- **BUY Signal (Bullish FVG)**: Generated when price breaks above FVG top
- Triggers when close breaks above fvgHigh
- Allows multiple signals on subsequent retests
- Position label placed below bullish candles
### 3. Opening Range (9:30 - 10:00 AM ET)
- **Three Key Levels**:
- **OR High** (Red Dashed Line): Highest point during opening 30 minutes
- **OR Low** (Green Dashed Line): Lowest point during opening 30 minutes
- **OR Mid** (Orange Dotted Line): Midpoint between High and Low
- **Lines Extend**: 100 bars into the session for reference
### 4. Opening Range Breakout Signals
Detects breakouts from the opening range with a refined entry strategy:
- **BUY Signal (OR High Breakout)**:
1. Price breaks ABOVE OR High (high1m > orHigh)
2. Waits minimum 5 candles
3. Price retests OR High level (close ≤ orHigh)
4. Price rebounds UPWARD (close > orHigh)
5. Signal generated with label "BUY"
- **SELL Signal (OR Low Breakout)**:
1. Price breaks BELOW OR Low (low1m < orLow)
2. Waits minimum 5 candles
3. Price retests OR Low level (close ≥ orLow)
4. Price rebounds DOWNWARD (close < orLow)
5. Signal generated with label "SELL"
### 5. Time Filters
- **Session Start**: 9:30 AM ET (Market Open)
- **Session End**: 2:00 PM ET (14:00)
- **All signals only generated within this window**
- **Daily Reset**: All data clears at market open each trading day
## Settings
| Parameter | Default | Description |
|-----------|---------|-------------|
| FVG Box Color | Blue (80% transparent) | Visual color of FVG zone |
| FVG Border Color | Blue | Border line color |
| Border Width | 1 | Thickness of FVG box border |
| Box Extension Right | 20 bars | How far right the box extends |
| Box Extension Left | 5 bars | How far left the box extends |
| Minimum FVG Size | 5.0 points | Minimum gap size to display |
| FVG Respect Tolerance | 2.0 points | Price tolerance for FVG respect |
| Show FVG Labels | True | Display "First FVG" label |
| Show Signals | True | Display SELL/BUY entry signals |
| Show Opening Range | True | Display OR High/Low/Mid lines |
| OR High Color | Red (80% transparent) | OR High line color |
| OR Low Color | Green (80% transparent) | OR Low line color |
| OR Mid Color | Orange (80% transparent) | OR Mid line color |
| OR Line Width | 2 | Thickness of OR lines |
| OR Line Length | 100 bars | Extension of OR lines |
| Timezone Offset | -5 (EST) | UTC offset (-4 for EDT) |
## Trading Strategy Integration
### Institutional Trading Approach
This indicator combines two professional trading methodologies:
1. **Fair Value Gap Trading**: Exploits market inefficiencies (gaps) that institutional traders fill during the day
2. **Opening Range Breakout**: Captures momentum moves that break out of the morning consolidation
### Optimal Use Cases
- **Asian Session into London Open**: Monitor FVG formation
- **Pre-Market Gap Analysis**: Plan breakout trades
- **Early Morning Momentum**: Catch OR breakouts with precision entries
- **Intraday Scalping**: Use signals for quick risk/reward entries
### Risk Management
- Entry signals clearly marked with labels
- Trailing stops can be set at OR levels
- Multiple timeframe confirmation recommended
- Always use stop losses below/above key levels
## Signal Interpretation
| Signal | Type | Action | Location |
|--------|------|--------|----------|
| SELL | FVG Bearish | Short Entry | Above bearish candle |
| BUY | FVG Bullish | Long Entry | Below bullish candle |
| BUY | OR High Breakout | Long Entry | Above OR High |
| SELL | OR Low Breakout | Short Entry | Below OR Low |
## Color Scheme
- **Red**: Bearish direction (SELL signals, OR High)
- **Green**: Bullish direction (BUY signals, OR Low)
- **Orange**: Neutral reference (OR Mid point)
- **Blue**: FVG zones (gaps)
- **Yellow**: Background during FVG search phase
## Notes
- Indicator works exclusively on 1-minute charts
- Requires market open data (9:30 AM ET)
- All times referenced to Eastern Time (ET)
- Historical data should include full trading day for accuracy
- Use with volume and momentum indicators for confirmation
---
**Designed for professional traders using institutional-grade trading methodologies**

BuLLzEyE_MNQ FVG/IFVG SystemFVG Boxes
These are the main trading zones. The indicator automatically detects Fair Value Gaps and draws boxes on your chart:
• GREEN boxes = Bullish FVG (potential buy zone)
• RED boxes = Bearish FVG (potential sell zone)
• YELLOW boxes = IFVG (Inverse FVG - filled gaps that now act as support/resistance)
• GRAY boxes = Mitigated FVG (gap has been filled)
• WHITE dashed line = 50% level (optimal entry point within the FVG)
Session Boxes
Session boxes show you the high/low range of each major trading session. This helps identify where liquidity sits:
• PURPLE = Asia Session (6:00 PM - 3:00 AM ET)
• BLUE = London Session (3:00 AM - 12:00 PM ET)
• ORANGE = New York Session (9:30 AM - 4:00 PM ET)
• TEAL = Sydney Session (5:00 PM - 2:00 AM ET)
• LIME GREEN = Kill Zone / London-NY Overlap (8:00 AM - 11:00 AM ET) - BEST TRADING TIME
Entry Signals
• GREEN triangle pointing UP = Long entry signal at a Bullish FVG (not 100% reliable)
• RED triangle pointing DOWN = Short entry signal at a Bearish FVG (not 100% reliable)
Liquidity Sweeps
• RED X with 'SWEEP' = Previous Day High (PDH) was swept
• GREEN X with 'SWEEP' = Previous Day Low (PDL) was swept
• Dotted lines = PDH (red) and PDL (green) levels
Information Tables
HTF Bias Table (Top Right): Shows whether the higher timeframe (default 15m) is bullish or bearish, the number of active FVGs, and whether you're in the trading session.
Risk Calculator Table (Bottom Right): Shows your risk amount and calculates how many contracts you can trade for different stop loss sizes (5pt, 10pt, 15pt).
How It Works
What is a Fair Value Gap?
A Fair Value Gap (FVG) is a 3-candle pattern where aggressive buying or selling creates a price void. Specifically, it's when the wick of the first candle doesn't overlap with the wick of the third candle, leaving a gap in between. Price tends to return to these gaps to 'rebalance' before continuing in the original direction.
What is an Inverse FVG?
When an FVG gets filled (price returns and closes through the gap), it becomes an Inverse FVG (IFVG). These zones flip their polarity - a filled Bullish FVG becomes resistance, and a filled Bearish FVG becomes support. The indicator automatically converts mitigated FVGs to yellow IFVG boxes.
The 50% Entry Level
The dashed white line in each FVG represents the 50% level (also called Consequent Encroachment). This is considered the optimal entry point - it's the middle of the imbalance where price is most likely to react.
Suggested Trading Strategy
1. Check HTF Bias (top right table) - only trade in that direction
2. Wait for a liquidity sweep (SWEEP label appears)
3. Look for an FVG to form AFTER the sweep
4. Enter when price returns to the 50% level (dashed line)
5. Place stop loss below/above the FVG (add 2 ticks buffer)
6. Take profit at 1:2 or 1:3 risk-to-reward ratio
Settings Explained
FVG Settings
• Min FVG Size: Minimum gap size in points to be considered valid (default: 2.0)
• Max FVG Age: How many bars until an FVG is removed from chart (default: 50)
• Show 50% Entry Level: Toggle the dashed entry line on/off
Session Settings
• Show Session Boxes: Toggle all session boxes on/off
• Max Sessions to Show: How many historical sessions to display (default: 5)
• Individual Session Toggles: Turn each session (Asia/London/NY/Sydney/Kill Zone) on or off
Risk Calculator Settings
• Account Size: Your trading account balance
• Risk Per Trade: Percentage of account to risk per trade (default: 0.5%)
• Tick Value/Size: Contract specifications for MNQ ($0.50 per tick, 0.25 point tick size)
Tips for Best Results
1. Trade during the Kill Zone (8:00-11:00 AM ET) for best volatility and liquidity
2. Always align trades with HTF bias - don't fight the trend
3. Wait for liquidity sweeps before entering - this confirms smart money activity
4. Use the 50% level for entries - it offers the best risk-to-reward
5. Watch for IFVG zones as additional confluence for entries
6. Use the risk calculator to size positions properly - never risk more than you can afford
7. Session boxes help identify where stops are clustered - sweeps of these levels often precede reversals
Available Alerts
• New FVG Formed (Bullish or Bearish)
• Price Touching 50% Entry Level
• FVG Mitigated (gap filled)
• Long Entry Signal
• Short Entry Signal
• PDH/PDL Liquidity Sweep
─────────────────────────────────────
Created by BullyTrading
Designed for MNQ Prop Firm Trading

FVG Visual Trading ToolHow to Use the FVG Tool
1. Identify the FVG Zone
Bullish FVG: Look for green boxes that represent potential support zones. These are areas where price is likely to retrace before continuing upward.
Bearish FVG: Look for red boxes that represent potential resistance zones. These are areas where price is likely to retrace before continuing downward.
2. Set Up Your Trade
Entry: Place a limit order at the retracement zone (inside the FVG box). This ensures you enter the trade when the price retraces into the imbalance.
Stop-Loss (SL): Place your stop-loss just below the FVG box for bullish trades or just above the FVG box for bearish trades. The tool provides a suggested SL level.
Take-Profit (TP): Set your take-profit level at a 2:1 risk-reward ratio (or higher). The tool provides a suggested target level.
3. Let the Trade Run
Once your trade is set up, let it play out. Avoid micromanaging the trade unless market conditions change drastically.
Step-by-Step Example
Bullish FVG Trade
Identify the FVG:
A green box appears, indicating a bullish FVG.
The tool provides the target price (e.g., 0.6371) and the stop-loss level (e.g., 0.6339).
Set Up the Trade:
Place a limit buy order at the retracement zone (inside the green box).
Set your stop-loss just below the FVG box (e.g., 0.6339).
Set your take-profit at a 2:1 risk-reward ratio or the suggested target (e.g., 0.6371).
Monitor the Trade:
Wait for the price to retrace into the FVG zone and trigger your limit order.
Let the trade run until it hits the take-profit or stop-loss.
Bearish FVG Trade
Identify the FVG:
A red box appears, indicating a bearish FVG.
The tool provides the target price and the stop-loss level.
Set Up the Trade:
Place a limit sell order at the retracement zone (inside the red box).
Set your stop-loss just above the FVG box.
Set your take-profit at a 2:1 risk-reward ratio or the suggested target.
Monitor the Trade:
Wait for the price to retrace into the FVG zone and trigger your limit order.
Let the trade run until it hits the take-profit or stop-loss.
Key Features of the Tool in Action
Visual Clarity:
The green and red boxes clearly show the FVG zones, making it easy to identify potential trade setups.
Labels provide the target price and stop-loss level for quick decision-making.
Risk-Reward Management:
The tool encourages disciplined trading by providing predefined SL and TP levels.
A 2:1 risk-reward ratio ensures that profitable trades outweigh losses.
Hands-Off Execution:
By placing limit orders, you can let the trade execute automatically without needing to monitor the market constantly.
Best Practices
Trade in the Direction of the Trend:
Use higher timeframes (e.g., 4-hour or daily) to identify the overall trend.
Focus on bullish FVGs in an uptrend and bearish FVGs in a downtrend.
Combine with Confirmation Signals:
Look for additional confirmation, such as candlestick patterns (e.g., engulfing candles) or indicator signals (e.g., RSI, MACD).
Adjust Parameters for Volatility:
For highly volatile markets, consider increasing the stop-loss percentage to avoid being stopped out prematurely.
Avoid Overtrading:
Not every FVG is a good trading opportunity. Be selective and only trade setups that align with your strategy.
Backtest and Optimize:
Use historical data to test the tool and refine your approach before trading live.
Common Mistakes to Avoid
Entering Without Confirmation:
Wait for price to retrace into the FVG zone before entering a trade.
Avoid chasing trades that have already moved away from the zone.
Ignoring Risk Management:
Always use a stop-loss to protect your account.
Stick to a consistent risk-reward ratio.
Trading Against the Trend:
Avoid taking trades that go against the prevailing market trend unless there is strong evidence of a reversal.
Final Thoughts
The FVG Visual Trading Tool is a powerful aid for identifying high-probability trade setups. By following the steps outlined above, you can use the tool to trade with confidence and discipline. Remember, no tool guarantees success, so always combine it with sound trading principles and proper risk management

FVG and OB🧠 Concept Behind the “FVG and OB” Indicator
This indicator merges two core ICT (Inner Circle Trader) concepts — Fair Value Gaps (FVGs) and Order Blocks (OBs) — into one clean, dynamic visualization tool.
It is designed for professional price-action traders who want to track institutional imbalances and smart money footprints directly on the chart.
🟩 FAIR VALUE GAP (FVG)
An FVG represents an imbalance in price caused by aggressive buying or selling where the market fails to offer two-way liquidity.
It’s typically created when a strong candle leaves a visible “gap” between the previous candle’s high and the next candle’s low (for bullish FVG), or vice versa (for bearish FVG).
In this indicator:
🟢 Bullish FVGs are drawn when low > high
🔴 Bearish FVGs are drawn when high < low
Each gap box dynamically extends to the right until it is mitigated (partially or fully filled).
You can choose between two mitigation modes:
Boundary Touch (default): The FVG is considered mitigated once price touches the gap boundary.
Full Fill: The FVG remains active until the entire gap range is filled.
This gives you real-time awareness of whether liquidity has been rebalanced — a key ICT concept in identifying market turning points.
🟥 ORDER BLOCK (OB)
An Order Block represents the last opposing candle before a strong impulsive move.
It is where institutional traders likely executed large block orders, creating supply or demand zones that price often revisits.
In this script, an OB is automatically drawn:
🟥 Bearish OBs form after a strong down move (usually following a bearish FVG).
🟩 Bullish OBs form after a strong up move (usually following a bullish FVG).
Key features:
The indicator can detect OBs in two ways:
Only FVG’s First Candle: A stricter mode aligning OB formation directly with FVG events.
Classic (Last Opposite Color): A more traditional ICT-style detection that finds the last candle of the opposite color within a defined lookback range.
OBs auto-expand with the next candle’s wick, so any extra high/low beyond the original OB is included by default.
Each OB remains extended until mitigated — when price revisits and closes the imbalance.
⚙️ CONTROL & CUSTOMIZATION
You can control the entire behavior and visualization through the settings panel:
Display Mode: Show only FVGs, only OBs, or both simultaneously.
Mitigation Mode: Choose how strict the FVG closure logic should be.
Body-Only Option: Restrict OB calculation to candle bodies instead of wicks for cleaner structure.
Individual Color Settings: Customize border and fill colors for each block type.
Lookback Depth: Define how far back the system searches for valid OB structures.
The result is a clean, layered representation of institutional footprints — with automatic cleanup logic that prevents chart clutter and keeps only active zones visible.
📊 PRACTICAL APPLICATION
Use this indicator to:
Identify imbalances left by aggressive moves (potential retracement targets).
Confirm confluences between FVGs and OBs — the overlap areas often mark powerful reaction zones.
Track mitigation progress as price revisits those zones.
Refine entry timing when price reacts to unmitigated OBs or fills the last untested FVG.
🧩 TECHNICAL DESIGN
Built in Pine Script v5 with fully modular code architecture.
FVG and OB modules can be toggled or used independently.
Uses arrays for efficient management of multiple boxes.
Auto-updates in real-time and mitigates per-bar to minimize lag.
Designed for multi-timeframe backtesting compatibility.
💡 Summary
This tool visually bridges two of the most powerful Smart Money Concepts —
FVG = imbalance zones and OB = institutional origin blocks.
Together, they help traders map out liquidity flows, identify premium/discount zones, and anticipate where price is likely to react next.
🧑💻 Credits
Based on ICT & Smart Money Concepts, rewritten in modular PineScript with precision mitigation logic.
# For educational and analytical purposes only.

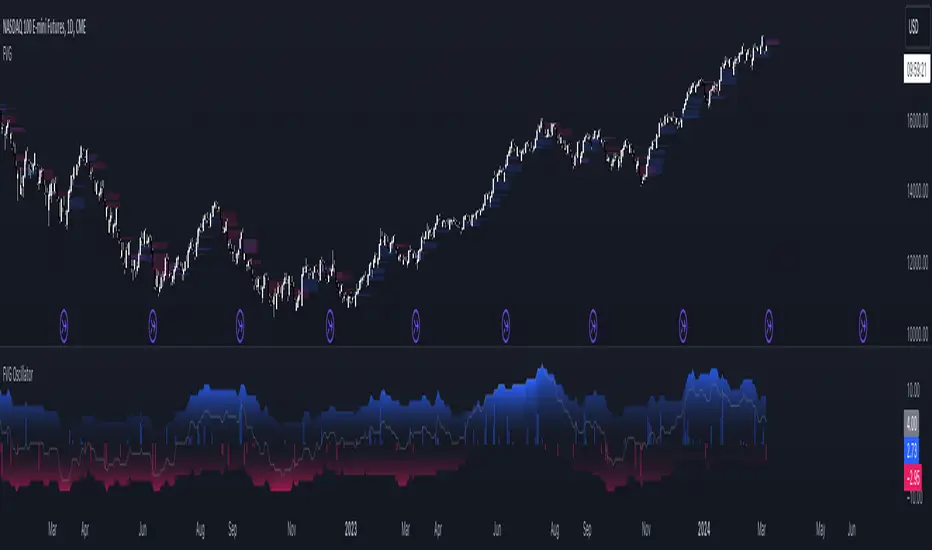
FVG OscillatorThe FVG Oscillator, developed by OmegaTools and available on TradingView, is a specialized analytical tool designed to offer traders insight into the market's potential direction through the lens of Fair Value Gaps (FVGs). This script combines traditional oscillator functionality with a unique focus on FVGs, providing a nuanced approach to understanding market dynamics.
Understanding FVGs and Their Importance:
Fair Value Gaps (FVGs) are identified when there's a discrepancy between the high price of one session and the low of the subsequent session (or vice versa), indicating areas where price movements have skipped over, creating a gap. These gaps often signal potential price movement areas, as markets may move to "fill" these gaps. The FVG Oscillator is designed to quantify these occurrences and their potential impact on market direction.
Key Features of the FVG Oscillator:
- Adjustable Lookback Period: Traders can set the number of bars back (defaulted at 50) to adjust the sensitivity of the oscillator to recent market activity.
- Visual Area Representation: The option to display areas of positive and negative FVG occurrences provides a visual representation of market sentiment over the selected period.
- Color Customisation: Users can personalize the oscillator's appearance with color selections for positive and negative movements, enhancing readability and analysis.
- Volume and ATR Confirmation: Incorporates volume data and Average True Range (ATR) filtering to verify FVG occurrences, adding a layer of validation to the identified gaps.
Operational Mechanism:
The oscillator tallies bullish FVG occurrences as positive values and bearish FVG occurrences as negative values over the specified lookback period. It then applies volume and ATR criteria to confirm the significance of these gaps. The final output is an oscillator line that reflects the net value of bullish versus bearish FVGs, alongside histograms that show the width (or significance) of long and short patterns based on confirmed FVGs.
How to Use the FVG Oscillator:
- After adding the FVG Oscillator to your TradingView chart, adjust the 'Bars Back' input to tailor the oscillator's sensitivity to your trading strategy.
- Use the net value line to gauge the overall market sentiment based on FVG occurrences; a higher net value suggests bullish sentiment, while a lower value indicates bearish sentiment.
- The histograms provide an additional layer of insight, highlighting the relative strength and significance of confirmed bullish and bearish FVGs.
Application in Trading:
The FVG Oscillator is intended as an analytical tool to complement your existing trading strategy. By offering a unique perspective on FVG occurrences and their potential market implications, the oscillator can help inform your trading decisions. However, traders are encouraged to combine this tool with other forms of analysis and employ sound risk management practices.
Originality and Usefulness:
This oscillator is original in its integration of FVG analysis with traditional oscillator metrics, offering traders a novel tool for market analysis. Its usefulness lies in its ability to provide a quantitative and visual representation of FVGs, aiding traders in identifying potential market movements.
Disclaimer:
It is important for traders to understand that the financial markets are inherently unpredictable, and the FVG Oscillator is not a predictive tool nor does it guarantee trading success. It should be used as part of a comprehensive trading strategy, incorporating additional market analysis and risk management practices. Remember, past performance does not necessarily predict future results, and trading involves risks, including the potential loss of capital.
FVG Maxing - Fair Value Gaps, Equilibrium, and Candle Patterns
What this script does
This open-source indicator highlights 3-candle fair value gaps (FVGs) on the active chart timeframe, draws their midpoint ("equilibrium") line, tracks when each gap is mitigated, and optionally marks simple candle patterns (engulfing and doji) for confluence. It is intended as an educational tool to study how price interacts with imbalances.
3-candle bullish and bearish FVG zones drawn as forward-extending boxes.
Equilibrium line at 50% of each gap.
Different styling for mitigated vs unmitigated gaps.
Compact statistics panel showing how many gaps are currently active and filled.
Optional overlays for bullish/bearish engulfing patterns and doji candles.
1. FVG logic (3-candle gaps)
The script focuses on a strict 3-candle definition of a fair value gap:
Three consecutive candles with the same body direction.
The wick of candle 3 is separated from the wick of candle 1 (no overlap).
A bullish gap is created when price moves up fast enough to leave a gap between candle 1 and 3. A bearish gap is the mirror case to the downside.
In Pine, the core detection looks like this:
// Three candles with the same body direction
bull_seq = close > open and close > open and close > open
bear_seq = close < open and close < open and close < open
// Wick gap between candle 1 and candle 3
bull_gap = bull_seq and low > high
bear_gap = bear_seq and high < low
// Final FVG flags
is_bull_fvg = bull_gap
is_bear_fvg = bear_gap
For each detected FVG:
Bullish FVG range: from high up to low (gap below current price).
Bearish FVG range: from low down to high (gap above current price).
Each zone is stored in a custom FVGData structure so it can be updated when price later trades back inside it.
2. Equilibrium line (0.5 of the gap)
Every FVG box gets an optional equilibrium line plotted at the midpoint between its top and bottom:
eq_level = (top + bottom) / 2.0
right_index = extend_boxes ? bar_index + extend_length_bars : bar_index
bx = box.new(bar_index - 2, top, right_index, bottom)
eq_ln = line.new(bar_index - 2, eq_level, right_index, eq_level)
line.set_style(eq_ln, line.style_dashed)
line.set_color(eq_ln, eq_color)
You can use this line as a neutral “fair value” reference inside the zone, or as a simple way to think in terms of premium/discount within each gap.
3. Mitigation rules and styling
Each FVG stays active until price trades back into the gap:
Bullish FVG is considered mitigated when the low touches or moves below the top of the gap.
Bearish FVG is considered mitigated when the high touches or moves above the bottom of the gap.
When that happens, the script:
Marks the internal FVGData entry as mitigated.
Softens the box fill and border colors.
Optionally updates the label text from "BULL EQ / BEAR EQ" to "BULL FILLED / BEAR FILLED".
Can hide mitigated zones almost completely if you only want to see unfilled imbalances.
This allows you to distinguish between current areas of interest and zones that have already been traded through.
4. Candle pattern overlays (engulfing and doji)
For additional confluence, the script can mark simple candle patterns on top of the FVG view:
Bullish engulfing — current candle body fully wraps the previous bearish body and is larger in size.
Bearish engulfing — current candle body fully wraps the previous bullish body and is larger in size.
Doji — candles where the real body is small relative to the full range (high–low).
The detection is based on basic body and range geometry:
curr_body = math.abs(close - open)
prev_body = math.abs(close - open )
curr_range = high - low
body_ratio = curr_range > 0 ? curr_body / curr_range : 1.0
bull_engulfing = close > open and close < open and open <= close and close >= open and curr_body > prev_body
bear_engulfing = close < open and close > open and open >= close and close <= open and curr_body > prev_body
is_doji = curr_range > 0 and body_ratio <= doji_body_ratio
On the chart, they appear as:
Small triangle markers below bullish engulfing candles.
Small triangle markers above bearish engulfing candles.
Small circles above doji candles.
All three overlays are optional and can be turned on or off and recolored in the CANDLE PATTERNS group of inputs.
5. Inputs overview
The script organizes settings into clear groups:
DISPLAY SETTINGS : Show bullish/bearish FVGs, show/hide mitigated zones, box extension length, box border width, and maximum number of boxes.
EQUILIBRIUM : Toggle equilibrium lines, color, and line width.
LABELS : Enable labels, choose whether to label unmitigated and/or mitigated zones, and select label size.
BULLISH COLORS / BEARISH COLORS : Separate fill and border colors for bullish and bearish gaps.
MITIGATED STYLE : Opacity used when a gap is marked as mitigated.
STATISTICS : Toggle the on-chart FVG statistics panel.
CANDLE PATTERNS : Show engulfing patterns, show dojis, colors, and the body-to-range threshold that defines a doji.
6. Statistics panel
An optional table in the corner of the chart summarizes the current state of all tracked gaps:
Total number of FVGs still being tracked.
Number of bullish vs bearish FVGs.
Number of unfilled vs mitigated FVGs.
Simple fill rate: percentage of tracked FVGs that have been marked as mitigated.
This can help you study how a particular market tends to treat gaps over time.
7. How you might use it (examples)
These are usage ideas only, not recommendations:
Study how often your symbol mitigates gaps and where inside the zone price tends to react.
Use higher-timeframe context and then refine entries near the equilibrium line on your trading timeframe.
Combine FVG zones with basic candle patterns (engulfing/doji) as an extra visual anchor, if that fits your process.
Hope you enjoy, give your feedback in the comments!
- officialjackofalltrades

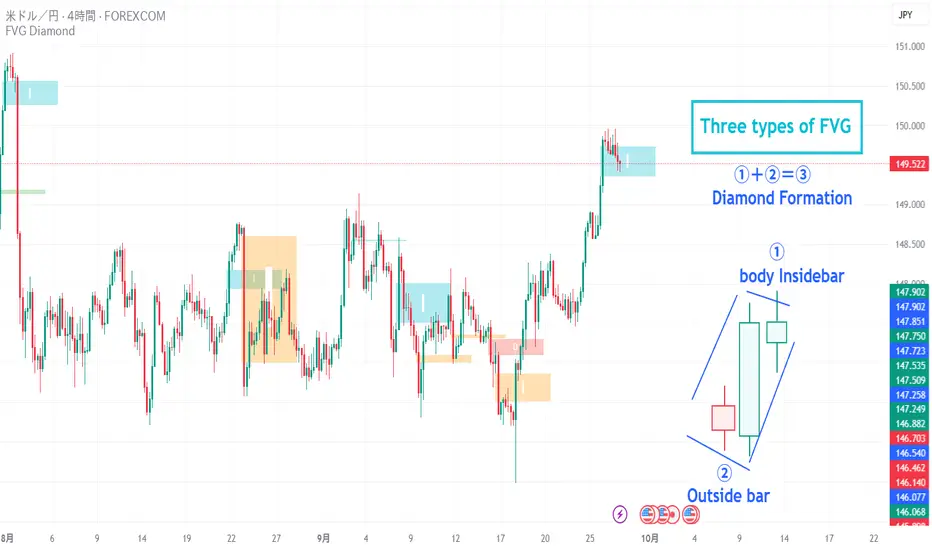
FVG Diamond📊 Overview
FVG Diamond is an advanced indicator that detects three specific price action patterns: Inside Bar, Outside Bar, and Diamond Formation. Unlike basic FVG tools, it focuses on these higher-level setups for more precise analysis.
✨ Key Features
🎯 Detection of 3 Advanced FVG Pattern Types
Independent on/off toggle for each pattern
Inside FVG (Inside Bar / Harami): The body of the 3rd candle forms an inside bar relative to the 2nd candle
Outside FVG (Outside Bar / Engulfing): The body of the 1st candle forms an outside bar relative to the 2nd candle
Diamond FVG (Diamond Formation): A unique pattern that satisfies both Inside and Outside conditions
🎯 Mitigation Feature
ON: FVG boxes are automatically removed once price fully fills the FVG zone (keeps the chart clean by showing only active FVGs)
OFF: FVG boxes remain on the chart indefinitely (allows full historical review of all FVGs)
🎨 Visual Features
Color Coding: Assign unique colors to each pattern type
Transparency Control: Default 70% transparency for optimal readability
Extension Display: Extend the right edge of FVG boxes for any number of bars
⚙️ Advanced Configuration
Threshold Settings
Manual Threshold: Define a minimum gap size by percentage
Auto Threshold: Dynamically adjusts based on market volatility
Mitigation Tools
Real-Time Mitigation: Automatic removal when price fills an FVG zone
Mitigation Levels: Display filled FVG levels with dashed lines
🔔 Alerts
Notification on new Bullish/Bearish FVG detection
Notification when an FVG is mitigated (filled)
Works with all FVG types
📈 How to Use
Add the indicator to your chart
The three advanced FVG patterns will be detected and displayed automatically
Set your preferred threshold (0% = detect all gaps)
⚠️ Note: This indicator is designed as an analysis support tool. Trading decisions should be made in combination with other methods of technical and fundamental analysis.
Author: omochi_
Version: 1.0
Last Updated: September 28, 2025
FVG & IFVG Box Detector
The "FVG & IFVG Box Detector" is a custom Pine Script v6 indicator for TradingView that identifies and highlights Fair Value Gaps (FVGs) and their subsequent mitigation as Imbalance Fair Value Gaps (IFVGs) on a price chart. Tailored for use on a 5-minute timeframe (though it must be manually set by the user due to script limitations), this indicator provides a visual representation of market imbalances using colored boxes, which automatically disappear when the gaps are filled by price action. The script is designed to be clean and minimalistic, omitting text labels or annotations as per your preference.Key FeaturesFVG Detection:A Bullish FVG is detected when the low of the current candle is higher than the high of the candle two bars ago, indicating a potential upward imbalance, visualized with a green-bordered box filled with a semi-transparent green background.
A Bearish FVG is detected when the high of the current candle is lower than the low of the candle two bars ago, indicating a potential downward imbalance, visualized with a red-bordered box filled with a semi-transparent red background.
A minimum gap size filter (default 0%) can be adjusted to exclude small gaps, ensuring only significant imbalances are highlighted.
IFVG Transition:When a Bearish FVG is filled (price closes below its lower boundary), the red box disappears, and a blue-bordered box with a semi-transparent blue background briefly appears to mark the Bullish IFVG, indicating the zone may now act as support. This box then vanishes.
When a Bullish FVG is filled (price closes above its upper boundary), the green box disappears, and an orange-bordered box with a semi-transparent orange background briefly appears to mark the Bearish IFVG, indicating the zone may now act as resistance. This box then vanishes.
The disappearance of boxes reflects the resolution of the imbalance, keeping the chart uncluttered.
Customization:Users can toggle the display of Bullish FVGs, Bearish FVGs, Bullish IFVGs, and Bearish IFVGs via input settings.
The extendBars parameter (default 50) controls how far to the right the boxes extend, allowing adjustment of their visibility duration.
Colors for Bullish FVG, Bearish FVG, Bullish IFVG, and Bearish IFVG can be customized using TradingView’s color picker, with defaults set to semi-transparent green, red, blue, and orange, respectively.
Performance:The script includes a cleanup mechanism to limit the number of active boxes to 50 per type, preventing performance issues by deleting the oldest boxes when the limit is exceeded.
It uses static variable assignments to ensure compatibility with Pine Script v6’s strict type requirements for drawing functions.
FunctionalityThe indicator scans each bar on the 5-minute chart to detect FVGs based on the defined conditions.
Upon detection, it creates a box extending from the starting bar (two bars ago) to the current bar plus the extendBars value, using the high and low prices to define the box’s vertical range.
When price action fills an FVG, the original box is deleted, and a brief IFVG box is created at the same price levels, which also disappears, signaling the imbalance has been neutralized.
No text or labels are displayed, ensuring a clean visual experience focused solely on the boxes.
Intended UseTraders: This tool is ideal for traders using FVG and IFVG concepts (common in Smart Money or ICT trading strategies) to identify potential support and resistance zones. The blue boxes (Bullish IFVGs) may indicate areas to buy or expect a bounce, while orange boxes (Bearish IFVGs) may indicate areas to sell or expect a pullback.
Chart Analysis: By observing when and where boxes appear and disappear, traders can track market structure shifts without cluttering the chart with annotations.
LimitationsThe script must be applied to a 5-minute chart manually, as the timeframe argument is not supported due to the use of drawing functions.
The brief appearance of IFVG boxes means historical levels must be tracked manually (e.g., via screenshots) or by adjusting the script to retain them if desired.
The minimum gap size filter might need tuning depending on the instrument (e.g., Gold) to capture relevant gaps.
Current Status (as of 08:53 AM EDT, October 23, 2025)The script is fully functional on your 5-minute chart, with the latest version (v5) resolving the timeframe error by removing the invalid argument. Boxes should now appear and disappear as intended, with green for Bullish FVGs, red for Bearish FVGs, blue for Bullish IFVGs, and orange for Bearish IFVGs.

FVGs, Env, BB & Knoxville: A Unified Analysis SuiteFVGs, Env, BB & Knoxville: A Unified Analysis Suite
I'm excited to share the Unified Market Analysis Suite, a powerful and comprehensive indicator designed to provide a multi-layered perspective on market dynamics.
Instead of cluttering your chart with separate tools, this script synergizes four key analytical concepts—Fair Value Gaps (FVGs), Volatility Bands (BB & Envelopes), and Momentum Divergence (Knoxville)—into one seamless package. The core philosophy is to help you identify, confirm, and act on high-probability setups by using each component to validate the others. This layered approach provides a more robust signal than any single indicator could alone.
How the Components Work Together: A Strategic Approach
This script is built for a step-by-step analysis, turning abstract data into actionable insights:
Step 1: Spot Potential Reversals with Knoxville Divergence. The process begins when a bullish or bearish Knoxville Divergence signal appears on your chart. This acts as an early warning, alerting you to a potential shift in momentum that is not yet reflected in the price trend.
Step 2: Identify Inefficiency with Fair Value Gaps (FVGs). Following a divergence signal, you then look for a Fair Value Gap to form in the direction of that divergence. For example, after a bullish divergence, a newly formed bullish FVG can serve as a high-probability zone for potential entries.
Step 3: Gauge Volatility with Bollinger Bands. The Bollinger Bands provide critical context. Is the FVG forming during a low-volatility squeeze, suggesting an explosive move might be imminent? Or is it occurring in a high-volatility environment where more caution is needed? An FVG that forms near or outside the bands can signal a particularly potent setup.
Step 4: Confirm with the Macro Trend using Envelopes. Finally, the long-term Envelope channel helps you see the bigger picture. This confirms whether your FVG/divergence setup is aligned with the dominant market trend (a continuation) or against it (a potential reversal), allowing you to manage your trade with greater confidence.
Key Features & Full Customization
Every component is highly customizable to fit your unique trading style.
1. Fair Value Gaps (FVGs) & Consequent Engulfment (CE)
Automatic Detection: Clearly identifies and plots bullish (UP) and bearish (DOWN) FVGs.
Dynamic Visuals: Boxes and CE lines extend until mitigated, with distinct colors for bullish and bearish gaps. You have the option to automatically hide filled boxes for a cleaner chart.
Mitigation Options: Choose whether FVG mitigation is calculated based on wicks or candle bodies.
Clear Labeling: A new feature adds an "FVG" text label inside each box, with adjustable size, color, and positioning.
Advanced Alerts: Receive alerts for FVG formation (confirmed and un-confirmed), price crossing an FVG's threshold (CE or full fill), and IOFED (price entry into an FVG).
2. Knoxville Divergence
Integrated Momentum Analysis: Uses a combination of RSI and Momentum to detect high-quality divergence signals.
Precision Control: Adjust RSI/Momentum lengths, the lookback period for finding divergences, and RSI overbought/oversold levels.
Intuitive Visuals & Alerts: Divergence lines are drawn directly on your chart with customizable colors, styles, and thickness. Alerts trigger the moment a new bearish or bullish divergence is confirmed.
3. Bollinger Bands (BB)
Classic Volatility Analysis: Monitor market volatility and identify potential price extremes.
Multiple MA Types: Choose from SMA, EMA, SMMA (RMA), WMA, or VWMA for the basis of the bands.
Full Customization: Adjust the length, source, and standard deviation multiplier.
4. Envelopes
Trend & Deviation Channel: Quickly assess price deviation from a central moving average.
Flexible Calculation: Can be calculated using either an SMA or EMA as the basis.
Clear Visuals: The channel is filled for easy and immediate interpretation of the broader trend.
Getting Started
This script is an overlay that plots directly on your price chart. After adding it, click the "Settings" cogwheel. You will find clearly organized sections for each of the four components, allowing you to enable, disable, and fine-tune every parameter to create the perfect analytical view for your strategy.
Acknowledgments and Development Process
This indicator is a comprehensive suite, and I want to be transparent about its development. The foundational logic for detecting three-bar Fair Value Gaps was inspired by the excellent open-source script by @twingall.
However, this module was not simply a copy; it was fundamentally re-architected and enhanced to serve as one component within this larger, original system. Here are the specific, significant improvements:
Architectural Refactoring: The original v5 code was entirely rewritten into a modular fvgManager function in Pine Script® v6, allowing it to integrate seamlessly with the other indicators.
New Feature (Dynamic Labels): I designed and implemented a system to add, manage, and customize text labels inside each FVG box—a feature not present in the original.
Original Components: The other three indicators in this suite—Envelopes, Bollinger Bands, and the Knoxville Divergence detector—are my own original code from the ground up.
Synergistic Integration: The primary development effort was focused on integrating these four distinct analytical tools. The FVG code was specifically modified to support advanced conditional visibility, ensuring it could be toggled on and off without conflicting with the other modules.
My goal was to build on a known concept and place it within a broader, synergistic framework. I truly believe the combination of these tools can enhance your analysis. If you find this script valuable, please consider giving it a boost to show your support.
I wish you all the best on your trading journey!

FVG Breakout Lite by tradingbauhausExplanation of "FVG Breakout Lite by tradingbauhaus"
This script is a trading strategy built for TradingView that helps you spot and trade "Fair Value Gaps" (FVGs)—price areas where the market moved quickly, leaving a gap that might act as support or resistance later. It’s designed to catch breakout opportunities when the price moves strongly in one direction, with extra filters to make trades more reliable. Here’s how it works and how you can use it:
What It Does
1. Finds Fair Value Gaps (FVGs):
A "Bullish FVG" happens when the price jumps up quickly, leaving a gap below where it didn’t trade much (e.g., today’s low is higher than the high from two bars ago).
A "Bearish FVG" is the opposite: the price drops fast, leaving a gap above (e.g., today’s high is lower than the low from two bars ago).
The script draws colored boxes on your chart to show these gaps: green for bullish, red for bearish.
2. Spots Breakouts:
It looks for "strong" FVGs by comparing them to a trend (based on the highest highs and lowest lows over a set period).
If a bullish gap forms above the recent highs, or a bearish gap below the recent lows, it’s marked as a breakout opportunity.
3. Adds a Volume Check:
Trades only happen if the market’s volume is higher than usual (e.g., 1.2x the average volume over the last 20 bars). This helps ensure the breakout has real momentum behind it.
4. Trades Automatically:
Long Trades (Buy): If a bullish breakout FVG forms and volume is high, it buys at the current price.
Short Trades (Sell): If a bearish breakout FVG forms with high volume, it sells short.
Each trade comes with a stop loss (to limit losses) and a take profit (to lock in gains), both adjustable by you.
5. Shows Mitigation Lines (Optional):
If you turn on "Display Mitigation Zones," it draws lines at the edge of each breakout FVG. These lines show where the price might return to "fill" the gap later, helping you see key levels.
6. Includes Webull Costs:
The script factors in real trading fees from Webull, like tiny SEC and FINRA fees for selling, and a daily margin cost if you’re borrowing money to trade. These don’t show up on the chart but affect the strategy’s performance in backtesting.
How to Use It
1. Add to Your Chart:
Copy the script into TradingView’s Pine Editor, click "Add to Chart," and it’ll start drawing FVGs and running the strategy.
2. Customize Settings:
Trend Period (Default: 25): How many bars it looks back to define the trend. Longer periods mean fewer but stronger signals.
Volume Lookback (Default: 20) & Volume Threshold (Default: 1.2): Adjust how it measures "high volume." Increase the threshold for stricter trades.
Stop Loss % (Default: 1.5%) & Take Profit % (Default: 3%): Set how much you’re willing to lose or aim to gain per trade.
Margin Rate % (Default: 8.74%): Webull’s rate for borrowing money—lower it if your account qualifies for a better rate.
Display Mitigation Zones (Default: On): Toggle this to see or hide the gap lines.
Colors: Change the green (bullish) and red (bearish) shades to suit your chart.
3. Backtest It:
Go to the "Strategy Tester" tab in TradingView to see how it performs on past data. It’ll show trades, profits, losses, and Webull fees included.
4. Watch It Work:
Green boxes mean bullish FVGs; red boxes mean bearish FVGs. If volume spikes and the price breaks out, you’ll see trades happen automatically.
What to Expect
Visuals: You’ll see colored boxes for FVGs and optional lines showing where they start. These help you spot key price zones even if you’re not trading.
Trades: It’s selective—only trades when FVGs align with a breakout and volume confirms it. Expect fewer trades but with higher potential.
Risk: The stop loss keeps losses in check, while the take profit aims for a 2:1 reward-to-risk ratio by default (3% gain vs. 1.5% loss).
Costs: Webull’s fees are small but baked into the results, so you’re seeing a realistic picture of profits.
Tips for Users
Test it on a small timeframe (like 5-minute charts) for day trading or a larger one (like daily) for swing trading.
Play with the volume threshold—if you get too few trades, lower it (e.g., 1.1); if too many, raise it (e.g., 1.5).
Watch how price reacts to the mitigation lines—they’re often support or resistance zones traders target.
This strategy is lightweight, focused, and built for traders who like breakouts with a bit of confirmation. It’s not foolproof (no strategy is!), but it gives you a clear way to trade FVGs with some smart filters.

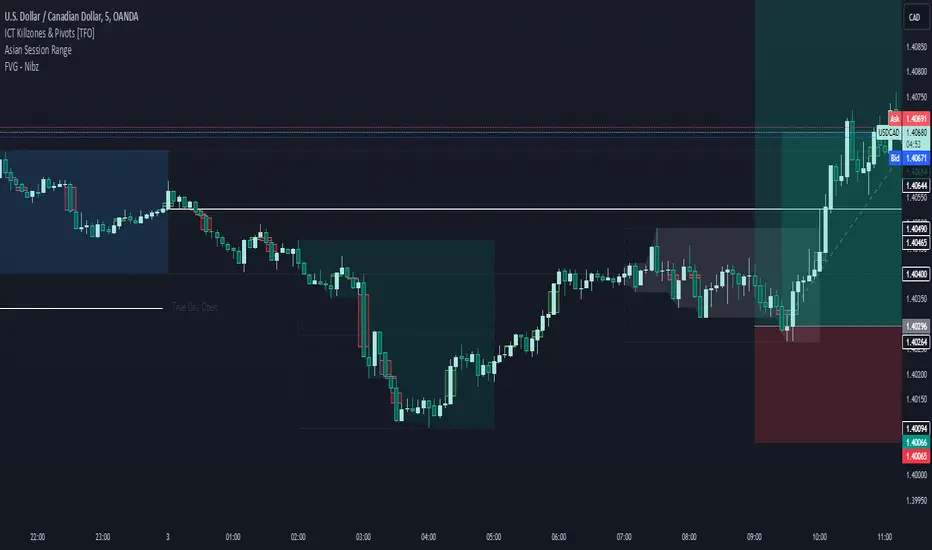
FVG - NibzDescription: Fair Value Gap (FVG) Indicator - Nibz
This Pine Script identifies and visualizes Fair Value Gaps (FVGs) on your TradingView chart. FVGs are price inefficiencies left behind when the market moves too quickly, skipping price levels that might not be tested. These gaps often act as magnets, attracting price for potential reversals or continuations.
The script works by detecting upward (bullish) and downward (bearish) price imbalances based on specific candlestick criteria and then marks these zones on your chart using customizable shaded boxes. This tool is essential for traders looking to identify key areas of market inefficiency that could signify support/resistance levels, potential reversal zones, or areas to monitor for market rebalancing.
How It Works
1. Bullish FVG Detection
The script identifies an upward imbalance when:
The low of the candlestick two bars back is less than or equal to the open of the previous bar.
The high of the current candlestick is greater than or equal to the close of the previous bar.
When this condition is met and the size of the imbalance is greater than zero, a green box is drawn from the low of the second candlestick back to the high of the current candlestick.
2. Bearish FVG Detection
The script identifies a downward imbalance when:
The high of the candlestick two bars back is greater than or equal to the open of the previous bar.
The low of the current candlestick is less than or equal to the close of the previous bar.
When this condition is met and the size of the imbalance is greater than zero, a red box is drawn from the low of the current candlestick to the high of the second candlestick back.
Customization Options
This script is highly customizable, allowing you to tailor the appearance of the FVG boxes to suit your trading style and chart aesthetics:
Bullish FVG:
Fill color and transparency.
Border color and transparency.
Bearish FVG:
Fill color and transparency.
Border color and transparency.
The settings are user-friendly, with intuitive sliders for transparency and color pickers for customization.
How to Use the Indicator
Adding the Script:
Add the indicator to your chart, and it will automatically mark bullish (green) and bearish (red) FVGs.
Interpreting FVGs:
Bullish FVGs (green zones): These often act as support or areas of potential price rebalancing on retracement.
Bearish FVGs (red zones): These often act as resistance or areas of interest for short entries.
Trade Ideas:
Use FVG zones to confirm other trade signals or strategies.
Watch for price interaction with these zones to time entries and exits.
Key Features
Automated detection of Fair Value Gaps.
Customizable visual representation to match your chart preferences.
Enhances trading precision by identifying price inefficiencies.
Suitable for scalping, day trading, or swing trading strategies.
This script provides a powerful tool to highlight important price levels and inefficiencies in the market, enabling traders to make informed decisions. Whether you're using it as a standalone indicator or combining it with other tools, the 'FVG - Nibz' indicator is a valuable addition to any trader's toolkit!
FVG Breakout/BreakdownThe FVG Breakout/Breakdown indicator is designed to identify potential breakout and breakdown opportunities in the market, based on the concept of Fair Value Gaps (FVGs). FVGs are areas where price moves too quickly, leaving behind gaps between candlesticks, often seen as areas of inefficiency or imbalance that the market tends to revisit.
Key Concepts:
Fair Value Gaps (FVG):
FVG occurs when a price gap is created between candlesticks, typically when the high of one candle is lower than the low of the previous candle (for a bearish FVG) or the low of one candle is higher than the high of the previous candle (for a bullish FVG).
These gaps represent an imbalance between buying and selling pressure, and the market often revisits them, making them valuable for identifying potential entry points.
Bullish FVG: This occurs when the low of the current candle is higher than the high of the previous candle.
Condition: low > high
Bearish FVG: This occurs when the high of the current candle is lower than the low of the previous candle.
Condition: high < low
Breakout/Breakdown Signals:
Breakout: A bullish breakout signal occurs when the price breaks above a defined resistance level after an FVG gap. This suggests that the market may continue moving higher.
Breakdown: A bearish breakdown signal occurs when the price breaks below a defined support level after an FVG gap. This suggests that the market may continue moving lower.
NWOG (New Week Opening Gap):
The NWOG can be used as an additional factor to confirm the FVG signal. The gap between Friday's close and Monday's open is a crucial level for identifying the start of a new move for the week.
NWOG helps to further refine the timing of breakout or breakdown signals, only triggering them when price moves relative to the Monday Open and shows a new direction.
FVG Positioning Average with 200EMA Auto Trading [Pakun]Description
Strategy Name and Purpose
FVG Positioning Average with 200EMA Auto Trading
This strategy uses Fair Value Gaps (FVG) combined with a 200-period Exponential Moving Average (EMA) and Average True Range (ATR) to generate trend-based trading signals. It is designed to help traders identify high-probability entry points by leveraging the gaps between fair value prices and current market prices.
Originality and Usefulness
This script combines multiple indicators to create a cohesive trading strategy that is greater than the sum of its parts. While FVG is a powerful tool on its own, combining it with the EMA and ATR adds layers of confirmation and risk management, enhancing its effectiveness. Here’s how the components work together:
Fair Value Gap (FVG): Identifies gaps in the market where price action has not fully filled, indicating potential reversal or continuation points.
200-period Exponential Moving Average (EMA): Acts as a trend filter to ensure trades are taken in the direction of the overall trend, improving the probability of success.
Average True Range (ATR): Used to filter out insignificant gaps and set dynamic stop-loss levels based on market volatility, enhancing risk management.
Entry Conditions
Long Entry
The close price crosses above the downtrend FVG.
The close price, FVG up average, and down average are all above the 200 EMA, indicating a strong bullish trend.
Short Entry
The close price crosses below the uptrend FVG.
The close price, FVG up average, and down average are all below the 200 EMA, indicating a strong bearish trend.
Exit Conditions
For long positions, the stop loss is set at the recent low, and the take profit is set at a point with a risk-reward ratio of 1:1.5.
For short positions, the stop loss is set at the recent high, and the take profit is set at a point with a risk-reward ratio of 1:1.5.
Risk Management
Account Size: 1,000,000 yen
Commission and Slippage: 2 pips commission and 1 pip slippage per trade
Risk per Trade: 10% of account equity
The stop loss is based on the recent low or recent high, ensuring trades are exited when the market moves against the position.
Settings Options
FVG Lookback: Set the lookback period for calculating FVGs.
Lookback Type: Choose the type of lookback (Bar Count or FVG Count).
ATR Multiplier: Set the multiplier for ATR to filter significant gaps.
EMA Period: Set the period for the EMA to adjust the trend filter sensitivity.
Show FVGs on Chart: Choose whether to display FVGs on the chart for visual confirmation.
Bullish/Bearish Color: Set the color for bullish and bearish FVGs to distinguish them easily.
Show Gradient Areas: Choose whether to display gradient areas to highlight the zones of interest.
Sufficient Sample Size
The strategy has been backtested with 113 trades, providing a sufficient sample size to evaluate its performance.
Notes
This strategy is based on historical data and does not guarantee future results.
Thoroughly backtest and validate results before using in live trading.
Market volatility and other external factors can affect performance and may not yield expected results.
Acknowledgment
This strategy uses the FVG Positioning Average Strategy indicator. Thanks to for their contribution.
Clean Chart Explanation
The script is published with a clean chart to ensure that its output is readily identifiable and easy to understand. No other scripts are included on the chart, and any drawings or images used are specifically to illustrate how the script works.

FVG & IFVG MTF Detector [Alphaomega18]TITLE:
FVG & IFVG Multi-Timeframe Detector
SHORT DESCRIPTION:
Automatic Fair Value Gap (FVG) and Inverse Fair Value Gap (IFVG) detector with multi-timeframe analysis and automatic gap fill closure.
FULL DESCRIPTION:
📊 OVERVIEW
This indicator automatically detects Fair Value Gaps (FVG) and Inverse Fair Value Gaps (IFVG) on your current timeframe and up to 12 additional timeframes simultaneously. Perfect for confluence analysis and identifying institutional zones.
🎯 KEY FEATURES
✅ Multi-Timeframe Detection:
• 12 available timeframes: 1min, 2min, 5min, 10min, 15min, 30min, 1H, 2H, 4H, Daily, Weekly, Monthly
• Each timeframe with customizable color
• Timeframe labels positioned on the right of boxes
✅ Automatic Closure:
• FVGs automatically close when price fills the gap
• Option to disable for traditional fixed extension
• Smart midline management
✅ Complete Customization:
• Customizable colors for each timeframe
• Configurable label size, position, and style
• Gap size display options (separate for current TF and MTF)
• Transparent or colored labels for MTF
• Customizable borders and midlines
✅ Filters & Controls:
• Filter by minimum gap size
• Maximum boxes per timeframe
• Configurable box extension (5-100 bars)
• Border styles: Solid, Dashed, Dotted
✅ Integrated Dashboard:
• Active FVG/IFVG counter
• Statistics per timeframe
• Customizable position
📈 USAGE
1. **Timeframe Activation**:
- Go to Settings > Multi-Timeframe
- Check the timeframes you want to analyze
- Customize colors for each timeframe
2. **Display Configuration**:
- Settings > Display: control labels and their content
- "Transparent MTF Labels": displays only timeframe text without colored background
- "Show Gap Size": separate options for current TF and MTF
3. **Automatic Closure**:
- Settings > Filters > "Close FVG when Filled": enable to automatically close filled gaps
- Disable for traditional fixed extension
4. **Filtering**:
- "Min Gap Size": filter out insignificant small gaps
- "Max Boxes": control the number of FVGs displayed per timeframe
🔍 INTERPRETATION
• **Bullish FVG (🟢)**: Bullish gap - potential support zone
• **Bearish IFVG (🔴)**: Bearish gap - potential resistance zone
• **MTF Confluences**: Multiple FVGs from different timeframes at the same level = strong institutional zone
⚙️ TECHNICAL PARAMETERS
• Detection: low > high (bullish) | high < low (bearish)
• Max boxes per timeframe: 500
• Max lines: 500
• Automatic memory management (old FVG deletion)
🎨 ADVANCED CUSTOMIZATION
• Separate background and border colors
• 4 label sizes: Tiny, Small, Normal, Large
• 3 label positions for current TF: Left, Center, Right
• MTF labels always positioned right for clarity
• Optional midlines with customizable style and color
💡 USAGE TIPS
1. Start with 2-3 timeframes maximum to avoid visual overload
2. Use contrasting colors to easily differentiate timeframes
3. Daily/Weekly gaps are perfect for identifying major institutional zones
4. Combine with your price action strategy for precise entries
5. Automatic closure helps identify when a zone is invalidated
📊 IDEAL FOR
• ICT Traders (Inner Circle Trader)
• Scalping & Day Trading
• Swing Trading
• Institutional zone analysis
• Multi-timeframe confluence trading
🔔 ALERTS
Configurable alerts for:
• New Bullish FVG detected
• New Bearish IFVG detected
---
© 2024 Alphaomega18 - All rights reserved
License: Mozilla Public License 2.0

TXM-FVG-ALARM_4TFFVG Multi-Timeframe Indicator for TradingView
With this indicator, you get all the key Fair Value Gaps (FVGs) displayed at a glance for your current timeframe plus up to three additional timeframes of your choice.
Main Features
Current Timeframe Display
Always shows which chart timeframe you’re on, so you never lose track of your analysis level.
Multi-Timeframe FVG Detection
Current TF: Automatically identifies and marks all Fair Value Gaps on the active chart.
Up to 3 Extra TFs: Select up to three more periods (e.g. 1h, 4h, Daily) to view their FVGs simultaneously.
Flexible Visualization Options
Filled Box: Highlights FVG zones with solid rectangles.
Outline Only: Draws just the borders of each FVG for a cleaner look.
Combined Mode: Use both fill and outline to distinguish between different TFs or gap types.
Customizable Colors
Assign individual colors for each timeframe and for each visualization style (box and/or outline).
Save and load color presets to switch quickly between markets or strategies.
Alert Functionality
Set up alerts that trigger as soon as a new FVG appears in the current or any selected extra timeframe.
Choose between pop-ups, email alerts, or mobile push notifications.
Benefits at a Glance
Time Savings – Automatic detection and drawing of FVGs.
Clarity – See at once which timeframes have active gaps.
Personalization – Tailor colors and display modes to your workflow.
Responsiveness – Never miss a newly formed FVG thanks to real-time alerts.
Installation & Usage
Add the Indicator
In TradingView’s Public Library, search for “FVG Multi-TF Box & Frame.”
Configure Timeframes
In the indicator’s settings, pick your main TF plus up to three additional TFs.
Adjust Display
Toggle box fill, outline, or both, and set your colors for each TF.
Create Alerts
Go to the Alerts tab, select the indicator’s “New FVG Detected” condition, and choose your notification method.
Use the FVG Multi-Timeframe Indicator to enhance your chart analysis across all trading horizons—from quick scalping to longer-term swing strategies!

FVG (Nephew sam remake)Hello i am making my own FVG script inspired by Nephew Sam as his fvg code is not open source. My goal is to replicate his Script and then add in alerts and more functions. Thus, i spent few days trying to code. There is bugs such as lower time frame not showing higher time frame FVG.
This script automatically detects and visualizes Fair Value Gaps (FVGs) — imbalances between demand and supply — across multiple timeframes (15-minute, 1-hour, and 4-hour).
15m chart shows:
15m FVGs (green/red boxes)
1H FVGs (lime/maroon)
4H FVGs (faded green/red with borders) (Bugged For now i only see 1H appearing)
1H chart shows:
1H FVGs
4H FVGs
4H chart shows:
4H FVGs only
There is the function to auto close FVG when a future candle fully disrespected it.
You're welcome to:
🔧 Customize the appearance: adjust box colors, transparency, border style
🧪 Add alerts: e.g., when price enters or fills a gap
📅 Expand to Daily/Weekly: just copy the logic and plug in "D" or "W" as new layers
📈 Build confluence logic: combine this with order blocks, liquidity zones, or ICT concepts
🧠 Experiment with entry signals: e.g., candle confirmation on return to FVG
🚀 Improve performance: if you find a lighter way to track gaps, feel free to optimize!

FVG valid MTF (Fair Value Gaps across Multiple Timeframes)This indicator automatically detects and displays Fair Value Gaps (FVGs) across multiple timeframes (1D, 4H, 1H, 30M, 15M, 5M).
✨ Features:
Detects valid FVGs only when they appear after three consecutive candles in the same direction (bullish or bearish).
Each gap is color-coded by direction (bullish / bearish) and changes color once mitigated.
Automatic timeframe label inside each FVG box.
Fully customizable:
Minimum & maximum FVG size (in ticks),
Extension length of boxes into the future (bars),
Maximum number of FVGs displayed per timeframe.
After mitigation, FVGs are visually updated, making it easy to see whether the market has respected the imbalance zone.
📊 Practical Use:
Identify areas of imbalance where strong price reactions often occur.
Monitor FVGs across multiple timeframes – from daily charts down to intraday.
Useful for defining support/resistance zones, entry levels, or trade exits.
⚙️ Settings:
Adjustable FVG colors for bullish, bearish, and mitigated states.
Independent limit on how many FVGs are displayed for each timeframe.
Optimized for clarity and chart performance.
FVG + Bank Level Targeting w/ Alert TriggerDescription:
FVG + Bank Level Targeting w/ Alert Trigger is an intraday trading tool that combines Fair Value Gap (FVG) detection with dynamic institutional targeting using prior-day, weekly, and monthly high/low "Bank Levels." When a Fair Value Gap is detected, the script projects a logical target using the closest bank level in price's direction, and visually extends that level on your chart.
This tool is designed to help traders anticipate where price is most likely to move after an FVG appears — and alert them when price breaks through key target zones.
How It Works:
* Bank Level Calculation:
The indicator calculates Daily, Weekly, and Monthly high and low levels from the previous bar of each respective timeframe.
These are optionally plotted on the chart with a slight tick offset to avoid overlap with price.
* FVG Detection:
Bullish FVGs are defined by a gap between the low of the current candle and the high two candles prior, with a confirming middle candle.
Bearish FVGs follow the reverse pattern.
Once detected, the script finds the nearest unbroken institutional level (Bank Level) in the direction of the FVG and anchors a target line at that price level.
* Target Line Projection:
The script draws a persistent horizontal line (not just a plotted value) at the selected bank level.
These lines automatically extend a set number of bars into the future for clarity and trade planning.
* Breakout Detection:
When price crosses above a Bull Target or below a Bear Target, the script triggers a breakout condition.
These breakouts are useful for trade continuation or reversal setups.
* Alerts:
Built-in alert conditions notify you in real time when price crosses above or below a target.
These can be used to set TradingView alerts for your preferred Futures symbols or intraday pairs.
Parameters:
Tick Offset Multiplier: Adds distance between price and plotted levels.
Show Daily/Weekly/Monthly Levels: Toggle for each institutional level group.
FVG Extend Right (bars): Controls how far the target lines extend into the future.
Color Controls: Customize colors for FVG fill and target lines.
Use Case:
This indicator is designed for traders who want to:
Trade continuation or reversal moves around institutional price zones
Integrate Fair Value Gap concepts with more logical, historically anchored price targets
Trigger alerts when market structure evolves around key levels
It is especially useful for intraday Futures traders on the 15-minute chart or lower, but adapts well to any instrument with strong reactionary behavior at prior session highs/lows.

FVG - Fair Value Gap Detector with Large Movement FilterScript Description: Fair Value Gap (FVG) Detector with Large Movement Filter
This indicator is designed to identify Fair Value Gaps (FVG), which are price imbalances observed between three consecutive candles. Fair Value Gap detection is commonly used by traders to locate areas of imbalance where demand and supply temporarily lose equilibrium. This imbalance often draws price back to these zones, making them potential points of interest for buy or sell opportunities.
Key Features of the Indicator
FVG Detection Based on Three Consecutive Candles:
The script identifies a Fair Value Gap between three consecutive candles. This gap appears when the high of the first candle is below the low of the third candle (or vice versa). These gap zones are significant as they indicate an imbalance in price between buyers and sellers, with the expectation that price may revisit these areas in the future.
Large Movement Filter Using ATR:
To improve accuracy and avoid false signals in minor price fluctuations, this indicator includes a large movement filter based on the Average True Range (ATR). The ATR is calculated over a configurable period, and a multiplier is applied to set the minimum required range for a large movement. This helps ensure that only gaps in areas with significant price movement are identified.
Visual Differentiation with Customizable Colors:
The script allows users to configure FVG box colors for easy gap visualization. Identified zones on the chart are highlighted with a colored box, making it easy for the trader to identify imbalance points and observe potential mitigation.
FVG Mitigation and Capture:
The indicator continuously checks if the price is within the FVG zone, indicating that the gap has been mitigated or “captured” by the price. The mitigation or capture status is displayed visually on the chart, using a color scheme to indicate whether the gap has been retested by price after its creation.
How to Use the Indicator
Configuring Parameters:
ATR Multiplier: Defines how large a movement relative to ATR is required for the gap to be considered significant. Higher values require larger movements.
ATR Period: Sets the number of candles used in the ATR calculation, affecting the sensitivity to large movements.
Customizable Colors: Traders can adjust the FVG box colors and labels indicating mitigation and capture of the imbalance zones.
Visual Interpretation:
FVG Boxes: Colored boxes will appear on the chart to highlight gap zones. These boxes only display following the detection of a large movement, as defined by ATR.
Mitigation and Capture Labels: The indicator places a label below the bar when a gap is identified, highlighting zones where gaps may be mitigated or captured. The color scheme helps traders quickly interpret the status of a gap.
Underlying Concepts and Practical Application
The Fair Value Gap is widely used in liquidity analysis and price reversal zones. By identifying FVG zones based on large price movements, this script enables traders to monitor potential gap-fill areas. With the large movement filter, the indicator is ideal for strategies that prioritize liquidity and price zone mitigation, making it useful for both short-term (scalping) and long-term strategies.
This indicator provides a solid foundation for traders interested in observing price imbalances and future mitigations.

FVG Visual Super Clean (ticks)This is a robust and highly visual indicator designed for traders utilizing Smart Money Concepts (SMC) or Inner Circle Trader (ICT) methodologies.
Its core function is to automatically identify, visualize, and manage Fair Value Gaps (FVGs) or price inefficiencies, offering deep insight into institutional order flow.
Key Features & Capabilities
Advanced FVG Detection: Accurately identifies bullish and bearish Fair Value Gaps (FVGs) based on the 3-bar pattern.
Wick vs. Body Logic: Configurable option to use candle wicks (high/low) or bodies (open/close) for FVG calculation.
Displacement Confirmation: Includes an optional filter to require price displacement (a strong close) for higher conviction setups.
Mitigation Tracking & Management: The script actively tracks how much the price has filled or "mitigated" the FVG.
Threshold Auto-Removal: FVGs that reach a user-defined mitigation percentage (mitigation_pct) are automatically removed to keep the chart clean.
Mitigated Visibility: An optional setting allows mitigated FVGs to remain visible, repainting them with a distinct "Mitigated" color (blue by default) to show the exact point of rebalance.
Visual Efficiency:
Automatic Extension: Active, unmitigated FVGs are automatically extended forward in time until they are filled or pruned.
Equilibrium Line: Draws a dotted line at the 50% level (Equilibrium) of each FVG, a key reference point in SMC/ICT trading.
Tick-Based Filtering: Allows filtering gaps by a minimum size in ticks, reducing noise from insignificant micro-gaps.
Trend Context: Integrates a configurable Moving Average (EMA or SMA) for contextual trend analysis. The MA line changes color dynamically (green/red) to quickly signal momentum.
Optimized Performance: Implements a lookback window (lookback_days) and a cleanup routine to manage the number of drawing objects, ensuring smooth performance even on low timeframes.
Ideal For:
Traders focused on SMC/ICT Order Blocks, Imbalances, and Price Delivery.
Backtesting price action strategies around institutional liquidity.
Identifying high-probability entries (e.g., at the 50% line) and targets (e.g., unmitigated gaps).

ICT MTF FVG [MK]FVGs (Fair Value Gaps) are significant levels that may act as support or resistance to price. The script finds FVGs as per ICT trading system, then plots the full FVG to the right side of the chart. FVG boxes do not change size when they are semi-mitigated as its important to know where the original FVG midpoint lies. Plotting to the right side of price allows for a cleaner chart. The script is MTF and can display FVG boxes for the following timeframes. Chart, 5,10,15,30,1hr,4hr,8hr,12hr,D,W,M.
Below shows 1hr FVGs marked out. NOTE: this is not what the script does, this is for explanation only.
Below shows what the script will do. 1hr FVGs shown on 15min chart

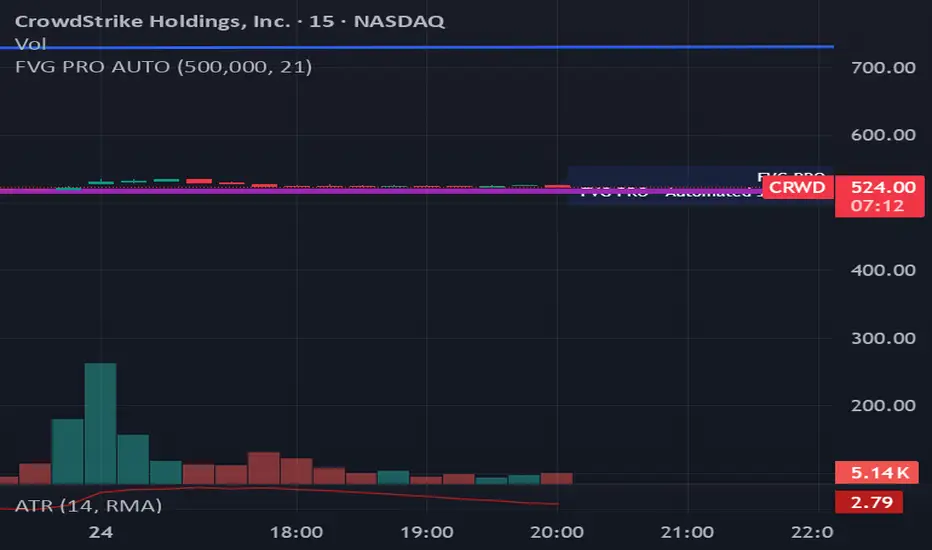
FVG PRO AUTO**הסבר ותקציר לפרסום – אינדיקטור Fair Value Gap PRO (FVG PRO) למסחר חכם אוטומטי**
**עברית:**
אינדיקטור FVG PRO למסחר אוטומטי חכם לפי שיטת Fair Value Gap (SMC). האינדיקטור מזהה רמות מפתח לפי 15 דקות אוטומטית, מאתר תבניות FVG ו־Engulfing רק כשמתקיימים כל התנאים הקריטיים (שעות מסחר, מגמת EMA, ונפח מספק), ומציג סיגנלי כניסה, מטרות וסטופ בצורה ויזואלית ברורה עם התראות אוטומטיות. הכלי בנוי ב־Pine Script v6 המתקדם, מיועד לסוחרים שרוצים למקסם אמינות, להפחית איתותי שווא, ולהפוך מסחר על הגרף לאוטונומי ומדויק. אין צורך בהתערבות ידנית – כל ניתוח הסיגנלים, הסינון וההתראות מבוצעים אוטומטית ובאמינות. פתרון איכותי וחזק לסוחרי FVG ו־Smart Money.
**English:**
FVG PRO is an advanced automated trading indicator based on the Fair Value Gap (SMC) method. It automatically detects 15-minute key price levels and identifies FVG & Engulfing patterns—only when all strict trading conditions (session hours, EMA trend, and sufficient volume) are met. The indicator visually displays entry points, targets, and stop loss, with instant alerts. Built with Pine Script v6, it’s designed for traders seeking maximum signal reliability and minimum false alerts—making your TradingView chart clear, smart, and fully autonomous. No manual input needed: all signal detection, filtering, and alerts are automatic and robust. The ideal solution for professional FVG and Smart Money traders.