Son Model ICT [TradingFinder] HTF DOL H1 + Sweep M15 + FVG M1🔵 Introduction
The ICT Son Model setup is a precise trading strategy based on market structure and liquidity, implemented across multiple timeframes. This setup first identifies a liquidity level in the 1-hour (1H) timeframe and then confirms a Market Structure Shift (MSS) in the 5-minute (5M) timeframe to validate the trend. After confirmation, the price forms a new swing in the 5-minute timeframe, absorbing liquidity.
Once this level is broken, traders typically drop to the 30-second (30s) timeframe and enter trades based on a Fair Value Gap (FVG). However, since access to the 30-second timeframe is not available to most traders, we take the entry signal directly from the 5-minute timeframe, using the same liquidity zones and confirmed breakouts to execute trades. This approach simplifies execution and makes the strategy accessible to all traders.
This model operates in two setups :
Bullish ICT Son Model and Bearish ICT Son Model. In the bullish setup, liquidity is first accumulated at the lows of the 1-hour timeframe, and after confirming a market structure shift, a long position is initiated. Conversely, in the bearish setup, liquidity is first drawn from higher levels, and upon confirmation of a bearish trend, a short position is executed.
Bullish Setup :
Bearish Setup :
🔵 How to Use
The ICT Son Model setup is designed around liquidity analysis and market structure shifts and can be applied in both bullish and bearish market conditions. The strategy first identifies a liquidity level in the 1-hour (1H) timeframe and then confirms a Market Structure Shift (MSS) in the 5-minute (5M) timeframe.
After this shift, the price forms a new swing, absorbing liquidity. When this level is broken in the 5-minute timeframe, the trader enters based on a Fair Value Gap (FVG). While the ideal entry is in the 30-second (30s) timeframe, due to accessibility constraints, we take entry signals directly from the 5-minute timeframe.
🟣 Bullish Setup
In the Bullish ICT Son Model, the 1-hour timeframe first identifies liquidity at the market lows, where price sweeps this level to absorb liquidity. Then, in the 5-minute timeframe, an MSS confirms the bullish shift.
After confirmation, the price forms a new swing, absorbing liquidity at a higher level. The price then retraces into a Fair Value Gap (FVG) created in the 5-minute timeframe, where the trader enters a long position, placing the stop-loss below the FVG.
🟣 Bearish Setup
In the Bearish ICT Son Model, liquidity at higher market levels is identified in the 1-hour timeframe, where price sweeps these levels to absorb liquidity. Then, in the 5-minute timeframe, an MSS confirms the bearish trend.
After confirmation, the price forms a new swing, absorbing liquidity at a lower level. The price then retraces into a Fair Value Gap (FVG) created in the 5-minute timeframe, where the trader enters a short position, placing the stop-loss above the FVG.
🔵 Settings
Swing period : You can set the swing detection period.
Max Swing Back Method : It is in two modes "All" and "Custom". If it is in "All" mode, it will check all swings, and if it is in "Custom" mode, it will check the swings to the extent you determine.
Max Swing Back : You can set the number of swings that will go back for checking.
FVG Length : Default is 120 Bar.
MSS Length : Default is 80 Bar.
FVG Filter : This refines the number of identified FVG areas based on a specified algorithm to focus on higher quality signals and reduce noise.
Types of FVG filters :
Very Aggressive Filter: Adds a condition where, for an upward FVG, the last candle's highest price must exceed the middle candle's highest price, and for a downward FVG, the last candle's lowest price must be lower than the middle candle's lowest price. This minimally filters out FVGs.
Aggressive Filter: Builds on the Very Aggressive mode by ensuring the middle candle is not too small, filtering out more FVGs.
Defensive Filter: Adds criteria regarding the size and structure of the middle candle, requiring it to have a substantial body and specific polarity conditions, filtering out a significant number of FVGs.
Very Defensive Filter: Further refines filtering by ensuring the first and third candles are not small-bodied doji candles, retaining only the highest quality signals.
🔵 Conclusion
The ICT Son Model setup is a structured and precise method for trade execution based on liquidity analysis and market structure shifts. This strategy first identifies a liquidity level in the 1-hour timeframe and then confirms a trend shift using the 5-minute timeframe.
Trade entries are executed based on Fair Value Gaps (FVGs), which highlight optimal entry points. By applying this model, traders can leverage existing market liquidity to enter high-probability trades. The bullish setup activates when liquidity is swept from market lows and a market structure shift confirms an upward trend, whereas the bearish setup is used when liquidity is drawn from market highs, confirming a downtrend.
This approach enables traders to identify high-probability trade setups with greater precision compared to many other strategies. Additionally, since access to the 30-second timeframe is limited, the strategy remains fully functional in the 5-minute timeframe, making it more practical and accessible for a wider range of traders.
Cari dalam skrip untuk "fvg"

CandelaCharts - Fair Value Gap (FVG) 📝 Overview
A Fair Value Gap is a three-candle pattern where an unfilled area exists between the high of the first candle and the low of the third candle. This Fair Value Gap represents a price imbalance and often serves as a level of support or resistance on the price chart.
A Bullish FVG occurs when the high of the first candle is below the low of the third candle, creating a gap in price between them.
A Bearish FVG happens when the low of the first candle is above the high of the third candle, also resulting in a price gap.
The indicator is designed to allow traders to precisely and accurately identify Fair Value Gaps (FVGs) across any chosen time frame. Automatically detecting these price imbalances, highlights potential areas where prices may retrace, providing valuable insights into market support and resistance levels. This capability enables traders to make informed decisions based on the presence of FVGs, enhancing their strategies for entry and exit points across different market conditions and time frames.
📦 Features
MTF
Mitigation
Consequent Encroachment
Threshold
Hide Overlap
Advanced Styling
⚙️ Settings
Show: Controls whether FVGs are displayed on the chart.
Show Last: Sets the number of FVGs you want to display.
Length: Determines the length of each FVG.
Mitigation: Highlights when an FVG has been touched, using a different color without marking it as invalid.
Timeframe: Specifies the timeframe used to detect FVGs.
Threshold: Sets the minimum gap size required for FVG detection on the chart.
Show Mid-Line: Configures the midpoint line's width and style within the FVG. (Consequent Encroachment - CE)
Show Border: Defines the border width and line style of the FVG.
Hide Overlap: Removes overlapping FVGs from view.
Extend: Extends the FVG length to the current candle.
Elongate: Fully extends the FVG length to the right side of the chart.
⚡️ Showcase
Simple
Mitigated
Bordered
Consequent Encroachment
Extended
🚨 Alerts
This script provides alert options for all signals.
Bearish Signal
A bearish signal is triggered when the price moves back into a bearish inversion zone and then reverses downward.
Bullish Signal
A bullish signal is triggered when the price returns to a bullish inversion zone and then breaks upward out of the top.
⚠️ Disclaimer
Trading involves significant risk, and many participants may incur losses. The content on this site is not intended as financial advice and should not be interpreted as such. Decisions to buy, sell, hold, or trade securities, commodities, or other financial instruments carry inherent risks and are best made with guidance from qualified financial professionals. Past performance is not indicative of future results.

Silver Bullet ICT Strategy [TradingFinder] 10-11 AM NY Time +FVG🔵 Introduction
The ICT Silver Bullet trading strategy is a precise, time-based algorithmic approach that relies on Fair Value Gaps and Liquidity to identify high-probability trade setups. The strategy primarily focuses on the New York AM Session from 10:00 AM to 11:00 AM, leveraging heightened market activity within this critical window to capture short-term trading opportunities.
As an intraday strategy, it is most effective on lower timeframes, with ICT recommending a 15-minute chart or lower. While experienced traders often utilize 1-minute to 5-minute charts, beginners may find the 1-minute timeframe more manageable for applying this strategy.
This approach specifically targets quick trades, designed to take advantage of market movements within tight one-hour windows. By narrowing its focus, the Silver Bullet offers a streamlined and efficient method for traders to capitalize on liquidity shifts and price imbalances with precision.
In the fast-paced world of forex trading, the ability to identify market manipulation and false price movements is crucial for traders aiming to stay ahead of the curve. The Silver Bullet Indicator simplifies this process by integrating ICT principles such as liquidity traps, Order Blocks, and Fair Value Gaps (FVG).
These concepts form the foundation of a tool designed to mimic the strategies of institutional players, empowering traders to align their trades with the "smart money." By transforming complex market dynamics into actionable insights, the Silver Bullet Indicator provides a powerful framework for short-term trading success
Silver Bullet Bullish Setup :
Silver Bullet Bearish Setup :
🔵 How to Use
The Silver Bullet Indicator is a specialized tool that operates within the critical time windows of 9:00-10:00 and 10:00-11:00 in the forex market. Its design incorporates key principles from ICT (Inner Circle Trader) methodology, focusing on concepts such as liquidity traps, CISD Levels, Order Blocks, and Fair Value Gaps (FVG) to provide precise and actionable trade setups.
🟣 Bullish Setup
In a bullish setup, the indicator starts by marking the high and low of the session, serving as critical reference points for liquidity. A typical sequence involves a liquidity grab below the low, where the price manipulates retail traders into selling positions by breaching a key support level.
This movement is often orchestrated by smart money to accumulate buy orders. Following this liquidity grab, a market structure shift (MSS) occurs, signaled by the price breaking the CISD Level—a confirmation of bullish intent. The indicator then highlights an Order Block near the CISD Level, representing the zone where institutional buying is concentrated.
Additionally, it identifies a Fair Value Gap, which acts as a high-probability area for price retracement and trade entry. Traders can confidently take long positions when the price revisits these zones, targeting the next significant liquidity pool or resistance level.
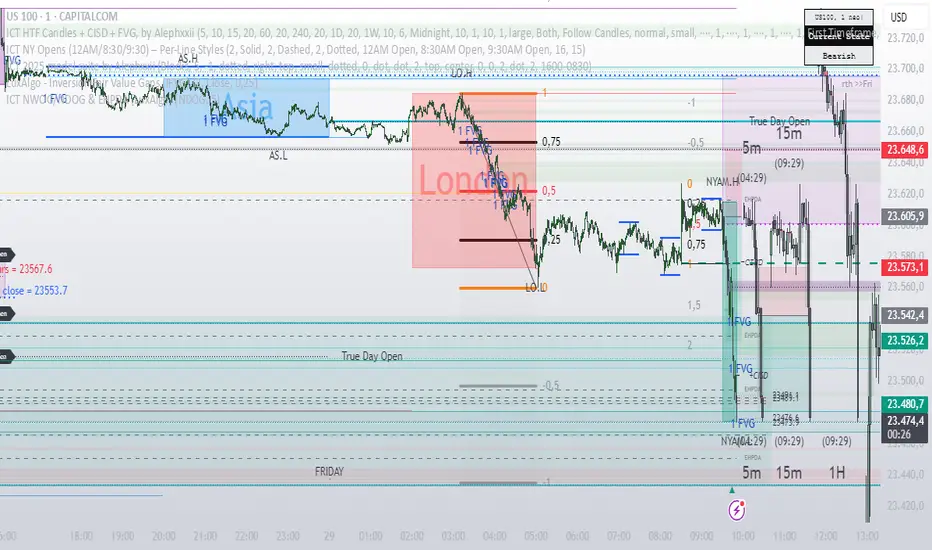
Bullish Setup in CAPITALCOM:US100 :
🟣 Bearish Setup
Conversely, in a bearish setup, the price manipulates liquidity by creating a false breakout above the high of the session. This move entices retail traders into long positions, allowing institutional players to enter sell orders.
Once the price reverses direction and breaches the CISD Level to the downside, a change of character (CHOCH) becomes evident, confirming a bearish market structure. The indicator highlights an Order Block near this level, indicating the origin of the institutional sell orders, along with an associated FVG, which represents an imbalance zone likely to be revisited before the price continues downward.
By entering short positions when the price retraces to these levels, traders align their strategies with the anticipated continuation of bearish momentum, targeting nearby liquidity voids or support zones.
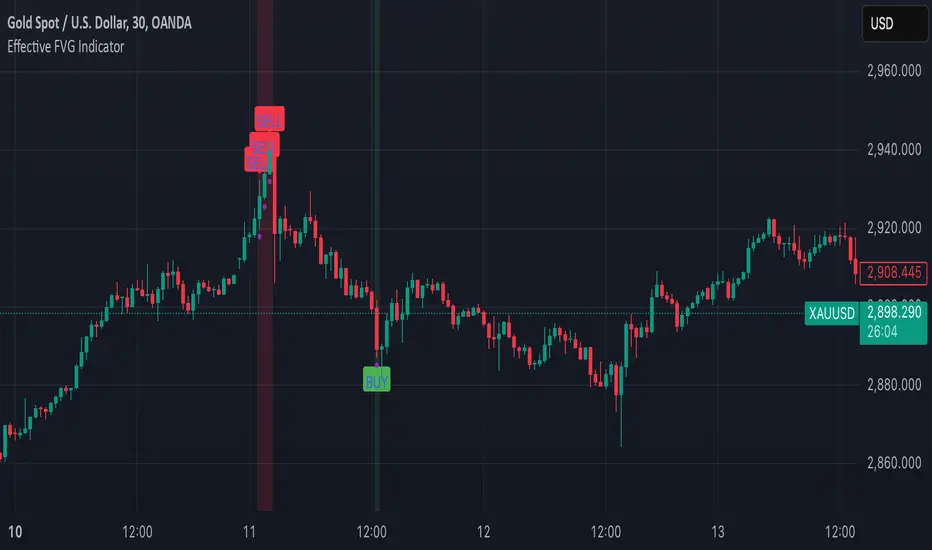
Bearish Setup in OANDA:XAUUSD :
🔵 Settings
Refine Order Block : Enables finer adjustments to Order Block levels for more accurate price responses.
Mitigation Level OB : Allows users to set specific reaction points within an Order Block, including: Proximal: Closest level to the current price. 50% OB: Midpoint of the Order Block. Distal: Farthest level from the current price.
FVG Filter : The Judas Swing indicator includes a filter for Fair Value Gap (FVG), allowing different filtering based on FVG width: FVG Filter Type: Can be set to "Very Aggressive," "Aggressive," "Defensive," or "Very Defensive." Higher defensiveness narrows the FVG width, focusing on narrower gaps.
Mitigation Level FVG : Like the Order Block, you can set price reaction levels for FVG with options such as Proximal, 50% OB, and Distal.
CISD : The Bar Back Check option enables traders to specify the number of past candles checked for identifying the CISD Level, enhancing CISD Level accuracy on the chart.
🔵 Conclusion
The Silver Bullet Indicator is a cutting-edge tool designed specifically for forex traders who aim to leverage market dynamics during critical liquidity windows. By focusing on the highly active 9:00-10:00 and 10:00-11:00 timeframes, the indicator simplifies complex market concepts such as liquidity traps, Order Blocks, Fair Value Gaps (FVG), and CISD Levels, transforming them into actionable insights.
What sets the Silver Bullet Indicator apart is its precision in detecting false breakouts and market structure shifts (MSS), enabling traders to align their strategies with institutional activity. The visual clarity of its signals, including color-coded zones and directional arrows, ensures that both novice and experienced traders can easily interpret and apply its findings in real-time.
By integrating ICT principles, the indicator empowers traders to identify high-probability entry and exit points, minimize risk, and optimize trade execution. Whether you are capturing short-term price movements or navigating complex market conditions, the Silver Bullet Indicator offers a robust framework to enhance your trading performance.
Ultimately, this tool is more than just an indicator; it is a strategic ally for traders who seek to decode the movements of smart money and capitalize on institutional strategies. With the Silver Bullet Indicator, traders can approach the market with greater confidence, precision, and profitability.

KIMATIX FVG/IFVG/BPRProfessional Fair Value Gap & Imbalance Toolkit
The KIMATIX FVG/IFVG/BPR indicator is a precision tool designed to identify institutional inefficiencies in price:
Fair Value Gaps (FVG), Inverse Fair Value Gaps (IFVG) and Balanced Price Ranges (BPR) — clean, minimal and non-repainting.
This indicator is built for scalpers, intraday traders and smart-money traders who want to trade where price is most likely to react, not where indicators lag.
What this indicator shows
Fair Value Gaps (FVG)
Detects bullish and bearish FVGs using strict 3-candle imbalance logic
Highlights areas where price moved too fast, leaving inefficient structure
Ideal for:
Continuation trades
Pullback entries
Reaction zones after impulse moves
Color-coded
🟢 Bullish FVG
🔴 Bearish FVG
Inverse Fair Value Gaps (IFVG)
Automatically detects when an FVG is invalidated
Marks the same zone as an Inverse FVG
Extremely useful for:
Failed structure setups
Reversal trades
Stop-hunt & liquidity traps
Color-coded
🟡 IFVG (invalidation zone)
Balanced Price Range (BPR)
Detects overlapping bullish & bearish FVGs
Highlights price areas where buying and selling pressure are balanced
These zones often act as:
High-probability reaction areas
Compression zones before expansion
Premium intraday decision levels
Color-coded
🔵 BPR (balanced price range)
Smart, Clean & Non-Repainting
Non-repainting
Only the last 3 active zones are shown → no clutter
Boxes extend forward with a manual cap (user-controlled)
Designed for 1m – 15m execution, works on all markets
Futures, Crypto, FX, Indices, Stocks
How professionals use it
Combine FVGs with:
VWAP
Session highs/lows
Volume Profile (POC / VAH / VAL)
Market structure (BOS / displacement)
Use IFVGs to spot failed smart-money narratives
Use BPRs as decision zones, not blind entries
This indicator does not give buy/sell signals.
It shows you where trades make sense — execution is up to you.
Best use cases
Scalping (1m–3m)
Intraday trading (5m–15m)
Smart-money concepts
Liquidity-based trading
News reactions & stop runs
Learn how to trade it properly
This indicator is part of the KIMATIX Trading Framework.
More education, live examples & full system:
kimatixtrading.com

ICT HTF Candles + CISD + FVG, by AlephxxiiICT HTF Candles + CISD + FVG
A practical, friendly overlay for ICT-style trading
This indicator gives you three things at once—right on your chart:
HTF Candles Panel (context):
Compact candles from higher timeframes (e.g., 5m, 15m, 1H, 4H, 1D, 1W) appear to the right of price so you always see the higher-timeframe story without switching charts. It includes labels, remaining time for the current HTF candle, and optional open/high/low/close reference lines.
CISD Levels (bias flips):
Automatically plots +CISD and -CISD lines. When price closes above +CISD, the indicator considers bullish delivery. When price closes below -CISD, it considers bearish delivery. An on-chart table (optional) shows the current bias at a glance.
FVG (Fair Value Gaps):
Highlights inefficiency zones (gaps) on your current timeframe and/or a selected higher timeframe. You can choose to mark a gap “filled” when price hits the midpoint (optional).
Quick start (2 minutes)
Add to chart and keep your normal trading timeframe (e.g., 1–5m).
In settings → HTF 1..6, pick the higher timeframes you want to see (e.g., 5m, 15m, 1H, 4H, 1D, 1W).
Turn on FVG (current, HTF or both).
Watch +CISD / -CISD lines and the Current State table.
Close above +CISD → Bullish bias
Close below -CISD → Bearish bias
Trade with the bias and use FVGs as areas to refine entries or targets.
How to read it (the simple way)
Bias (CISD):
Bullish once price closes above the active +CISD level.
Bearish once price closes below the active -CISD level.
The small table (if enabled) says Bullish or Bearish right now.
HTF panel:
Shows higher-timeframe candles next to your current chart.
Labels show the timeframe (e.g., 1H) and a countdown for the current candle.
Optional traces draw HTF Open/High/Low/Close levels—great “magnets” for price.
FVGs:
Shaded boxes = potential inefficiency areas.
If Midpoint Fill is on, a touch of the midline counts as filled.
You can display current TF, HTF, or both.
Suggested workflow (popular ICT-style intraday)
Define bias with CISD
Only look for longs if Bullish, shorts if Bearish.
Check HTF context
Are you trading into a large HTF FVG or key HTF O/H/L/C level? That can be a target or a headwind.
Refine entries with FVGs
On your entry TF (1–5m), use fresh FVGs in the direction of the bias. Avoid fading straight into big HTF imbalances.
Key settings you’ll actually use
HTF 1..6: toggle each strip, select timeframe, and how many candles to show.
Style & layout: adjust offset, spacing, and width of the right-side panels.
Labels & timers: show/hide HTF name and remaining time; place labels at Top/Bottom/Both.
Custom daily open (NY): set the 1D candle to start at Midnight, 08:30, or 09:30 (America/New_York).
Trace lines: optional HTF O/H/L/C lines (style, width, anchor TF).
FVG module (extra): choose Current TF / HTF / Both, enable Midpoint Fill, auto-delete on fill, and show timeframe labels.
CISD lines: customize color, style (solid/dotted/dashed), thickness, and forward extension.
Table: enable/disable and choose its position.
Alerts
When a CISD completes, the script fires an alert (e.g., “Bullish CISD Formed” or “Bearish CISD Formed”).
Tip: Set your TradingView alert once on the indicator, then choose the alert message you want to receive.
Notes & limitations (read me)
“VI” label: The “Volume Imbalance” option marks price imbalances (body non-overlap). It does not read volume data.
Timezone: Daily logic and timers use America/New_York, which aligns with US indices/equities and common ICT practice.
Performance: This tool draws many boxes/lines/labels. If your chart feels heavy, reduce the number of HTFs or candles shown, or narrow panel width.
Repainting: HTF panels are designed to avoid future leakage; FVG logic follows standard 3-bar checks. As usual, wait for candle closes for confirmations.
Level cleanup: If Keep old CISD levels is OFF (default), the script keeps only the current active CISD to reduce clutter.
Hassi XAUUSD Advanced FVG EMA/BOS/RSI/Volume + Session FilterWhat it does :
This strategy automates a popular ICT-style idea on XAUUSD (Gold): trade only when price taps back into a Fair Value Gap (FVG), but filter entries with trend, structure, momentum, volume, and session rules. It manages risk with fixed TP/SL (points) and shows a compact backtest panel on chart.
Core Logic
1) Market Structure (BOS)
Detects recent swing highs/lows and flags a Break of Structure:
BOS Up when price breaks the latest swing high.
BOS Down when price breaks the latest swing low.
2) FVG Detection (3-candle)
Bullish FVG when low > high and low > high .
Bearish FVG when high < low and high < low .
The most recent qualifying gap is drawn as a shaded box (optional).
3) Bias & Filters
Trend Bias: price vs EMA (default 200). Longs only above EMA; shorts only below.
Momentum: optional RSI filter (default 14); avoid longs in OB & shorts in OS.
Volume: optional filter requiring current volume > SMA(20) × multiplier.
Sessions: optional London / New York (PKT) time windows.
Entries & Exits
Long Entry (all must be true)
Above EMA, RSI bullish, volume ok, session ok, BOS Up.
A recent Bullish FVG exists (within N bars).
Price taps back into the FVG (low ≤ top & close > bottom) with a bullish candle.
Short Entry (mirror)
Below EMA, RSI bearish, volume ok, session ok, BOS Down.
A recent Bearish FVG exists (within N bars).
Price taps (high ≥ bottom & close < top) with a bearish candle.
Risk / R:R
Exits use fixed points on XAUUSD (default TP 100, SL 50).
On many gold feeds 1.0 = 10 points; inputs convert to price automatically.
“One-trade-at-a-time”: a new signal won’t fire until the previous position is flat.
Chart Labels
On entry, the script plots BUY/SELL plus fixed TP/SL lines & labels anchored to the entry bar (they don’t drift with price).
Visuals & Tools
EMA line (green/red by bias).
Swing points (tiny triangles) to see structure.
FVG boxes (green/red, optional).
Session shading (subtle blue overlay).
Stats Panel (top-right):
Total Trades, TP Hits, SL Hits, Win Rate, Profit Factor, Net P&L.
Inputs (quick guide)
EMA Length (default 200)
Swing Lookback for BOS (default 5)
FVG Box Length (how far the zone extends to the right)
TP / SL (points) for XAUUSD + display Risk:Reward
Sessions (PKT): London & New York windows + toggle
Filters: Volume (multiplier), RSI (length, OB/OS)
Visibility: show/hide FVG boxes & TP/SL drawings
Alerts
Buy Signal / Sell Signal on valid entries
Position Opened / Position Closed notifications
Best Practices & Notes
Designed for XAUUSD 15-minute. You can test other timeframes, but retune TP/SL points and filters accordingly.
Broker ticks differ: if your symbol steps are not 0.1, adjust TP/SL points.
Use with a HTF confluence (e.g., D1/4H bias, key S/R, news awareness).
Backtests are approximations; real results vary with spreads, slippage, and execution.
Disclaimer: This tool is for educational purposes. It is not financial advice. Always test before using on live capital.

Logistic Regression ICT FVG🚀 OVERVIEW
Welcome to the Logistic Regression Fair Value Gap (FVG) System — a next-gen trading tool that blends precision gap detection with machine learning intelligence.
Unlike traditional FVG indicators, this one evolves with each bar of price action, scoring and filtering gaps based on real market behavior.
🔧 CORE FEATURES
✨ Smart Gap Detection
Automatically identifies bullish and bearish Fair Value Gaps using volatility-aware candle logic.
📊 Probability-Based Filtering
Uses logistic regression to assign each gap a confidence score (0 to 1), showing only high-probability setups.
🔁 Real-Time Retest Tracking
Continuously watches how price interacts with each gap to determine if it deserves respect.
📈 Multi-Factor Assessment
Evaluates RSI, MACD, and body size at gap formation to build a full context snapshot.
🧠 Self-Learning Engine
The logistic regression model updates on each bar using gradient descent, refining its predictions over time.
📢 Built-In Alerts
Get instant alerts when a gap forms, gets retested, or breaks.
🎨 Custom Display Options
Control the color of bullish/bearish zones, and toggle on/off probability labels for cleaner charts.
🚩 WHAT MAKES IT DIFFERENT
This isn’t just another box-drawing indicator.
While others mark every imbalance, this system thinks before it draws — using statistical modeling to filter out noise and prioritize high-impact zones.
By learning from how price behaves around gaps (not just how they form), it helps you trade only what matters — not what clutters.
⚙️ HOW IT WORKS
1️⃣ Detection
FVGs are identified using ATR-based thresholds and sharp wick imbalances.
2️⃣ Behavior Monitoring
Every gap is tracked — and if respected enough times, it becomes part of the elite training set.
3️⃣ Context Capture
Each new FVG logs RSI, MACD, and body size to provide a feature-rich context for prediction.
4️⃣ Prediction (Logistic Regression)
The model predicts how likely the gap is to be respected and assigns it a probability score.
5️⃣ Classification & Alerts
Gaps above the threshold are plotted with score labels, and alerts trigger for entry/respect/break.
⚙️ CONFIGURATION PANEL
🔧 System Inputs
• Max Retests – How many times a gap must be respected to train the model
• Prediction Threshold – Minimum score to show a gap on the chart
• Learning Rate – Controls how fast the model adapts (default: 0.009)
• Max FVG Lifetime – Expiration duration for unused gaps
• Show Historic Gaps – Show/hide expired or invalidated gaps
🎨 Visual Options
• Bullish/Bearish Colors – Set gap colors to fit your chart style
• Confidence Labels – Show probability scores next to FVGs
• Alert Toggles – Enable alerts for:
– New FVG detected
– FVG respected (entry)
– FVG invalidated (break)
💡 WHY LOGISTIC REGRESSION?
Traditional FVG tools rely on candle shapes.
This system relies on probability — by training on RSI, MACD, and price behavior, it predicts whether a gap will act as a true liquidity zone.
Logistic regression lets the system continuously adapt using new data, making it more accurate the longer it runs.
That means smarter signals, fewer false positives, and a clearer view of where real opportunities lie.

ICT HTF FVGs (fadi)ICT HTF FVGs displays the higher timeframe FVGs on current chart. This allows the trader to easily visualize the higher timeframe FVGs without having to mark them manually and see when price reaches point of interest for possible reversals or reaction.
This indicator attempts to provide as much flexibility possible by being able to define the following:
Higher Timeframe Settings
Timeframe to monitor
Bullish FVG color for this timeframe
Bearish FVG color for this timeframe
Maximum number of FVGs to display for this timeframe
Distance from current bar. This prevents overcrowding of FVGs
Hide Lower Timeframes from current chart. If this option is turned off, 5m timeframe FVGs will be displayed on an hourly chart as an example.
Show Border for the FVGs. Border color is derived from the FVG color
Show Mitigated FVG on the chart. The labels are removed to prevent the labels from overlapping with the candles on the chart/
Show C.E. Draws a line at the middle point of the FVG. This is usually an area of interest.
Show Label Shows the label with label color, background color, and label size.

KVS-Ultimate FVG & iFVG System [MTF + Distance Filter]Description: This indicator identifies Fair Value Gaps (FVG) and Inversion FVGs (iFVG) across multiple timeframes (MTF) with an advanced visualization system. Unlike standard FVG indicators, this script solves the "chart clutter" problem with a unique Distance Filter and offers a customizable Split Label System.
Key Features:
1. Unique Distance Filter (Clean Screen Mode):
When enabled, the script only shows the closest FVGs to the current price within a user-defined limit.
Keeps your chart clean while focusing on relevant price action levels.
2. Split Label System (Tabular Design):
Completely customizable label positioning, sizing, and coloring.
Separate controls for Normal FVGs and iFVGs.
Smart Label Logic: If you hide the FVG box, its label automatically hides. If an FVG breaks and becomes an iFVG (or fades), the label logic switches automatically to the iFVG settings.
3. Strict Mode Filtering:
Enabled: Checks if the candle closing price effectively breaks the previous structure (High/Low of the 1st candle), ensuring high-quality gaps.
Disabled: Detects all gaps between wicks (Standard calculation).
4. Multi-Timeframe (MTF) Support:
Monitor FVGs from up to 5 different timeframes simultaneously on a single chart.
5. Dynamic Interaction:
Choose how the script reacts when an FVG is broken: Turn it into an iFVG (Inversion) or simply fade the color (Ghost/Fade mode).
How to Use:
Use the "Distance Filter" checkbox in settings to clean up old/far blocks.
Adjust "TF1" to "TF5" to set up your multi-timeframe analysis.
Customize the Label Panel to align text perfectly with your chart style.
Disclaimer: This tool is for educational purposes and support for technical analysis.

MTF FVG, OB & Sessions1. Advanced Multi-Timeframe Fair Value Gaps (FVG)
This is the most complex part of the script. Unlike standard FVG indicators that just draw boxes, this module uses Arrays to manage the gaps dynamically.
Dynamic Mitigation: The script tracks every FVG stored in memory. If price trades through an FVG (mitigates it), the script automatically deletes the box.
Option (Wick vs. Close): You can choose to delete the FVG as soon as a wick touches the other side, or only if a candle closes through it.
Displacement Filter: It uses an ATR (Average True Range) multiplier to ensure that only significant, impulsive moves (displacement) generate an FVG, filtering out low-volatility noise.
Confluence (Overlap) Logic: The script checks for overlaps between the three different timeframes (e.g., a 4H FVG inside a Daily FVG).
Alignment Setting: You can set the script to highlight specific boxes only when timeframes align, indicating a stronger level of interest.
3 Monitorable Timeframes: Defaults to 4-Hour, 1-Hour, and 15-Minute, but fully customizable.
2. Multi-Timeframe Order Blocks (OB)
This module identifies potential Order Blocks based on Swing Highs and Swing Lows (Pivot points).
Pivot Detection: It looks for a specific pattern of highs/lows (defined by the "Swing Lookback" input) to identify key reversal points on higher timeframes.
MTF Overlay: It fetches these structures from the 3 defined timeframes and projects them onto your current chart.
Visuals: Draws extended boxes representing the open/close range of the order block candle.
3. Session Liquidity (Highs & Lows)
This module tracks the specific trading sessions to highlight intraday liquidity pools.
Sessions Tracked: Asia, London, and New York.
Behavior:
While the session is active, it tracks the highest and lowest price.
Once the session closes, it draws dashed lines extending forward from that session's High and Low.
Purpose: These levels act as key targets for liquidity sweeps (e.g., price sweeping the London Low before reversing).
Technical Summary
Data Handling: Uses request.security with barmerge.lookahead_on to fetch data from higher timeframes without repainting historical closed bars.
Efficiency: Uses specific types (type OB_Data) and Arrays to handle data efficiently, keeping the script fast despite processing multiple timeframes simultaneously.
Limits: Includes a built-in "Max FVG Storage" and "Delete After X Bars" feature to prevent the chart from becoming too cluttered with old data.

First FVG Custom Time RangeFirst FVG — Opening Range Fair Value Gap Detector
Smart Money Opening Imbalance Strategy Tool
This script automatically detects and highlights the first Fair Value Gap (FVG) that forms between 9:30 and 10:00 AM Eastern Time (New York session open) — a critical period often referred to as the Opening Range. It’s designed for Smart Money traders looking to isolate early-morning inefficiencies that may influence market behavior throughout the trading day.
🔍 What This Script Does:
Automatically Detects the First FVG in the Opening Range
Scans price action between 9:30 and 10:00 AM ET and identifies the first valid bullish or bearish FVG that forms.
Only one FVG is shown per day — ensuring a clean, focused view.
Draws a Visual Zone
Once detected, the FVG zone is extended forward on the chart (customizable duration).
A labeled zone helps users track how price reacts to it throughout the session.
Optional Retest Alerts
Alerts you when price re-enters the zone — a potential reaction point used by SMC traders.
Customization Options
Set your preferred session time window
Adjust zone duration (in bars)
Customize label font size, colors, and visibility
Enable/disable alert on retest
📈 Why the First FVG Matters:
Time-Sensitive Setup: The first FVG typically forms no earlier than 9:31 AM ET and represents a potential “time distortion” or imbalance zone created by aggressive market participants during the open.
Behavioral Study: Many traders journal how price behaves around this zone each day — whether it acts as support, resistance, or gets traded through later in the session.
Predictive Value: Observing how this zone is respected or broken can provide anticipatory insight into intraday price action, rather than reactive analysis.
Great for New Traders: This opening FVG is often recommended as a starting reference point for building trade models and understanding how institutional imbalances unfold.
🚀 What Makes It Unique:
This tool doesn’t spam your chart with every FVG. It laser-focuses on a single, time-bound zone backed by institutional logic — the first presented imbalance of the day during the opening range.
Use it to:
Monitor price behavior around early inefficiencies
Plan journal entries and pattern recognition
Align intraday setups with a high-probability SMC model
Whether you’re scalping, journaling market structure, or refining entries based on liquidity behavior — this script helps you make the first 30 minutes count.

FVG ST/RE Detector(v1.0.73)FVG ST/RE Detector
The FVG ST/RE Detector is a powerful technical analysis tool designed to identify market structure and potential trading opportunities through Fair Value Gaps (FVG), Structure Transitions (ST), and Re-entries (RE).
What This Indicator Does:
This indicator identifies and displays:
Fair Value Gaps (FVG): Areas where price has moved so quickly that it has left an imbalance in the market. These gaps represent potential areas where price may return to in the future.
Structure Transitions (ST): Points where the market structure changes from bearish to bullish or vice versa, signaling a potential trend change.
Re-entries (RE): Opportunities to enter the market in the direction of the prevailing trend after a pullback.
Leg Lines: Horizontal lines representing key structural movements in the market, helping traders visualize the market structure more easily.
How It Works:
The indicator detects FVGs when price moves rapidly, creating gaps in market value.
ST points are identified when the direction of FVGs changes from bearish to bullish or vice versa.
RE points are identified when a new FVG forms in the same direction after a pullback.
The indicator tracks and displays the number of consecutive leg lines in the current trend direction.
Key Features:
Customizable colors for bullish and bearish patterns
Optional display of ST and RE labels
Adjustable leg lines with multiple style options
Statistics panel showing the number of legs in the current direction
Alert system for new leg formations
Mitigation tracking to identify when FVGs have been filled
How to Use This Indicator:
Look for ST points to identify potential trend changes
Use RE points to find potential entries in the direction of the prevailing trend
Monitor the number of legs to gauge trend strength
Use FVGs as potential support and resistance areas
Set alerts to be notified of new leg formations
This indicator is suitable for all timeframes and markets, and can be used as part of a comprehensive trading strategy.
本指标的功能:
该指标识别并显示:
公平价值缺口 (FVG):价格快速移动以至于在市场中留下不平衡区域的区间。这些缺口代表价格未来可能回归的潜在区域。
结构转换 (ST):市场结构从看跌转变为看涨或相反的点位,预示潜在的趋势变化。
重新进入 (RE):在回调后沿着主导趋势方向进入市场的机会。
趋势腿线:代表市场中关键结构移动的水平线,帮助交易者更容易地可视化市场结构。

Twitter Model ICT [TradingFinder] MMXM ERL D + FVG + M15 MSS/SMT🔵 Introduction
The Twitter Model ICT is a trading approach based on ICT (Inner Circle Trader) models, focusing on price movement between external and internal liquidity in lower timeframes. This model integrates key concepts such as Market Structure Shift (MSS), Smart Money Technique (SMT) divergence, and CISD level break to identify precise entry points in the market.
The primary goal of this model is to determine key liquidity levels, such as the previous day’s high and low (PDH/PDL) and align them with the Fair Value Gap (FVG) in the 1-hour timeframe. The overall strategy involves framing trades around the 1H FVG and using the M15 Market Structure Shift (MSS) for entry confirmation.
The Twitter Model ICT is designed to utilize external liquidity levels, such as PDH/PDL, as key entry zones. The model identifies FVG in the 1-hour timeframe, which acts as a magnet for price movement. Additionally, traders confirm entries using M15 Market Structure Shift (MSS) and SMT divergence.
Bullish Twitter Model :
In a bullish setup, the price sweeps the previous day’s low (PDL), and after confirming reversal signals, buys are executed in internal liquidity zones. Conversely, in a bearish setup, the price sweeps the previous day’s high (PDH), and after confirming weakness signals, sells are executed.
Bearish Twitter Model :
In short setups, entries are only executed above the Midnight Open, while in long setups, entries are taken below the Midnight Open. Adhering to these principles allows traders to define precise entry and exit points and analyze price movement with greater accuracy based on liquidity and market structure.
🔵 How to Use
The Twitter Model ICT is a liquidity-based trading strategy that analyzes price movements relative to the previous day’s high and low (PDH/PDL) and Fair Value Gap (FVG). This model is applicable in both bullish and bearish directions and utilizes the 1-hour (1H) and 15-minute (M15) timeframes for entry confirmation.
The price first sweeps an external liquidity level (PDH or PDL) and then provides an entry opportunity based on Market Structure Shift (MSS) and SMT divergence. Additionally, the entry should be positioned relative to the Midnight Open, meaning long entries should occur below the Midnight Open and short entries above it.
🟣 Bullish Twitter Model
In a bullish setup, the price first sweeps the previous day’s low (PDL) and reaches an external liquidity level. Then, in the 1-hour timeframe (1H), a bullish Fair Value Gap (FVG) forms, which serves as the price target.
To confirm the entry, a Market Structure Shift (MSS) in the 15-minute timeframe (M15) should be observed, signaling a trend reversal to the upside. Additionally, SMT divergence with correlated assets can indicate weakness in selling pressure.
Under these conditions, a long position is taken below the Midnight Open, with a stop-loss placed at the lowest point of the recent bearish move. The price target for this trade is the FVG in the 1-hour timeframe.
🟣 Bearish Twitter Model
In a bearish setup, the price first sweeps the previous day’s high (PDH) and reaches an external liquidity level. Then, in the 1-hour timeframe (1H), a bearish Fair Value Gap (FVG) is identified, serving as the trade target.
To confirm entry, a Market Structure Shift (MSS) in the 15-minute timeframe (M15) should form, signaling a trend shift to the downside. If an SMT divergence is present, it can provide additional confirmation for the trade.
Once these conditions are met, a short position is taken above the Midnight Open, with a stop-loss placed at the highest level of the recent bullish move. The trade's price target is the FVG in the 1-hour timeframe.
🔵 Settings
Bar Back Check : Determining the return of candles to identify the CISD level.
CISD Level Validity : CISD level validity period based on the number of candles.
Daily Position : Determines whether only the first signal of the day is considered or if signals are evaluated throughout the entire day.
Session : Specifies in which trading sessions the indicator will be active.
Second Symbol : This setting allows you to select another asset for comparison with the primary asset. By default, "XAUUSD" (Gold) is set as the second symbol, but you can change it to any currency pair, stock, or cryptocurrency. For example, you can choose currency pairs like EUR/USD or GBP/USD to identify divergences between these two assets.
Divergence Fractal Periods : This parameter defines the number of past candles to consider when identifying divergences. The default value is 2, but you can change it to suit your preferences. This setting allows you to detect divergences more accurately by selecting a greater number of candles.
The indicator allows displaying sessions based on various time zones. The user can select one of the following options :
UTC (Coordinated Universal Time)
Local Time of the Session
User’s Local Time
Show Open Price : Displays the New York market opening price.
Show PDH / PDL : Displays the previous day’s high and low to identify potential entry points.
Show SMT Divergence : Displays lines and labels for bullish ("+SMT") and bearish ("-SMT") divergences.
🔵 Conclusion
The Twitter Model ICT is an effective approach for analyzing and executing trades in financial markets, utilizing a combination of liquidity principles, market structure, and SMT confirmations to identify optimal entry and exit points.
By analyzing the previous day’s high and low (PDH/PDL), Fair Value Gaps (FVG), and Market Structure Shift (MSS) in the 1H and M15 timeframes, traders can pinpoint liquidity-driven trade opportunities. Additionally, considering the Midnight Open level helps traders avoid random entries and ensures better trade placement.
By applying this model, traders can interpret market movements based on liquidity flow and structural changes, allowing them to fine-tune their trading decisions with higher precision. Ultimately, the Twitter Model ICT provides a structured and logical approach for traders who seek to trade based on liquidity behavior and trend shifts in the market.

ICT Open Range Gap & 1st FVG (fadi)In his 2024 mentorship program, ICT detailed how price action interacts with Open Range Gaps and the initial 1-minute Fair Value Gap following the market open at 9:30 AM.
What is an Open Range Gap?
An Open Range Gap occurs when the market opens at 9:30 AM at a higher or lower level compared to the previous day's close at 4:14 PM, primarily relevant in futures trading. According to ICT, there is a statistical probability of 70% that the price action will close 50% or more of the Open Range Gap within the first 30 minutes of trading (9:30 AM to 10:00 AM).
What is the First 1-Minute Fair Value Gap?
ICT places significant emphasis on the first 1-minute Fair Value Gap (FVG) that forms after the market opens at 9:30 AM. The FVG must occur at 9:31 AM or later to be considered valid. This gap often presents key opportunities for traders, as it represents a temporary imbalance between supply and demand that the market seeks to correct.
Understanding and leveraging these patterns can enhance trading strategies by offering insights into potential price movements shortly after market open.
ICT Open Range Gap & 1st FVG
This indicator is engineered to identify and highlight the Open Range Gaps and the first 1-minute Fair Value Gap. Furthermore, it functions across multiple timeframes, from seconds to hours, catering to various trading preferences. This flexibility is particularly beneficial for traders who favor higher timeframes or wish to observe these patterns' application at broader intervals.
Settings
The Open Range Gap indicator offers flexible display settings. It identifies the quadrants and provides optional color coding to distinguish them. Additionally, it tracks the "fill" level to visualize how far the price action has progressed into the gap, enhancing traders' ability to monitor and analyze price movements effectively. By default, the Open Range Gap will stop extending at 10:00 AM; however, there is an option to continue extending until the end of the trading day.
The 1st Fair Value Gap (FVG) can be viewed on any timeframe the indicator is active on, offering various styling options to match each trader's preferences. While the 1st FVG is particularly relevant to the day it is created, previous 1st FVGs within the same week may provide additional value. This indicator allows traders to extend Monday's 1st FVG, marking the first FVG of the week, or to extend all 1st FVGs throughout the week.

Mark FVGsMark FVGs is marking FVG (stands for Fair Value Gap, other name is Imbalance or IMB) on your chart so that you can instantly detect them
It supports:
- marking bullish and bearish partly filled or unfilled FVGs of the current timeframe
- marking bullish and bearish already filled FVGs of the current timeframe
- marking bullish and bearish FVGs of the any 4 timeframes on your current timeframe
technically it re-builds them on the last bar or as soon as new realtime bar is updated. it looks with 1k bars back to find the nearest specific number of FGVs
Adjustments:
- changing the maximum number of FVGs to display.
- changing the color of FVG area
- displaying already filled FVG of the current time frame
- changing the mode of displaying area it can either extended or fixed width
- displaying labels of other time frame FVGs

Fair Value Gaps (FVG)This indicator automatically detects Fair Value Gaps (FVGs) using the classic 3-candle structure (ICT-style).
It is designed for traders who want clean charts and relevant FVGs only, without the usual clutter from past sessions or tiny, meaningless gaps.
Key Features
• Bullish & Bearish FVG detection
Identifies imbalances where price fails to trade efficiently between candles.
• Automatic FVG removal when filled
As soon as price trades back into the gap, the box is deleted in real time – no more outdated zones on the chart.
• Only shows FVGs from the current session
At the start of each new session, all previous FVGs are cleared.
Perfect for intraday traders who only care about today’s liquidity map.
• Flexible minimum gap size filter
Avoid noise by filtering FVGs using one of three modes:
Ticks (based on market tick size)
Percent (relative to current price)
Points (absolute price distance)
• Right-extension option
Keep gaps extended forward in time or limit them to the candles that created them.
Why This Indicator?
Many FVG indicators overwhelm the chart with zones from previous days or tiny imbalances that don’t matter.
This version keeps things clean, meaningful, and real-time accurate, ideal for day traders who rely on market structure and liquidity.

FVG HTF# FVG HTF — Higher‑Timeframe Fair Value Gaps
## Summary
- Plots higher‑timeframe Fair Value Gap (FVG) zones directly on your current chart.
- Tracks fill progress using four methods: Any Touch, Midpoint Reached, Wick Sweep, Body Beyond.
- Shows optional labels with timeframe source and live fill percentage; label text color is configurable.
- Designed for clean overlays and efficient rendering with limits on graphics and bars processed.
## What It Does
- Detects bullish and bearish FVGs from a chosen timeframe (or the chart timeframe) and renders:
- Zone Top/Bottom lines and a dotted midpoint line
- Semi‑transparent area fill between the edges
- Optional label at the midpoint with a tooltip showing zone prices
- Continuously updates zones forward and removes them when the selected fill condition is met.
## Inputs
- `Enable FVG` (`fvgSH2`): Toggle detection/plotting on/off.
- `Timeframe` (`fvgTF2`): Choose `Chart` or HTFs (`5 Minutes`, `15 Minutes`, `1 Hour`, `4 Hours`, `1 Day`, `1 Week`, `1 Month`).
- `Fill Method` (`fvgFill2`):
- Any Touch — wick or body touches any part of the zone
- Midpoint Reached — price reaches at least the 50% of the zone
- Wick Sweep — wick fully travels past the far edge and back inside (conceptually stricter than touch)
- Body Beyond — candle body closes beyond the opposite edge (strong confirmation)
- `Zones` colors (`fvgCb2`, `fvgCs2`): Bullish/Bearish zone colors.
- `Labels` (`fvgLB2`): Show/Hide on‑chart labels.
- `Label Color` (`fvgLBc2`): Color picker for label text (default: white).
- `Max Bars Back` (`maxBars2`): Limits processing to recent bars for performance.
## Timeframe Rules
- The helper `htfTF` prevents selecting a timeframe lower than the chart. If an invalid lower TF is chosen, it falls back to `timeframe.period`.
- Supports minute, daily, weekly, and monthly aggregations that are safe for intraday/daily/weekly charts.
## Detection Logic
- Uses rolling higher‑timeframe bars constructed on the fly and checks 3‑bar displacement patterns:
- Bullish FVG: current HTF low above the high two bars ago AND previous HTF close above that high, with no direct gap condition.
- Bearish FVG: current HTF high below the low two bars ago AND previous HTF close below that low, with no direct gap condition.
- On detection, the script creates an FVG object with:
- Top/Bottom lines (`lnTop`, `lnBtm`) and midpoint line (`lnAvg`)
- Midpoint label (`lbTxt`) showing source timeframe and updating fill percentage
- Semi‑transparent fill (`linefill`) for visual clarity
## Fill Tracking
- Fill threshold depends on selected method:
- Any Touch: opposite edge
- Midpoint Reached: zone’s midpoint
- Wick Sweep: stricter condition conceptually (implemented as an opposite‑edge threshold)
- Body Beyond: requires close beyond the opposite edge
- Each bar updates label x‑position and line endpoints forward; the label text shows the best fill ratio achieved.
- When the threshold is reached, the FVG (label, lines, fill) is removed from the chart.
## Best Practices
- Start with `Any Touch` to visualize broad repairs; switch to `Body Beyond` for conservative confirmations.
- Use `1 Hour` or `4 Hours` overlays on 5m–15m charts for context; `1 Day` on 1H charts; `1 Week` on daily charts.
- Keep labels on when monitoring fills intraday; hide labels for clean higher‑level context.
- Adjust `Max Bars Back` if performance is impacted by many zones.
## Repainting Notes
- HTF zones are computed on `timeframe.change(tf)` and therefore confirm on HTF bar closes.
- Label endpoints extend each bar; detection itself avoids lookahead bias. For strict confirmation, align entries with HTF closes.
## Limitations
- “Wick Sweep” is treated as a stricter touch to the far edge; it does not enforce a separate “return inside” bar state.
- Label text color applies uniformly to bull/bear labels. If you need separate colors per side, contact the author.
## Credits & Version
- Pine Script v6; © rithsilanew2020
## Quick Start
1. Enable FVG and choose your HTF (e.g., `1 Hour`).
2. Pick a Fill Method (start with `Any Touch`).
3. Select zone colors and label text color.
4. Set `Max Bars Back` as needed for performance.
5. Use labels/tooltip values (Top/Mid/Bottom) to plan entries and manage risk.

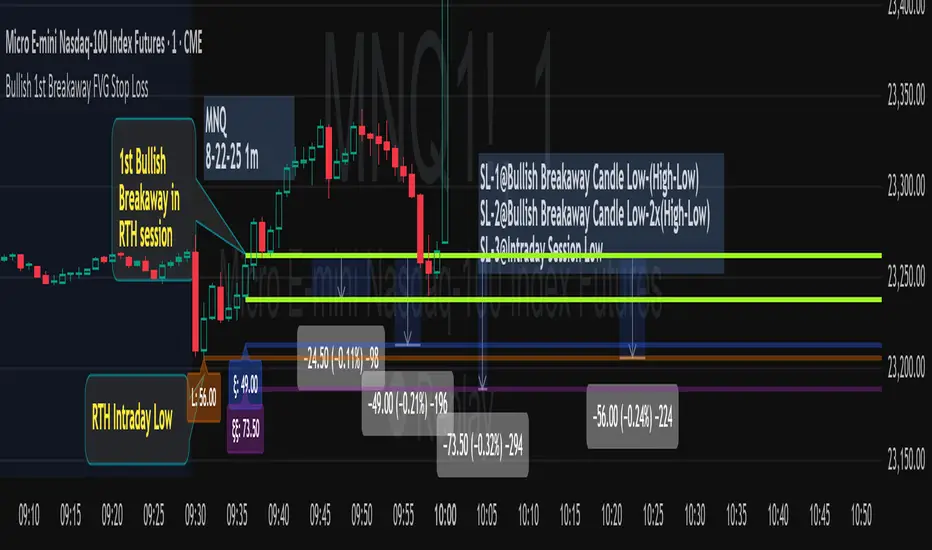
Bullish 1st Breakaway FVG Stop Loss
This indicator provides a defined 3-tier stop loss placement when you want to trade the 1st Bullish Breakaway FVG strategy. The Bullish Breakaway Dual Session FVG indicator is an independent indicator that track all bullish breakaway candles, however this one only tracks the very 1st breakaway candle with a stop loss visual cue.
Introduction of Bullish Breakaway Consolidated FVG:
Inspired by the FVG Concept:
This indicator is built on the Fair Value Gap (FVG) concept, with a focus on Consolidated FVG. Unlike traditional FVGs, this version only works within a defined session (e.g., ETH 18:00–17:00 or RTH 09:30–16:00).
Bullish consolidated FVG & Bullish breakaway candle
Begins when a new intraday low is printed. After that, the indicator searches for the 1st bullish breakaway candle, which must have its low above the high of the intraday low candle. Any candles in between are part of the consolidated FVG zone. Once the 1st breakaway forms, the indicator will shades the candle’s range (high to low).
Session Reset: Occurs at session close.
Choose your own session: use 930 to 1615 for RTH, 1800 to 1615 for ETH. (New York Time Zone)
Repaint Behavior:
If a new intraday (or intra-session) low forms, earlier breakaway patterns are wiped, and the system restarts from the new low.
Product Optimization:
This indicator is designed for CME future product with New York time zone. If you want to trade other products, please adjust your own time session.
Entry:
Long after the 1st Bullish Breakaway Candle in your active session.
However, best position of long is executed by your own trading skill and edge.
Stop Loss: ξ
ξ: This is the 1st stop loss, it is 1 equal size of the breakaway candle below the low.
ξξ: This is the 2nd stop loss, it is 2 equal sizes of the breakaway candle below the low.
L: This is the 3rd stop loss, it is the intraday session low.
Stop loss calculation:
Assuming you enter at the high of the breakaway candle, the SL number is shown as the high minus the stop loss placement.
Last Mention:
If you don't see anything in the indicator, adjust your session to an active session only, and use Tradingview replay function. This indicator is a live indicator with repainting mechanism.
Effective FVG Indicator - ImranDescription:
The Effective FVG Indicator is a technical analysis tool designed to identify Fair Value Gaps (FVGs) in financial markets. FVGs occur when there is a significant gap between the closing price of one session and the opening price of the next session, often indicating a potential reversal point. This indicator uses volume and price movement criteria to confirm and mark these gaps effectively.
Key Features:
Fair Value Gap Detection : Identifies both bullish and bearish FVGs based on significant gaps in price.
Volume Confirmation : Confirms FVGs with high volume, ensuring that the gap is not due to a lack of liquidity.
Price Imbalance : Ensures that the gap is accompanied by a large price movement within the session, indicating strong market sentiment.
Buy/Sell Signals : Marks bullish FVGs with a green "BUY" label below the bar and bearish FVGs with a red "SELL" label above the bar.
Background Highlighting : Highlights the background with a semi-transparent green or red color when a valid FVG is detected, making it easy to spot significant gaps.
Basic FVGBasic Fair Value Gap (FVG) Indicator
The Basic Fair Value Gap (FVG) Indicator is a tool designed for traders using the TradingView platform to identify and visualize Fair Value Gaps (FVGs) on any given chart.
Key Features:
Bullish and Bearish FVG Detection: The indicator automatically detects and highlights both bullish and bearish Fair Value Gaps on the chart. Bullish gaps are highlighted in blue, while bearish gaps are marked in red, with customizable transparency for clear visibility.
Customizable Parameters:
Max Bars Back: Users can set the maximum number of bars to look back in order to find potential FVGs.
Box Length: The length of the FVG box can be adjusted to fit the user's preference, allowing for better visual management on different timeframes.
Tick Buffer for Close Validation: The indicator only considers an FVG filled if the price closes beyond the gap by a customizable tick buffer, ensuring precise gap closure recognition.
Automatic Removal of Filled Gaps: Once an FVG is filled (i.e., the price closes beyond the gap by the defined tick buffer), the corresponding FVG box is automatically removed from the chart. This keeps the chart clean and focused on active gaps.
Real-Time Updates: The indicator updates in real-time, ensuring that traders have the most current information about potential gaps in price, which could signify strong support or resistance levels.

Inverse FVG with Rejections [TFO]This indicator is made to look for Inverse Fair Value Gaps (IFVGs) and show rejections from relevant areas. Fair Value Gaps (FVGs) are created when there is an energetic move that leaves a gap between the preceding and following candle's wicks. When that area is violated, we may consider that area as an Inverse FVG, treating it along the lines of a "support turned resistance" type setup with proper context.
Once a Fair Value Gap (FVG) is found with sufficient user-defined displacement, it is saved until price fully closes through that area, at which point it becomes an IFVG, which is also saved until price once again closes through that area.
Users can select a specific time period from which to look for and save FVGs, such as during the New York trading session in the following example.
Lastly, users can enable rejections that look for swing lows in bullish FVGs/IFVGs and swing highs in bearish FVGs/IFVGs. The following picture shows an instance of rejections from both regular and inverse FVGs, meaning the pivots were formed in a mutually shared area between a FVG and IFVG.

Multi-Timeframe FVG [TFO]The goal of this indicator is to find Fair Value Gaps (FVGs) that overlap on multiple timeframes. FVGs are already meant to be “sensitive” areas where one might expect price to react from, therefore FVGs that overlap on multiple timeframes could provide even more confluence that there may be a reaction in said area (with proper context).
Mitigation Type allows users to select how FVGs should be mitigated, either by wick or by completely closing through the area.
The displacement option helps to filter out smaller FVGs by looking for areas where price ran rather quickly (causing displacement). This is done by comparing the candle that made the FVG to a fractional ATR value, so that one may fine-tune how much “larger” the candle range needs to be, relative to recent price action.
The timeframe alignment option allows users to select how many timeframes must be converging in order to draw FVGs. For instance, with all timeframes selected, a timeframe alignment value of 2 would require that there be overlapping FVGs on 2 or more timeframes. A value of 3 would require that there be overlapping FVGs on all 3 timeframes in order for them to be drawn.
RMI Valid FVG & IFVGRMI • Valid FVG & iFVG (Smart Money Concept)
RMI • Valid FVG & iFVG is a precision-focused Fair Value Gap indicator designed for traders who follow Smart Money Concepts (SMC) / ICT logic and want to filter out low-quality, random gaps.
This indicator does not plot every FVG.
It highlights only structurally relevant FVGs that form in the direction of the trend and have a high probability of being filled.
Core Features
Bullish & Bearish Fair Value Gaps
Inverse Fair Value Gaps (iFVG)
Trend-aligned FVG filtering
Automatic invalidation after mitigation
Clean background zones for clear visibility
Optimized for intraday trading
Adjustable settings for scalping, intraday & swing trading
Smart Filtering Logic
FVGs are validated using market structure context
Only FVGs that form within the active trend are displayed
Weak or low-probability gaps are ignored
Inverse FVGs appear after strong displacement and rejection
Zones are visually faded once mitigated
This helps reduce chart noise and keeps the focus on high-probability reaction zones.
Best Use Cases
Entry refinement after BOS / CHoCH
Confluence with liquidity grabs
Premium / discount zone trading
Intraday & session-based trading
Works well with ICT, SMC, price action & structure-based strategies
Recommended Timeframes
Scalping: M1 – M5
Intraday (default): M5 – M15
Swing Trading: M15 – H1
(Default settings are optimized for intraday trading.)
Important Notes
This is not a signal indicator
No repainting
No buy/sell arrows
Designed as a decision-support tool, not an automated system
Always combine with proper risk management and confirmation.
RMI • Precision over noise.
Trade structure, not randomness.
