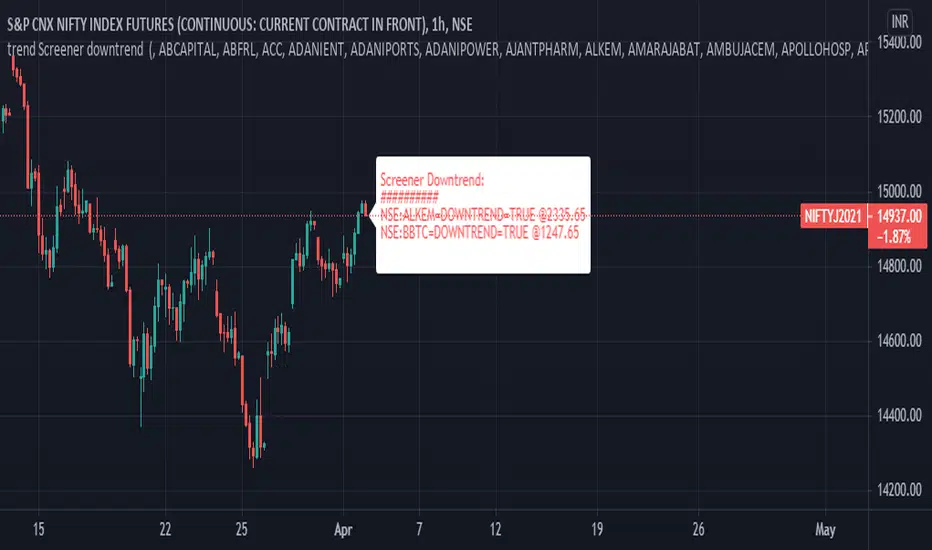
trend Screener downtrendthis is in continuation with - previous trend screener i have published, In this code only downtrend screener is there ,This is type of custom screener I searched and made to screen bulk stocks any one can modify it, other may get help out of it.
you can change or add new symbol in input section.
in my code i have made defined and printed last close price when downtrend was true.
1. downtrend = ema (close,55)< ema (close,144) and ema (close,144)< ema (close,388) and ema (close,388)<ema(close,576) and close<ema(close,388)
if the indicator is printing DOWNTREND=TRUE or UPTREND=TRUE then the corresponding stock is in currently in that trend out of the stocks listed in the code
in one code only 40 (max) stocks can be called.
to add more stocks I copied same code and changed the stocks in the code, now you can screen 80 stocks at a time.
This code runs on each bar and checks if the stocks is in uptrend or down trend.
you can customize this screener according to your requirement.
Cari dalam skrip untuk "screener"
CHK AIH (ACTION IS HERE!)-ALMA SCREENERWe do not like to stare at the screen whole day, instead we like to jump where the
action is.... The Screener was written with this in mind
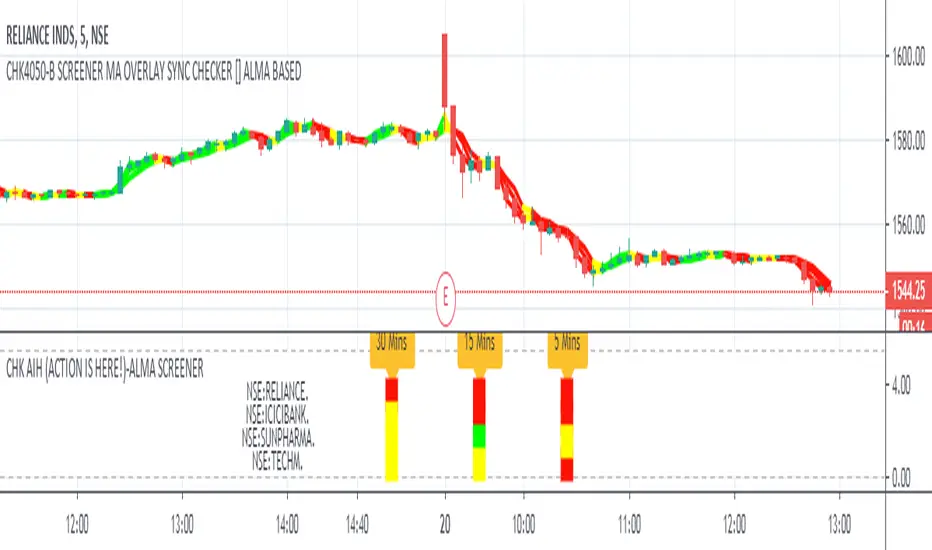
CHK AIH (ACTION IS HERE!)-ALMA BASED SCREENER
FEATURES
User can enter 3 Resolutions of his/her choice
User can select 3 Mov Avg Length of his her choice, which would be identical for all the three timeframes
User can enter stock basis his/her region's stock exchange
User can shift the screener left or right if not visible in a Multiscreen mode
Uses ALMA (Arnaud Legoux Mov Avg) as it smooth and reactive
Code is also provided below of MTF ALMA Moving Average OVERLAY on which this screener is based
LOGIC
For a particular timeframe If all the Moving Average are calibrated in one direction, it will show the requisite color.
For Example in an ideal scenario for a bull trend ALMA(5)> ALMA(13) > ALMA(21), once such a situation is identified, the screener will show green.
Yellow means lack of Calibration.
When 3 timeframes are calibrated, it becomes a high Probability Trade
BUGS
It is not allowing to enter the D/W/M timeframes, timeframe in numbers ...5/15/60 is working fine. If somebody can fix it
it would be great
LIMITATIONS
Because of TV's limitations only 4 scrips can be entered, however one add the indicator again with new scrips
//////////// CREDITS ////////////////////////////////////////////////////////////////////////////////////
//// hxxps://www.tradingview.com/script/rwdgyEZe/
/// Thank You Inno14 for graciously sharing your work. Your work has helped immensely !!!
////////////////////////////////////////////////////////////////////////////////////////////////////////
ICICIBANK
TECHMAHINDRA
YESBANK
Custom ScreenerI was inspired by this idea:
With his script you can create a simple custom screener in Pine Script on your own for 40 tickets or less. But to make a separate screener for every 40 stocks sucks, so I wrote a program that generates script that allows you to switch stock sets.
Current script is generated for the Moscow stock exchange.
You can contact me if you need screener for your exchange or big set of stocks.
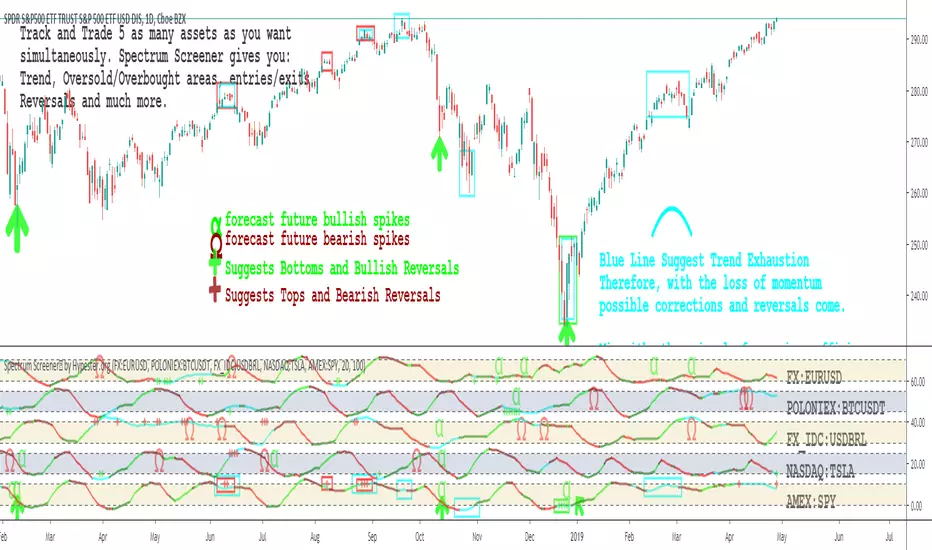
Spectrum Screener™ by HypesterSPECTRUM SCREENER™
We're releasing our ultimate tool to monitor and filter through assets. Our screener will tell you where the opportunities are happening, boosting your analysis speed, precision, profitability and drastically reducing your asset research time.
Say goodbye to staring at charts for hours
With our screener, you will spend your time where it matters, which is executing your trades. Let our Spectrum Screener™ save you the time to find where the action is.
SPOT TRADES WITHIN SECONDS
Have you ever felt confused, lost, staring at the screen for hours? Often, you find yourself overtrading and making slim calls? Spectrum Screener™ will warn you when anything worth your while is happening so you can focus on what matters, the trading.
MONITOR UNLIMITED ASSETS SIMULTANEOUSLY IN ONE SCREEN
The sky is the limit, you can track as many assets as your brain can possibly handle simultaneously before frying.
FLEX & ADVANCED MODE
If you already have a trading system going on, you just want to know when good moves will happen. That's what our flex mode will do for you; it will keep it simple and point you where the action is. If your system is not so well crafted, we offer a powerful in-depth view with a lot of insightful information in the advanced mode.
ALPHA-OMEGA VOLATILITY ALGORITHM
Based on the Richter scale modeling, we developed a proprietary volatility indicator that tells you when big moves might happen and their probable direction.
SPECTER MOMENTUM OSCILLATOR
Our special oscillator tells you if the trend is going up or down, if it’s just a correction or not, and if the asset is in a mean reversal area. All of that with one look.
FINE-TUNING PANEL
Like all other tools we offer, this indicator has its own fine-tuning panel so you can tweak the settings to your own preferences and trading style.
Pullback Screener Pro [LevelUp]Pullbacks are often considered high-probability entry points within trending markets. This screener helps streamline the search for such opportunities using trend analysis through customizable moving averages, price action and volatility filters with ATR (Average True Range).
🔹 Why Trade Pullbacks
Pullbacks represent temporary counter-moves within a broader trend. Instead of chasing extended moves, traders can enter at more favorable price levels.
Pros
▪ Improved Entry Prices : Entering closer to support or resistance levels often provides a better risk/reward ratio.
▪ Trend Alignment : Pullbacks occur within established trends, allowing traders to participate in potential continuation moves.
▪ Defined Risk Levels : Key moving averages and recent swing points can be used to set stop-loss orders.
Cons
▪ Not all pullbacks resume the trend; some signal reversals.
▪ Price can temporarily overshoot levels, creating whipsaws.
▪ Pullback strategies work best in trending markets and may underperform in sideways conditions.
🔹 Custom Feature : Require Lower Low
The optional requirement for a lower low may help confirm that an actual pullback is occurring, rather than just sideways chop or continuation strength.
Stricter Definition of a Pullback
▪ A pullback implies some retracement against the prevailing trend.
▪ By requiring a lower low, you ensure price is genuinely pulling back, not just consolidating at the highs.
Avoids False Triggers
▪ Without this filter, you might catch stocks that simply paused for a bar (small doji, tiny inside candle) but haven’t really pulled back.
▪ The lower low condition filters for bars where sellers actually pushed price down.
Improves Entry Timing
▪ Many traders want to enter as pullbacks are maturing, not while price is still pushing higher.
▪ A lower low shows some weakness that may soon transition into support, giving a cleaner “buy-the-dip” opportunity.
Psychological Confirmation
▪ From a trader psychology standpoint, a lower low indicates that at least some holders are taking profits and that short-term participants are testing the trend.
▪ This is often the moment when strong hands step in if the trend is healthy.
🔹 Custom Feature : Specify Closing Range
Closing range % is another optional feature that can be very useful when scanning for pullbacks as it helps separate healthy retracements from weak price action.
Shows Buyer Support Within the Bar
▪ Closing near the top of the day’s range (e.g., above 60–70%) signals that even though price pulled back intraday, buyers stepped in and pushed it higher by the close.
▪ That strength is a good sign the pullback may be stabilizing.
Filters Out Weak Pullbacks
▪ If a stock closes near the low of the day, sellers are still in control — the “dip” might not be done.
▪ By requiring a higher Closing Range, you filter out setups that may keep falling.
Timing Advantage
▪ Many traders prefer entering when a pullback shows early signs of turning.
▪ A strong closing range is an objective way to catch that transition, often right before the next leg higher.
Psychological Read
▪ Closing strength suggests demand is stepping back in — traders and investors still want exposure to the trend.
▪ It reflects confidence, whereas weak closes show hesitation or distribution.
🔹 Custom Feature : ATR % Filter
Specifying an ATR (Average True Range) filter is helpful when scanning for stocks because it normalizes volatility relative to price, enabling traders to identify stocks with suitable price movement for their strategy while managing volatility by filtering out excessively erratic stocks (high ATR %) or those with insufficient movement (low ATR %), thus aligning with risk tolerance and optimizing position sizing and stop-loss placement.
Focus on Stocks With Tradable Volatility
▪ ATR measures how much a stock typically moves in a day.
▪ By setting a minimum ATR, you avoid slow, low-volatility stocks that don’t move enough to create good opportunities.
Filters Out “Too Wild” Stocks
▪ Extremely high ATR stocks can be erratic, difficult to size properly, and risky to trade.
▪ By specifying a maximum ATR (or ATR % relative to price), you can avoid setups where risk is too unpredictable.
Normalizes Price Differences
▪ A $20 stock and a $200 stock can’t be compared just on raw dollar moves.
▪ ATR (or ATR as a % of price) gives a volatility-adjusted way to compare them, so your screen is consistent across all price levels.
Improves Entry & Stop Placement
▪ Knowing that a stock typically moves, say, 2% daily versus 0.5% daily helps you set realistic stops and targets.
▪ Screening for stocks with ATR in your preferred range means trades will line up better with your risk/reward model.
Psychology
▪ ATR captures behavior. Stocks with healthy, steady volatility attract active traders because they offer movement without chaos.
▪ Too quiet = boring, too wild = stressful. ATR filters help you stay in the sweet spot.
🔹 Customization Options
With extensive customization options, traders can fine-tune pullback scans by adjusting moving averages, proximity to those averages, bar structure, closing range strength, and volatility filters. This flexibility supports different trading styles, timeframes, and risk preferences.
Configurable Moving Averages
Scanning is optimized for daily and weekly timeframes.
▪ Select up to three moving average lengths and types (e.g. 20 EMA, 50 SMA, 200 SMA) for daily and weekly timeframes.
▪ Tailor scans to different trading styles:
• Short-term traders may prefer faster averages (e.g. 10–20 EMA).
• Swing traders often use medium-term averages (e.g. 50 SMA).
• Long-term investors may focus on slower averages (e.g. 200 SMA).
Pullback Within X % of Moving Average
▪ Specify the total range of a pullback using % above and % below a moving average. The bar low is used for this comparison.
▪ For example, .5% above and .5% below a moving average, giving price a total range of 1%. If the low is outside the range, it's not considered a valid pullback.
Require Low Lower
▪ Optional setting to require that the current bar to be a lower low compared to the prior bar.
▪ See above section for more information.
Closing Range %
▪ Specify a closing range to help you spot pullbacks where buyers are reasserting control.
▪ Define how close the closing price is to the daily high or low.
▪ See above section for more information.
ATR % Filter
▪ Incorporates volatility by measuring price movement relative to Average True Range (ATR).
▪ Options include:
• Above a specified ATR %
• Below a specified ATR %
• Within a specified ATR range
This options enables filtering for setups that align with volatility preferences and risk tolerance.
🔹 Trader Psychology
Pullback trading requires both patience and discipline. Understanding the psychology behind it can improve decision-making:
▪ Patience Over FOMO: Traders must resist the urge to chase extended moves. Waiting for a pullback often leads to better entries.
▪ Confidence in the Trend : Entering during a pullback can feel counterintuitive, as price is moving against the trend in the short term. Trusting the larger trend is essential.
▪ Managing Doubt: False pullbacks and whipsaws can create frustration. Keeping risk small and consistent helps maintain emotional balance.
▪ Discipline in Risk Control: Stops should be respected. Moving or ignoring stop-loss levels during a pullback can turn a small loss into a large one.
Successful pullback traders focus on process over outcome , knowing that consistency across many trades matters more than the result of any single trade.
🔹 True Market Leader Pullbacks
▪ GEV: Pullback to 10-EMA and 21-EMA
▪ NVDA: Pullback to 50-SMA
🔹 Best Practices
▪ Trend First : Pullbacks are most effective when traded in the direction of the larger trend. Confirm trend strength before acting on screener results.
▪ Combine Filters : Use moving average, closing range, and ATR filters together for higher-quality setups.
▪ Chart Review : Always verify results visually before trading.
▪ Risk Management : Consider swing lows (uptrends) or highs (downtrends) to define stop-loss placement.
🔹 Summary
The Pullback Screener helps traders quickly locate potential opportunities where price retraces toward key moving averages within an ongoing trend. With customizable filters for moving averages, closing range, and ATR, the screener adapts to a wide range of strategies and risk profiles.
Pullback trading offers favorable entries and defined risk, but success requires patience, discipline, and confirmation of trend conditions.
Skrip berbayar

Ultimate Custom ScreenerThis indicator will allow you to make your custom TradingView screener without coding. Add it to the chart, select up to 40 symbols and five indicators, and the screener will do the rest for you. The indicator will form a lovely table with all values and highlighted signals.
The screener is highly customizable, and you can choose its position on the chart, sorting, order of the columns, colors for the tables, and all signals separately. You can easily change parameters for all supported indicators and their signals.
Currently, there are 19 different custom indicators available. Current list of indicators:
Average Directional Index (ADX) - displaying the value of ADX and checking if it's higher than the threshold
Average True Range (ATR) - showing the value of ATR
Awesome Oscillator (AO) - displaying the value of AO and highlighting positive/negative values.
Bollinger Bands (BB) - showing if the price is above/below/in the channel.
Breakout Pivots - Displaying when the price is below/above the most recent pivot low/high.
Commodity Channel Index (CCI) - shows the last CCI value and highlights overbought/oversold values.
Directional Movement Index (DMI) - Up/Down signal (+DI above or below -DI)
Donchian Channel (DC) - showing if the price is above/below/in the channel.
Historical Volatility (HV) - Current value of Historical Volatility
Keltner Channel (KC) - showing if the price is above/below/in the channel.
Moving Average Convergence Divergence (MACD) - Up/Down signal (MACD above / below signal)
Moving Average Crossover (MA Cross) - Displaying MA crosses signals (SMA, EMA, WMA, HMA, VWMA, SMMA, DEMA, VWAP supported)
Moving Average Distance (MA DIST) - Displaying distance to the MA (SMA, EMA, WMA, HMA, VWMA, SMMA, DEMA, VWAP supported)
Price - Displaying the last price for the instrument
Relative Strength Index (RSI) - Displaying the last RSI value and highlighting overbought/oversold values.
Stochastic (STOCH) - Displaying the last Stochastic value and highlighting overbought/oversold values.
Stochastic RSI (STOCH RSI) - Displaying the last Stochastic RSI value and highlighting overbought/oversold values.
SuperTrend - Current state of the SuperTrend.
True Strength Index (TSI) - Displaying the last TSI value and highlighting overbought/oversold values.
We're already working on adding a few more supported indicators. If you have any ideas about the indicators you want to see in our screener, contact us, and we'll consider them.
Disclaimer
Please remember that past performance may not be indicative of future results.
Due to various factors, including changing market conditions, the strategy may no longer perform as well as in historical backtesting.
This post and the script don’t provide any financial advice.
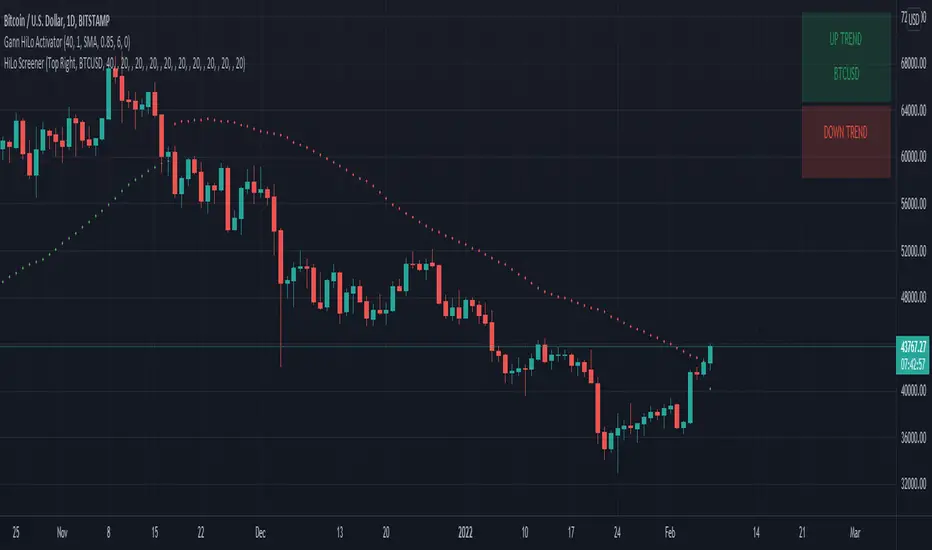
HiLo Screener█ OVERVIEW
This is a screener script for the Gann Hilo Indicator . It's an excellent trend analysis indicator to spot trend reversals.
█ DESCRIPTION
The screener works by scanning through up to 10 symbols and list down symbols that are currently breaking the high or low mean averages as definied by the Gann Hilo Indicator. Once you add it, 2 panels will be added to your chart - the green panel will list the symbols reversing into a bullish trend and the red panel will show the symbols reversing into a bearish trend.
█ HOW TO USE
After adding the indicator, open the script settings and type the symbol name and length to be used on the Gann Hilo Indicator for each stock.
█ FEATURES
The screener can scan up to 10 symbols each time.
█ LIMITATIONS
The screener will scan the symbols reversing trend on the current bar, and as such, there maybe some delays depending on the stock/etf/crypto you choose. Some exchanges require an additional subscription to get realtime data.
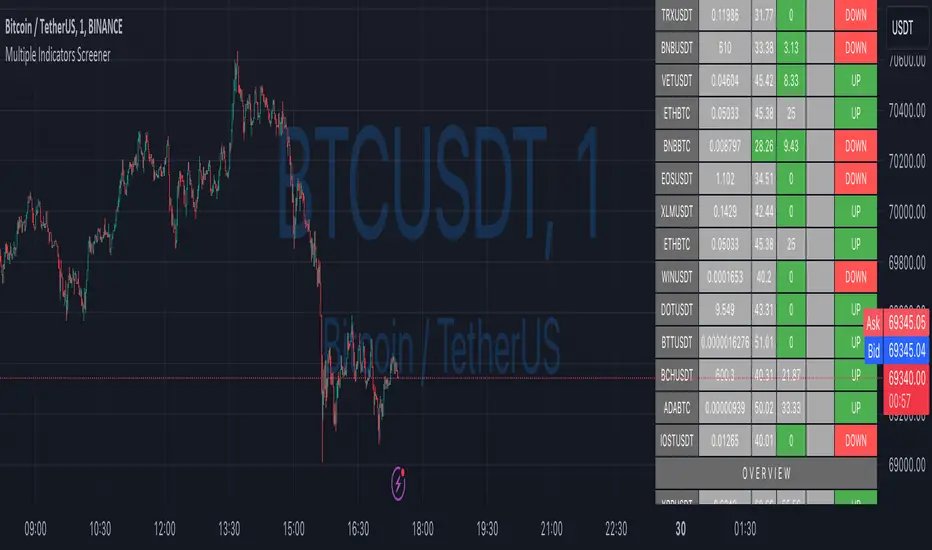
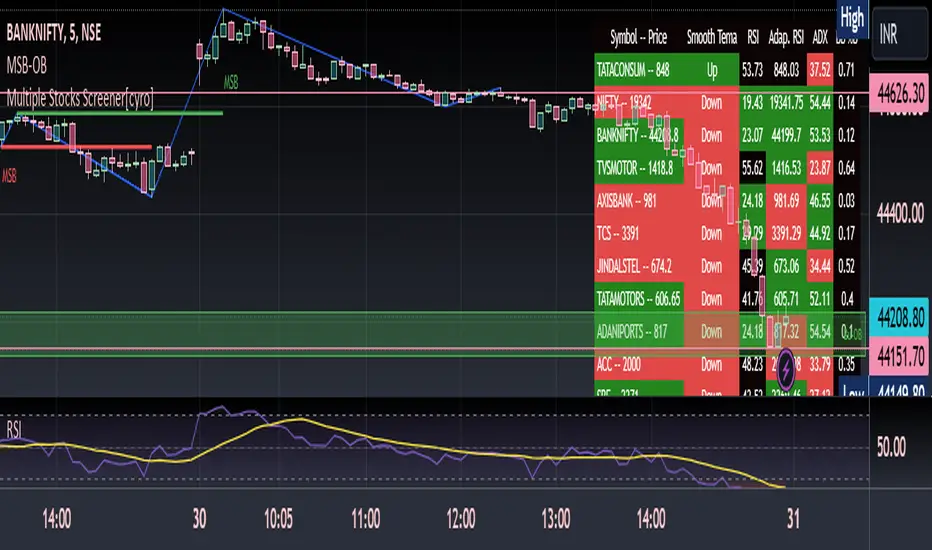
Multiple Indicators ScreenerA screener for multiple indicators with nice table output.
I was asked many times to update custom screener to display results in a table form. This way it looks much better.
You can play with background colors depend on values you're looking for.
In the screener, for example, I'm highlighting overbought/oversold RSI values, big ADX levels and trend of the Supertrend.
In parameters you can change settings for all indicators and change/disable tickers if 40 is too many for you.
There is only 1 function that calculates all these indicators. Potentially you can change and even add more indicators to this function.
Writing code for these kind of screener is a bit time consuming, so I even created a code generator in Python for these kind of indicators :) .
Disclaimer
Please remember that past performance may not be indicative of future results.
Due to various factors, including changing market conditions, the strategy may no longer perform as well as in historical backtesting.
This post and the script don’t provide any financial advice.

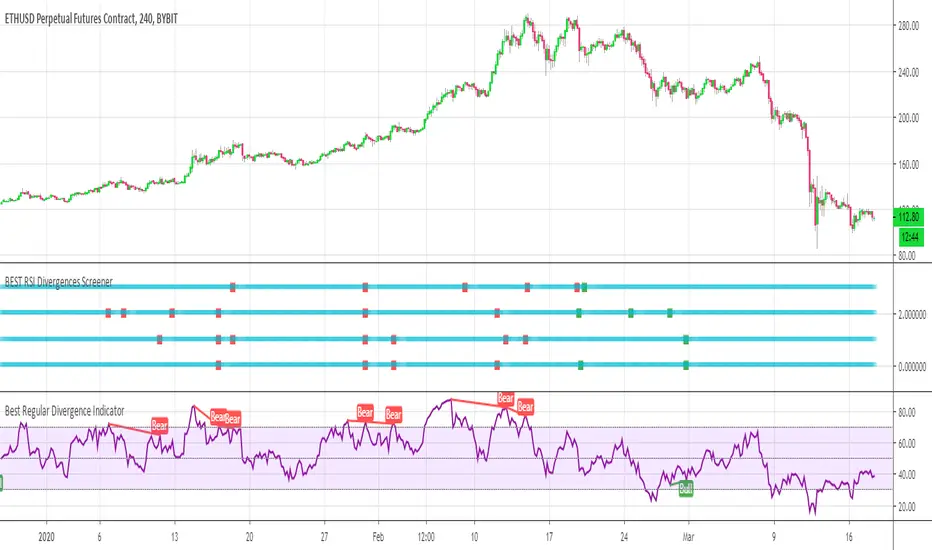
BEST RSI Divergences ScreenerHello traders
I hope you're all hanging on at home with what's going on these days...
The good news is.... it gives us more time to trade ^^.... #positive #attitude
I - Concept
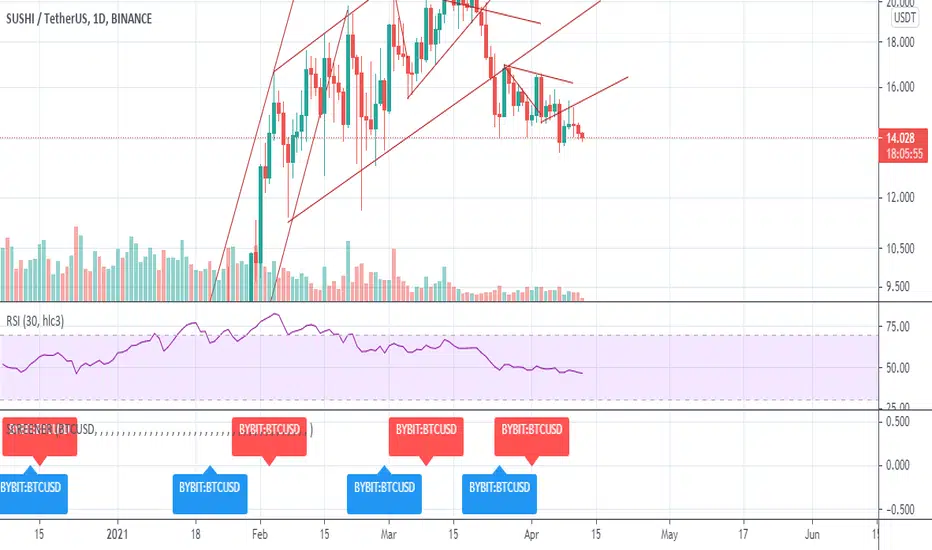
This screener detects whether the regular RSI divergences based on the TradingView Divergence built-in indicator (made by the gentleman @everget I believe)
With this screener, you can see in 1 view which of your favorite cryptos/stocks/forex pairs/etc. showing strong divergences
The gentlemen (and demoiselles) traders can play with the lookback/ranges inputs to adjust the divergences based on what they think is best of their trading/timeframe/instrument/life
On that script screenshot, I'm showing the BYBIT:BTCUSD part of the screener matching with the divergences on the chart
II - How did I set the screener
The visual signals are as follow:
- square: whenever a divergence is detected
Then the colors are:
- green when there is bullish regular divergence
- red when there is bearish regular divergence
Best regards
Dave
Sectoral Stock Top-to-Down Screener : ⭐ Sectoral Stock Top-to-Down Screener Analysis ⭐
This Screener indicator provides a bird's-eye view of the Market's important indices, sectors and Stocks listed in those sectors.
1: It represents a Screener Table that shows the (%) percentage change of the market, Sectors and all the Stocks (listed via input) . The color represents the Trend of the Previous day and the current day compared to Nifty50 Index.
2: The %percentage change is dependent on the Time-Frame selection:
This Input allows users to look at the Major Index > sectors > stocks in their specific time frame.
3: It has a alert function, which can trigger for all symbols/securities in the table.
Irrespective of Trading View Free or Paid user, this alert works for all .
4: Compatible with All Devices (Laptop / Mobile / Tablet / PC)

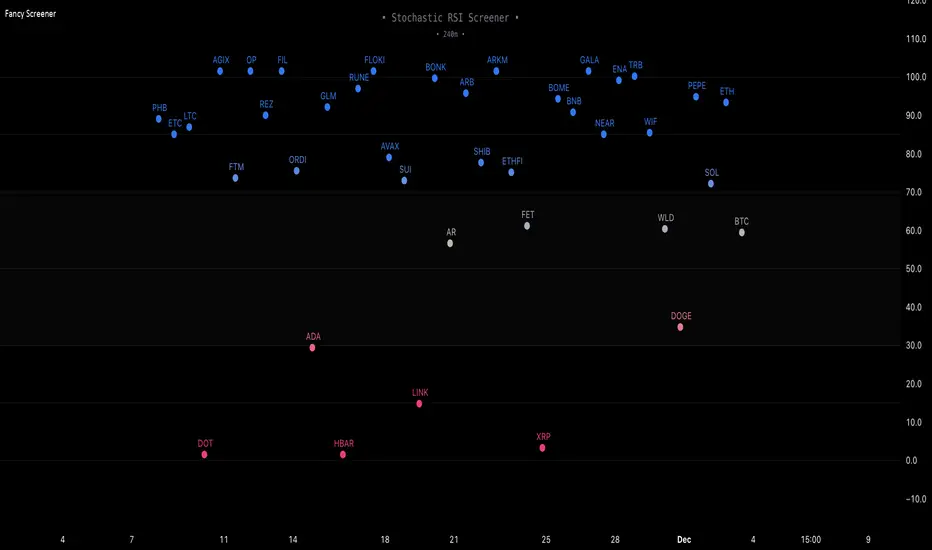
Fancy Oscillator Screener [Daveatt]⬛ OVERVIEW
Building upon LeviathanCapital original RSI Screener (), this enhanced version brings comprehensive technical analysis capabilities to your trading workflow. Through an intuitive grid display, you can monitor multiple trading instruments simultaneously while leveraging powerful indicators to identify market opportunities in real-time.
⬛ FEATURES
This script provides a sophisticated visualization system that supports both cross rates and heat map displays, allowing you to track exchange rates and percentage changes with ease. You can organize up to 40 trading pairs into seven customizable groups, making it simple to focus on specific market segments or trading strategies.
If you overlay on any circle/asset on the chart, you'll see the accurate oscillator value displayed for that asset
⬛ TECHNICAL INDICATORS
The screener supports the following oscillators:
• RSI - the oscillator from the original script version
• Awesome Oscillator
• Chaikin Oscillator
• Stochastic RSI
• Stochastic
• Volume Oscillator
• CCI
• Williams %R
• MFI
• ROC
• ATR Multiple
• ADX
• Fisher Transform
• Historical Volatility
• External : connect your own custom oscillator
⬛ DYNAMIC SCALING
One of the key improvements in this version is the implementation of dynamic chart scaling. Unlike the original script which was optimized for RSI's 0-100 range, this version automatically adjusts its scale based on the selected oscillator.
This adaptation was necessary because different indicators operate on vastly different numerical ranges - for instance, CCI typically ranges from -200 to +200, while Williams %R operates from -100 to 0.
The dynamic scaling ensures that each oscillator's data is properly displayed within its natural range, making the visualization both accurate and meaningful regardless of which indicator you choose to use.
⬛ ALERTS
I've integrated a comprehensive alert system that monitors both overbought and oversold conditions.
Users can now set custom threshold levels for their alerts.
When any asset in your monitored group crosses these thresholds, the system generates an alert, helping you catch potential trading opportunities without constant manual monitoring.
em will help you stay informed of market movements and potential trading opportunities.
I hope you'll find this tool valuable in your trading journey
All the BEST,
Daveatt
All Candlestick Patterns Screener [By MUQWISHI]▋ INTRODUCTION :
The Candlestick Patterns Screener has been designed to offer an advanced monitoring solution for up to 40 symbols. Utilizing a log screener style, it efficiently gathers information on confirmed candlestick pattern occurrences and presents it in an organized table. This table includes essential details such as the symbol name, signal price, and the corresponding candlestick pattern name.
_______________________
▋ OVERVIEW:
_______________________
▋ CREDIT:
Credit to public technical “*All Candlestick Patterns*” indicator.
_______________________
▋ USAGE:
_______________________
▋ Final Comments:
For best performance, add the Candlestick Patterns Screener on active symbol chart like QQQ, SPY, AAPL, BTCUSDT, ES, EURUSD or …etc.
Candlestick patterns are not a major concept to build a trading decision.
Personally, I see candlestick patterns as a means to comprehend the psychology of the market, and help to follow the price action.
Please let me know if you have any questions.
Thank you.

RSI Momentum Trend ScreenerIntroducing The RSI Momentum Trend Screener, to have the ability to scan 40 symbols at once
The screener is based on RSI Momentum Trend Indicator
It will show Positive Or Negative based on the symbol condition.
You can change the values on the screener, symbols, activate/disable symbols and change table position and color

Multiple Indicators ScreenerThis is a stock screener that incorporates open source code by QuantNomad, with the addition of slow and fast EMA pullback and crossover functions. It is designed for intraday scalping and quick trades, using 1, 3, and 5 minute candles. The RSI, Supertrend, and ADX indicators help to confirm trade setups, and the use of discount, premium, and equilibrium zones can improve results. With the ability to screen 40 stocks, the screener ensures that no quick action is missed. ]
Disclaimer
It is important to note that any trade initiated using this screener should be well researched, as the creator is not responsible for any profit or loss incurred.
Super Sniper - Screener - MTF- Multi Asset -Multi IndicatorSuper Sniper Screener with Multi Indicator EMA Crossover, Trend, ADX, MACD, SSL, CCI, STOCHASTIC, RSI, HMA, QQE, WAE. Trade Entry/Exit with multiple Indicator for Multiple Assets and Multiple Timeframe. if you are on a Higher / Lower Time frame and are looking for Entry/Exit based on a lower timeframe then this indicator is the best. The all in one screener for EMA Crossover, Trend, ADX, MACD, SSL, CCI, STOCHASTIC, RSI, HMA, QQE, WAE
What is Sniper Entry?
if you are on a Higher / Lower Time frame and are looking for Entry/Exit based on a lower timeframe then this indicator is the best.
About this indicator.
horizontal Lines are in pink (down) and blue(up) color grey (neutral)
10 horizontal lines are plotted each for a timeframe + Asset / Currency / Stock
Back ground represents UP/DOWN Trend based on EMA 200 with the current time frame.
RED-Dot and GREEN-Dot are buy sell signals of SSL Channel for current Time Frame.
You can choose only one type of indicator (EMA Crossover, Trend, ADX, MACD, SSL, CCI, STOCHASTIC, RSI, HMA, QQE, WAE) for all the 10-lines
Select Asset and Timeframe for Each Line on the Graph.
Based on the color of the line and changes on Multi Timeframe you can ENTER/EXIT a Trade on current Timeframe.
Hence a Sniper Entry with multiple Indicator Screener

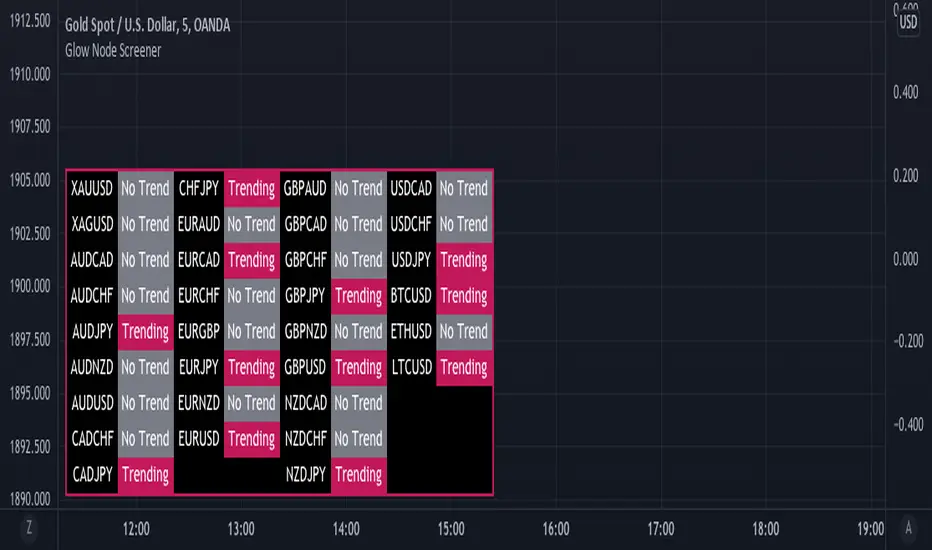
Glow Node ScreenerGlow Node Screener
Our Screener helps you identify whether a pair is in a strong trend for 32 different pairs including crypto.
Using our screener with a strategy will help you weed out bad markets that are ranging at a higher timeframe.
Which will in turn help reduce some of the bad trades you may take due to signals appearing in consolidation.
Very useful to choose which pairs you may like to trade for that day and what to avoid.
Higher Timeframe
The higher timeframe is automatically selected for you on the 15M - 30M - 1H - 4H time frames. You can override this by toggling the override button and selecting your timeframe manually
Pairs:
XAUUSD
XAGUSD
AUDCAD
AUDCHF
AUDJPY
AUDNZD
AUDUSD
CADCHF
CADJPY
CHFJPY
EURAUD
EURCAD
EURCHF
EURGBP
EURJPY
EURNZD
EURUSD
GBPAUD
GBPCAD
GBPCHF
GBPJPY
GBPNZD
GBPUSD
NZDCAD
NZDCHF
NZDJPY
USDCAD
USDCHF
USDJPY
BTCUSD
ETHUSD
LTCUSD
more will be added if requested
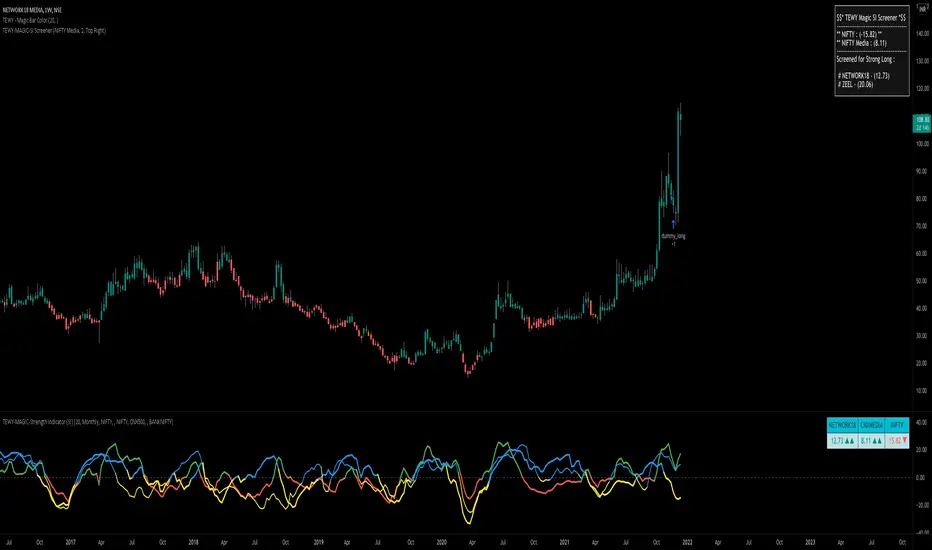
TEWY - Magic Strength Indicator (SI) ScreenerDetail about this indicator
This is screener to identify outperforming Stocks/Ticker based on the indicator "TEWY - Magic Strength Indicator (SI)" I deployed earlier. So please checkout that indicator description to understand more about this screener logic.
Below are the parameters that you may need to use to get outperforming indices/tickers.
1. Screener Set Name :
• Here you can see few of the predefined Index/Ticker sets i created, which you can use to screen Index/Ticker.
• If you select Set for 'Indices' you will get the list of Indices which are out performing NSE:NIFTY. Once you know which index is outperforming, then select the Set for that Index which I already given in the dropdown. That you will get the list of outperforming stock under that index.
• If you want to see all scripts of selected Sector Index that are outperforming NIFTY and may or may not be be outperforming Sector index, then please uncheck the box for "Outperforming Child Index Also". This will get you all the list of Stocks/Tickers which are outperforming Main Index NIFTY.
• If you want to see out-performers for specific period of time then change "How Many Outperforming Candles/Bars" as per your choice
• If you want to see under performers for Short trades then select "Find Short Trades" checkbox
• If you want to see the scripts which are just changed there signal then select "Latest Only" checkbox
Always respect RISKS and follow stop loss. In market stop loss is the only friend of yours.
I have given a sample illustrational image below, which should help you understand this indicator.
Best of luck
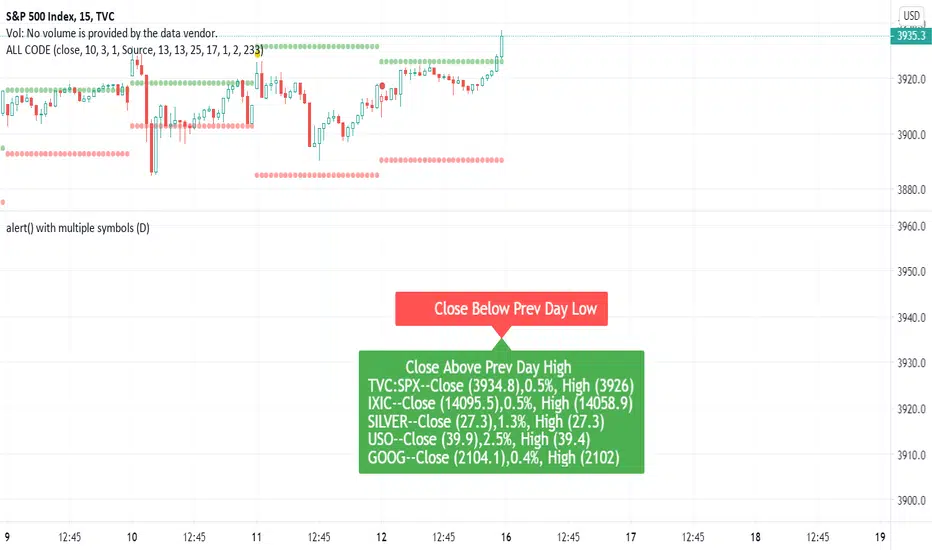
Dynamic Messages & Easy Screener1. Dynamic Message alerts with a Screener function
2. labels are generated using array strings making it easier to customize
3. Alert messages have well defined output with data variables
4. Traders with limited Pine knowledge can also plugin their functions
5. Closely track the alerts with Easy Screener
6. Attach it to the desired chart for alert periodicity and set resolution to the indicator setup
7. OHLC values for scanned securities also extracted for ready use in any indicator or study
Happy Trading and rest your sore eyes with Easy Screener!!
Enjoy TV on the GO!
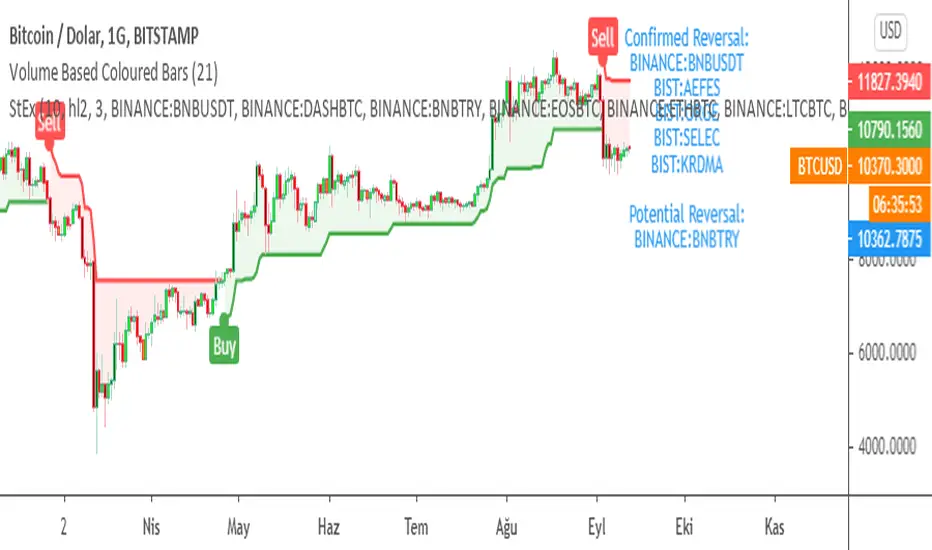
SuperTrend EXPLORER / SCREENERSUPERTREND EXPLORER / SCREENER screens the BUY and SELL signals (trend reversals) for 38 user defined different tickers in Tradingview charts.
Simply input the short name of the ticker in Tradingview that you want to screen.
Script is derived from zzzcrypto123 's work. Thanks for the permission letting me to use his logic.
Terminology explanation:
Confirmed Reversal: Supertrend reversal that happened in the last bar and cannot be repainted.
Potential Reversal: Supertrend reversal that might happen in the current bar but can also not happen depending upon the timeframe closing price.
Screener has also got a built in SuperTrend indicator which users can confirm the reversals on graphs.
Screener explores the 38 tickers in current graph's time frame and also in desired parameters of the SuperTrend indicator.
SUPERTREND INDICATOR:
STRATEGY version of SuperTrend Indicator:
SuperTrend is one of the most common ATR based trailing stop indicators.
In this version you can change the ATR calculation method from the settings. Default method is RMA, when the alternative method is SMA .
The indicator is easy to use and gives an accurate reading about an ongoing trend. It is constructed with two parameters, namely period and multiplier. The default values used while constructing a superindicator are 10 for average true range or trading period and three for its multiplier.
The average true range (ATR) plays an important role in 'Supertrend' as the indicator uses ATR to calculate its value. The ATR indicator signals the degree of price volatility .
The buy and sell signals are generated when the indicator starts plotting either on top of the closing price or below the closing price. A buy signal is generated when the ‘Supertrend’ closes above the price and a sell signal is generated when it closes below the closing price.
It also suggests that the trend is shifting from descending mode to ascending mode. Contrary to this, when a ‘Supertrend’ closes above the price, it generates a sell signal as the colour of the indicator changes into red.
A ‘Supertrend’ indicator can be used on equities, futures or forex, or even crypto markets and also on daily, weekly and hourly charts as well, but generally, it fails in a sideways-moving market.
Source function added to use the indicator as the ATR Trailing Stop indicator.
Just change source type hl2 to close.
different variations might be useful.
Market Echo Screener [BigBeluga]
The Market Echo Screener is a structured multi-asset dashboard capable of tracking up to 15 symbols simultaneously .
Designed to condense complex market data into an actionable format. Each column represents a specialized calculation, giving traders insight into signals, phases, retests, and volatility — all updated in real time.
For each symbol, it displays a full set of analytics: trend signals, take profit progression, wave structure, equilibrium pulls, volatility-adjusted flows, smart band retests, volatility regimes, and live price context — all condensed into one unified table.
Instead of flipping through multiple charts, traders get an instant overview of market dynamics across an entire watchlist, making it easier to spot alignment and high-probability opportunities.
⬤ Trend Signals
This column is powered by a low-pass digital trend filter that smooths short-term fluctuations and isolates directional momentum.
It produces Buy and Sell signals when price crosses adaptive thresholds relative to the smoothed baseline. Stronger “+” signals appear when slope acceleration or momentum divergence confirms additional conviction.
• Uses recursive filtering to eliminate noise.
• Signal strength is determined by the magnitude of deviation from the baseline.
• Tracks how many bars back the signal occurred, using a bar-counting algorithm.
• Combines both normal and power signals to reflect phases of market conviction.
⬤ TPs (Take Profits)
The take profit ladder is generated through an adaptive volatility-projection model .
When a signal fires, projected levels are based on volatility-weighted extensions. Each level (TP1–TP6) represents an incrementally wider confidence band, dynamically recalculated with every new bar.
• Uses volatility-normalized ranges for TP distances.
• Level activation is sequential, progressing as price reaches thresholds.
• Reset occurs when opposite signals are detected.
• Higher TPs imply extended momentum runs, while early TP triggers highlight conservative exits.
⬤ ActionWave
The ActionWave column applies a dual-smoothing algorithm combining custom MA stacks and polynomial regression to capture the underlying wave structure.
It identifies macro phases (Bullish ∆ / Bearish ∇) and flags retests when price folds back into the average after expansion.
• Wave slope is calculated using gradient differentials.
• Retests are confirmed within a bar-window threshold (e.g., 20–25 bars).
• Distinguishes continuation from exhaustion by analyzing whether slope remains positive/negative.
• Provides a clean map of trend rhythm without intrabar noise.
⬤ Magnet
The Magnet measure calculates a dynamic equilibrium band around price.
By averaging the midpoints of recent high–low ranges and weighting them by volatility, it defines a “fair zone” where price tends to trend and mean-revert.
• Bullish/Bearish status is derived from price position relative to the equilibrium mean.
• Retests occur when price leaves the zone and then re-enters within a tolerance band.
• Incorporates a mean-reversion index to highlight strength of pull.
• Acts as a gravitational anchor, showing when price is likely to snap back.
⬤ FlowTrend
FlowTrend is calculated using volatility and noise adjusted envelope bands .
It determines the active market flow by testing whether price consistently holds above or below the smoothed envelope. Retests are logged when price touches the envelope and respects trend direction.
• Bands expand/contract based on ATR and rolling variance.
• Flow state = Bullish if closing above upper envelope, Bearish if below.
• Retests validated only if trend slope and band alignment remain intact.
• Helps identify continuation setups by filtering false flips.
⬤ Smart Bands
Smart Bands employ an adaptive trailing stop framework that shifts with volatility and momentum.
Price interaction with these bands is tracked for bullish (∆) or bearish (∇) retests, highlighting whether the current move has revalidated at its volatility boundary.
• Bands derived from trailing volatility-adjusted stops.
• Upward retest fires when price tests support bands during uptrend.
• Downward retest occurs when resistance bands are tapped in downtrend.
• Provides structured “confirmation points” that validate signals.
⬤ Volatility
Volatility is measured via a hybrid standard deviation logic .
First, the standard deviation of closing prices over 10 bars is scaled by a factor, then normalized against its own 20-bar rolling standard deviation. The result is converted into a 0–100 index, producing three regimes:
❄️ Calm (<50): low dispersion, mean-reversion conditions dominate.
⚠️ Elevated (50–70): directional expansion likely, watch for breakout tension.
💥 Explosive (>70): strong dispersion, trend-following setups favored.
• Uses layered smoothing to dampen noise.
• Normalization ensures comparability across different assets.
• Acts as a meta-filter for selecting strategy type (range vs. momentum).
⬤ Price
The price column displays the latest close rounded to the nearest tick size.
It is color-coded by candle bias: green for bullish closes, red for bearish closes.
• Tick normalization ensures clean display across assets with different decimal precision.
• Color-coding gives instant sentiment context.
• Serves as the anchor reference for all other metrics in the row.
The Market Echo Screener is not a simple signal table — it’s a layered analytics framework.
Each column is driven by technical calculations: smoothing filters, volatility projections, equilibrium models, and adaptive band logic. Together, they create a unified lens on multiple assets, allowing traders to rapidly identify alignment, filter out noise, and focus on the clearest opportunities.

Multiple Instrument Automation ScreenerI have developed a Pine Script indicator on TradingView designed to demonstrate how to automate execution for ten instruments. This example utilizes a straightforward, Simple Moving Average (SMA) indicator. You can use it as a template, but use your indicator.
The indicator computes long/short signals based on the crossing of the SMA using the security function
It acts as a screener, presenting calculation results in an organized table format.
Utilizing the varip variable, the indicator sends alerts for multiple instruments sequentially rather than simultaneously.
For every generated signal, the indicator builds and sends a JSON execution command to a third-party tool, ensuring seamless integration and automation. You can use your own format.
Sent alerts look like this:
{"ticker": "DOGEBTC","action": "buy","price": "0.00000199","time": "1719754620658"}
Details and Limitations
Instrument Limit: The example is configured for ten instruments for simplicity. However, it can be expanded to handle up to 40 instruments.
Alert Rate Limit: There is a rate limit of 15 alerts in 3 minutes. Exceeding this limit may cause some alerts to be stopped. This can be managed by tracking the alert times and delaying some alerts, though this may affect the entry prices.
Timing of Signal Generation : The indicator processes signals at the bar close to the active instrument. Due to its computational complexity, there is a slight delay in collecting all records, potentially causing signals to reflect a few seconds before the bar closes. Care should be taken when executing based on these signals.
Disclaimer
Please remember that past performance may not be indicative of future results.
Due to various factors, including changing market conditions, the strategy may no longer perform as well as in historical backtesting.
This post and the script don’t provide any financial advice.

RSI Heatmap Screener [ChartPrime]The RSI Heatmap Screener is a versatile trading indicator designed to provide traders and investors with a deep understanding of their selected assets' market dynamics. It offers several key features to facilitate informed decision-making:
█ Custom Asset Selection:
The user can choose up to 30 assets that you want to analyze, allowing for a tailored experience.
█ Adjustable RSI Length:
Customize your analysis by adjusting the RSI length to align with your trading strategy.
█ RSI Heatmap:
The heatmap feature uses various colors to represent RSI values:
█ Color coding for labels:
Grey: Signifies a neutral RSI, indicating a balanced market.
Yellow: Suggests overbought conditions, advising caution.
Pale Red: Indicates mild overbought conditions in a strong area.
Bright Red: Represents strong overbought conditions, hinting at a potential downturn.
Pale Green: Signals mild oversold conditions with signs of recovery.
Dark Green: Denotes full oversold conditions, with potential for a bounce.
Purple: Highlights extremely oversold conditions, pointing to an opportunity for a relief bounce.
█ Levels:
Central Plot and Zones: The central plot displays the average RSI of the selected assets, offering an overview of market sentiment. Overbought and oversold zones in red and green provide clear reference points.
█ Hover Labels:
Hover over an asset to access details on various indicators like VWAP, Stochastic, SMA, TradingView ranking, and Volume Rating. Bullish and bearish indicators are marked with ticks and crosses, and a fire emoji denotes heavily overextended assets.
█ TradingView Ranking:
Utilize the TradingView ranking metric to assess an asset's performance and popularity.
Thank you to @tradingview for this ranking metric.
█ Volume Rating:
Gain insights into trading volumes for more informed decision-making.
█ Oscillator at the Bottom:
The RSI average for the entire market, presented in a normalized format, offers a broader market perspective. Green indicates a favorable buying area, while red suggests market overextension and potential short or sell opportunities.
█ Heatmap Visualization:
Historical RSI values for each selected asset are displayed. Red indicates overbought conditions, while green signals oversold conditions, helping you spot trends and potential turning points.
This screener is designed to make entering the market simpler and more comprehensive for all traders and investors.

[Pivots Consolidation Breakout Screener] with Alerts (TSO) This is a pivots consolidation screener indicator, with ability to choose up to 12 different symbols/instruments with alert to be notified when consolidation happens on either one with the new pivots formation (new R3(inner resistance) pivot formed below previous one and new S3(inner support) pivot formed above previous one). Once the alert on a certain symbol/instrument is received - there is an ability to set a Breakout alert for the consolidated symbol/instrument.
This is a very powerful strategy, which doesn't happen often, but when happens - it often causes big moves after a breakout!
NOTE: Every calculation is done on a confirmed closed candle bar state, so the indicator will never repaint!
===========================================================================
Explanation of all the Features/Inputs/Settings
---------------------------------------------------------------------------
>>> On the very top, please read the important NOTES/TIPs.
>>> Next section is where the desired symbols can be turned on/checked to be screened for consolidation - the selected/checked symbols at creation of a 'Any alert() function call' alert will alert on any of the selected/checked symbols. Also, once consolidation forms, until next pivots formation - it will show it on the "Consolidation Stats" table. Once alerted on a specific symbol for consolidation - manual alert - 'Consolidation BREAKOUT' - can be created (MUST be done on the actual symbol chart, Right-Click > Add Alert) to be notified when actual breakout takes place.
>>> Pivots Settings section is where a manual timeframe/length can be set for the pivots as by Default it uses "Daily" timeframe. So, if want to experiment with more signals, but less accurate - a smaller timeframe can be set for Pivots Timeframe with smaller chart timeframe.
>>> Final section is simply the "Consolidation Stats" table location.
===========================================================================
Adding Alerts in TradngView
---------------------------------------------------------------------------
1) Consolidation alert(s) for the selected/checked symbols
- Select/check/find the desired symbols/instruments (when selecting symbols, make sure - they are from correct BROKER/SOURCE as pricing may differ between different brokers, causing confusion (under 1 broker/source, the symbol will be consolidated, under another it will not...))
-Right-click anywhere on any TradingView chart
-Click on Add alert
-Condition: Select this indicator by it’s name
-Immediately below, change it to "alert() function calls only"
-Expiration: Open-ended (that may require higher tier TradingView account, otherwise the alert will need to be occasionally re-triggered)
-Alert name: Whatever you desire
-Hit “Create”
-Note: If you change ANY Settings within the indicator – you must DELETE the current alert and create a new one per steps above, otherwise it will continue triggering alerts per old Settings!
* Once alert triggers, don't get confused, as it will show "Alert on SYMBOL", the SYMBOL will be where you created the major alert for all the symbols within the screener list! Within the alert, on the bottom, it will say: "EURUSD: Camarilla Pivots R3S3 Consolidation ALERT!" - this is where the correct symbol is for which the alert for consolidation was triggered!
---------------------------------------------------------------------------
2) Consolidation BREAKOUT alert(s)
-Right-click anywhere on any TradingView chart
-For the actual symbol (which got consolidated), open the chart (make sure timeframe is the same as with which "Consolidation alert(s)" were created prior), then Right-Click on the chart > Add Alert
-Click on Add alert
-Condition: Select this indicator by it’s name
-Immediately below, change it to "Consolidation BREAKOUT1"
-Expiration: Open-ended (that may require higher tier TradingView account, otherwise the alert will need to be occasionally re-triggered)
-Alert name: Whatever you desire
-Hit “Create”
* It will alert when a breakout occurs in any direction - once you open the chart for the symbol/instrument for which alert has occurred - you can immediately see into which direction the breakout occured, it will be marked on the chart with green/red triangle.
===========================================================================
If you have any questions or issues with the indicator, please message me directly via TradingView.
---------------------------------------------------------------------------
Good Luck! (NOTE: Trading is very risky, past performance is not necessarily indicative of future results, so please trade responsibly!)
