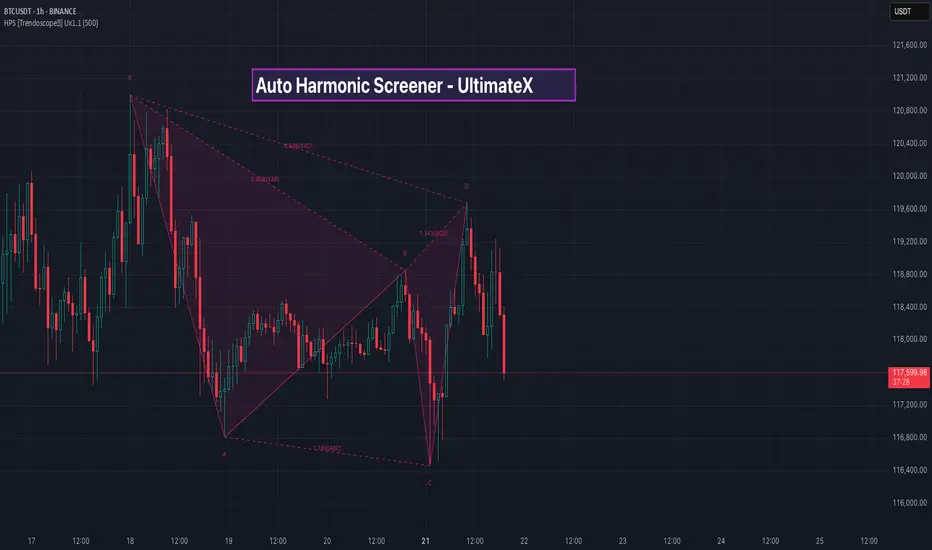
Auto Harmonic Screener - UltimateX [Trendoscope®]🎲 Introduction to Auto Harmonic Screener UltimateX
The Auto Harmonic Screener UltimateX is a sophisticated TradingView indicator designed to automatically detect and screen for a wide range of harmonic patterns across multiple zigzag levels. It builds on the foundation of harmonic trading principles, using recursive zigzag analysis to identify potential reversal zones based on Fibonacci ratios. This indicator complements the Auto Harmonic Pattern UltimateX by focusing on screening functionality rather than isolated pattern detection. This is script is designed and optimized to be used with Pine Screener
The indicator produces harmonic patterns on the chart. As an indicator, it does not offer more than what Auto Harmonic Pattern UltimateX offers. However, the major difference is that Auto Harmonic Pattern UltimateX concentrates on the usage as indicator and providing stats and back test data based on historical patterns whereas this script is optimized to be used with Pine Screener to screen across 100s of symbols at once to find out potential patterns across the market.
🎲 Core Mechanics: How the Indicator Works
🎯 Zigzag Pivot Detection
The indicator starts by calculating zigzag pivots. Zigzag identifies swing highs and lows by filtering price movements based on a minimum length (default: 8 bars) and depth (default: 100 pivots).
You can opt to use close prices instead of high/low for zigzag calculation (via Use Close Prices ), which smooths out noise in volatile markets but may miss extreme swings.
Zigzag is recursive: It begins with a base level (level 0) and generates higher levels by combining pivots from lower levels. This allows scanning for patterns at various scales, from short-term to long-term structures.
New pivots trigger pattern scans only when confirmed
🎯 Harmonic Pattern Scanning
Patterns are scanned using the last 5 zigzag pivots: X (oldest), A, B, C, D (newest)
The scan compares price ratios (e.g., AB/XA, BC/AB, CD/BC, XD/XA) against predefined Fibonacci-based ranges for each pattern type, with an adjustable error threshold (default: 8%).
Log scale scanning (Scanning under Log Scale ) can be enabled for assets with exponential growth (e.g., cryptocurrencies), ensuring ratios are calculated proportionally.
Strict mode ( Strict Ratio Scanning Mode ) disables error additions when ratio ranges vary, prioritizing accuracy over quantity of detections.
Detected patterns are stored in an array and checked for duplicates (based on pivot indices) to avoid redundancy.
The Potential Reversal Zone (PRZ) is calculated as a range where the D point should land for pattern completion.
🎯 Pattern Categories and Types
Classic Patterns : Standard harmonic formations like Gartley, Bat, Butterfly, Crab, Deep Crab, Cypher, Shark, Nenstar,
Anti/Alternate Patterns : Variations with inverted or extended ratios, such as Anti Gartley, Anti Bat, Anti Butterfly, Anti Crab, Anti Cypher, Anti Shark, Anti Nenstar, Navarro.
Non-Standard Patterns : Less common structures like 5-0, Three Drives, or Black Swan, White Swan, 121, Sea Pony, Leonardo, Total.
You can enable/disable categories or individual patterns via inputs. The indicator uses a map to track active patterns and scans only those selected
🎯 Trade Monitoring and Confirmation
Patterns identified are monitored for entry, failure and success. Patterns are kept on the chart until they are either invalidated, stopped or reaches the target. The status of the pattern is also used during the filtering of patterns using Pine Screener
🎯 Output and Signals
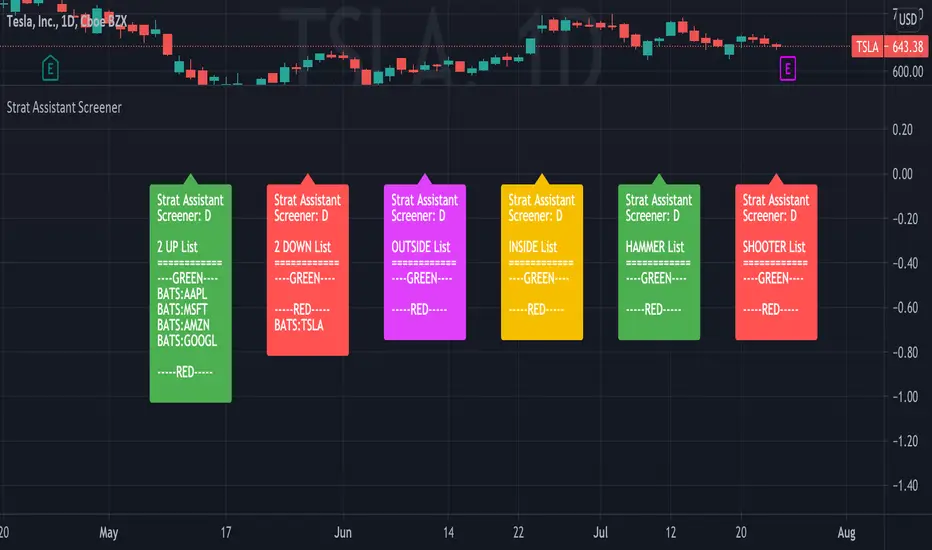
The following plots are displayed in data window mode. These plots are used in Pine Screener for filtering symbols based on the presence of patterns.
Bullish (Awaiting Entry) : Plots 1 if there is a bullish pattern awaiting entry
Bullish (In Trade) : Plots 1 if there is a bullish pattern that has reached Entry and in trade.
Bearish (Awaiting Entry) : Plots 1 if there is a bearish pattern awaiting entry
Bearish (In Trade) : Plots 1 if there is a bearish pattern that has reached Entry and in trade.
🎲 Detailed Input Parameters
The indicator offers extensive customization through grouped inputs. Here's a breakdown:
🎯 Zigzag Parameters :
Use Close Prices (bool, default: false): Switches zigzag to use close prices for pivots, reducing sensitivity to wicks.
Length (int, default: 8, min: 3): Minimum bars between pivots; higher values filter more noise but may miss small patterns.
Depth (int, default: 100, max: 500): Maximum pivots stored; affects recursive zigzag levels and performance.
🎯 Generic Settings
Base (string, default: 'correction'): Determines the wave (impulse/correction) used for target projections. Options include 'min'/'max' for conservative/aggressive targets, or 'AD'/'CD' for specific legs.
Error Percent (int, default: 8, 0-20): Tolerance for ratio matches; lower = fewer but more accurate patterns.
Strict Ratio Scanning Mode (bool, default: false): Enforces exact ratios without error buffer for varying ranges.
Log Scale (two bools): Separate toggles for scanning patterns vs. projecting targets.
🎯 Trade Settings
Stop/Entry/Target (floats): Ratios for trade levels (stop=0.0 default, entry=0.3, target=0.618). Stop at 0.0 means no stop (use with caution); entry/target based on PRZ extension.
🎯 Display Settings
Draw (bool, default: true): Enables pattern drawings. When running in pine screener, this can be turned off
Theme (enum, default: DARK): Auto-generates colors (light/dark shades); or CUSTOM with 22 user-defined colors.
XABCD/Ratios (bools, default: true): Show/hide pivot labels and ratio annotations.
Label Size (string, default: small): Size for on-chart labels (tiny to huge).
🎲 Using with Pine Screener
Pine Screener is a powerful tradingview utility that allows users to build complex programmable screeners using Pinescript®. This script is designed in an optimized way in order to work with Pine Screener. Hence, the display of the indicator is limited. In order to use this script with pine screener, we need to follow these steps.
Prepare your watchlist
Pine screener works on a watchlist with less than 1000 symbols in them. We can use built-in tradingview screeners to perform initial screening based on broad categories. This can be as simple as filtering based on market cap. This initial filtering is only required if the number of symbols are more than 1000.
Load the watchlist and indicator to pine screener
Go to screener menu and load Pine Screener.
Once done, load the watchlist and indicator. Set filtering criteria, timeframe and indicator settings. And then press Scan to filter the symbols that match given criteria.
For more details, please watch the video published under the below idea.
Skrip berbayar