[Opening Range pre-Market Breakout Screener] with Alerts (TSO)=
with Alerts (TSO)
===========================================================================
===========================================================================
This Opening Range/pre-Market breakout screener lets you monitor up to 10 symbols/instruments simultaneously (9 plus the one currently displayed on the chart). It provides alerts when the price breaks out of the pre-market range, offering two options: 1) Immediate alerts as the breakout happens with the live bar, and 2) Alerts after the bar closes. The screener also labels breakouts on the chart and offers live status updates in the stats table. The Opening Range/pre-Market area is fully customizable, with a default setting optimized for US stock market pre-market hours (07:00 am-09:30 am ET). Additionally, you can set the Active Trading Session Schedule to define specific intraday periods when breakouts and alerts will be displayed.
What sets this indicator apart from other ORB indicators is its integrated screener for multiple symbols and an IMMEDIATE alert/status feature that notifies you the moment the price breaks through the pre-market range. Moreover, it can be used worldwide as it includes an active trading session schedule for every trading region globally!
===========================================================================
Explanation of all the Features/Inputs/Settings
---------------------------------------------------------------------------
>>> This is where the desired symbols can be turned on/checked to be screened for ORB breakout - the selected/checked symbols at creation of a 'Any alert() function call' alert will alert on any of the selected/checked symbols.
>>> Active Trading Session Hours, this is where Active Trading Session Hours can be setup during which breakouts will be shown on chart/table and alerts will trigger. Every trading region is included, by default it's set to a regular US trading session: 09:30am0-4:00pm ET.
>>> ORB Breakout Config is where the desired breakout approaches can be shown/alert turn on. Closed Bar Breakout: means that a breakout is considered as occurred only when a candle bar is fully closed. Live Breakouts: a breakout occurs immediately at price breakout thru pre-Market range, while candle bar is still open.
>>> Final section is simply the stats table location.
===========================================================================
Adding Alerts in TradngView
---------------------------------------------------------------------------
1) Consolidation alert(s) for the selected/checked symbols
- Select/check/find the desired symbols/instruments (when selecting symbols, make sure - they are from correct BROKER/SOURCE as pricing may differ between different brokers, causing confusion (under 1 broker/source, the symbol will be consolidated, under another it will not...))
-Right-click anywhere on any TradingView chart
-Click on Add alert
-Condition: Select this indicator by it’s name
-Immediately below, change it to "alert() function calls only"
-Expiration: Open-ended (that may require higher tier TradingView account, otherwise the alert will need to be occasionally re-triggered)
-Alert name: Anything
-Hit “Create”
-Note: If you change ANY Settings within the indicator – you must DELETE the current alert and create a new one per steps above, otherwise it will continue triggering alerts per old Settings!
* Once alert triggers, don't get confused, as it will show "Alert on SYMBOL", the SYMBOL will be where you created the major alert for all the symbols within the screener list! Within the alert, on the bottom, it will say: "SPY - LONG Breakout - Live" - this is where the correct symbol is for which the alert for consolidation was triggered!
===========================================================================
If you have any questions or issues with the indicator, please message me directly via TradingView.
---------------------------------------------------------------------------
Good Luck! (NOTE: Trading is very risky, past performance is not necessarily indicative of future results, so please trade responsibly!)
Cari dalam skrip untuk "screener"

BEST RSI Divergences Screener (Regular and Hidden)Hello traders
My way to fight this situation is to stay productive.
Hope some of my scripts will help you out as most of us are locked-down at home, hence have more time for trading - and preparing ourselves when the sun will shine on us again
I - Concept
This is an upgrade of this script which captured only the regular divergences
This screener detects whether the regular RSI divergences based on the TradingView Divergence built-in indicator (made by the gentleman @everget I believe)
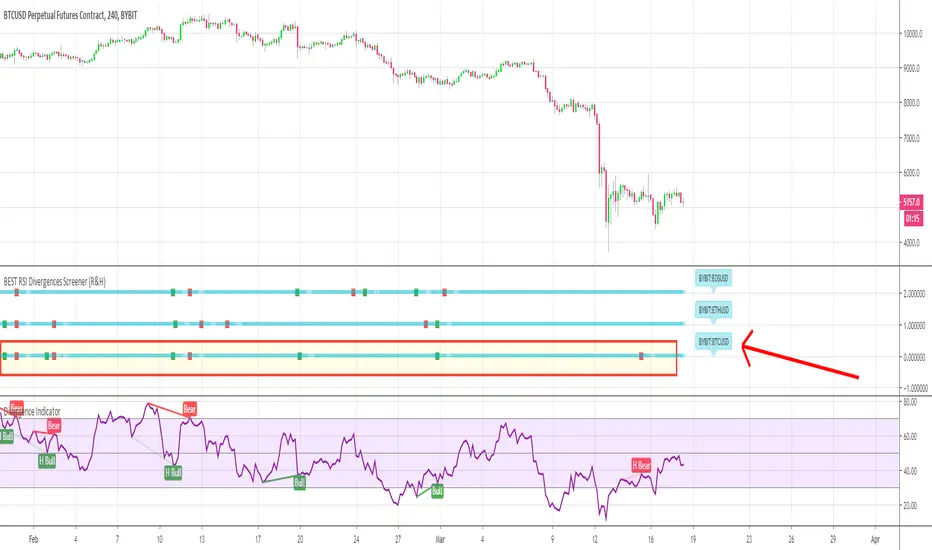
With this screener, you can see in 1 view which of your favorite cryptos/stocks/forex pairs/etc. showing strong regular and hidden divergences
The gentlemen (and demoiselles) traders can play with the lookback/ranges inputs to adjust the divergences based on what they think is best of their trading/timeframe/instrument/life
On that script screenshot, I'm showing the BYBIT:BTCUSD part of the screener matching with the divergences on the chart
II - How did I set the screener
The visual signals are as follow:
- square: whenever a regular or hidden divergence is detected
Then the colors are:
- green when there is bullish divergence
- red when there is bearish divergence
🔔🔔 I also added the alerts for capturing those bullish/bearish divergences
III - Does it repaint?
It should not :)
Best regards
Dave
Engulfing Screener - Set 4Customized version of Best Engulfing Screener
This is part 4/4 that will allow you to monitor all Majors and their respective pairs, 28 pairs in total.
Simply add the following scripts to any one chart, and you may leave open to monitor all 28 pairs for Engulfing .
Engulfing Screener - Set 1
Engulfing Screener - Set 2
Engulfing Screener - Set 3
Engulfing Screener - Set 4
How to use:
Once all four scripts are added to a chart, you find the UP and DOWN arrows, which represent a bullish or bearish engulfing . Look at the bearish candles, and compare to CSM to see if it is in line with Red and Green. If EURUSD has an UP arrow, and you CSM shows EUR is green and USD is red, it is a valid candle. Then open that chart and see if there is a valid entry based on the price action.

Engulfing Screener - Set 3Customized version of Best Engulfing Screener
This is part 3/4 that will allow you to monitor all Majors and their respective pairs, 28 pairs in total.
Simply add the following scripts to any one chart, and you may leave open to monitor all 28 pairs for Engulfing .
Engulfing Screener - Set 1
Engulfing Screener - Set 2
Engulfing Screener - Set 3
Engulfing Screener - Set 4
How to use:
Once all four scripts are added to a chart, you find the UP and DOWN arrows, which represent a bullish or bearish engulfing . Look at the bearish candles, and compare to CSM to see if it is in line with Red and Green. If EURUSD has an UP arrow, and you CSM shows EUR is green and USD is red, it is a valid candle. Then open that chart and see if there is a valid entry based on the price action.

Engulfing Screener - Set 2Customized version of Best Engulfing Screener
This is part 2/4 that will allow you to monitor all Majors and their respective pairs, 28 pairs in total.
Simply add the following scripts to any one chart, and you may leave open to monitor all 28 pairs for Engulfing.
Engulfing Screener - Set 1
Engulfing Screener - Set 2
Engulfing Screener - Set 3
Engulfing Screener - Set 4
How to use:
Once all four scripts are added to a chart, you find the UP and DOWN arrows, which represent a bullish or bearish engulfing. Look at the bearish candles, and compare to CSM to see if it is in line with Red and Green. If EURUSD has an UP arrow, and you CSM shows EUR is green and USD is red, it is a valid candle. Then open that chart and see if there is a valid entry based on the price action.

Engulfing Screener - Set 1Customized version of Best Engulfing Screener
This is part 1/4 that will allow you to monitor all Majors and their respective pairs, 28 pairs in total.
Simply add the following scripts to any one chart, and you may leave open to monitor all 28 pairs for Engulfing.
Engulfing Screener - Set 1
Engulfing Screener - Set 2
Engulfing Screener - Set 3
Engulfing Screener - Set 4
How to use:
Once all four scripts are added to a chart, you find the UP and DOWN arrows, which represent a bullish or bearish engulfing. Look at the bearish candles, and compare to CSM to see if it is in line with Red and Green. If EURUSD has an UP arrow, and you CSM shows EUR is green and USD is red, it is a valid candle. Then open that chart and see if there is a valid entry based on the price action.

Oscillator Matrix ScreenerOscillator Matrix Screener
Oscillator Matrix Screener is a multi asset, multi timeframe dashboard that lets you quickly compare momentum, money flow, and exhaustion conditions across up to 10 symbols in a single table. It is designed as a visual screener so you can spot strength, weakness, reversals, and confluence at a glance without flipping charts.
Core Logic
For each enabled ticker and timeframe the script calculates:
Money Flow
Uses MFI to estimate buying vs selling pressure relative to volume and price movement.
HyperWave Oscillator
Uses RSI to classify the market into regimes such as Overbought Down, Oversold Up, and intermediate up or down states.
Overflow Oscillator
Uses Stochastic to show how extended price is within its recent range.
Reversal Signals
Detects potential bullish and bearish reversal events using RSI crossovers around key zones.
Strong Reversal Up
Reversal Up
Strong Reversal Down
Reversal Down
Divergence
Flags simple bullish or bearish divergence between price and RSI.
Composite Rating and Confluence
Combines multiple components into a single rating:
Strong Bullish
Bullish
Neutral
Bearish
Strong Bearish
That rating is then translated into a confluence label such as Strong, Weak or Mixed to summarize overall pressure.
Table Layout
All results are displayed in a compact table:
Ticker
Last price
Volume
Percent change from the current daily open
Absolute change from the current daily open
Rating
HyperWave signal text
Money Flow value
Overflow value
HyperWave value
Reversal status
Divergence status
Confluence status
Rows alternate background colors for readability, and key cells use context based coloring. For example:
HyperWave cell background shifts between red and green families depending on overbought or oversold states.
Percent change and change columns are green for positive moves and red for negative moves.
Bullish and bearish conditions use distinct color accents so you can scan quickly.
Filters and Controls
You can tailor what appears in the table with several filters:
Rating Filter
Show only symbols that match a chosen rating band such as Strong Bullish, Any Bullish, Bearish, or Strong Bearish.
Money Flow Filter
Restrict results to Money Flow values above, below, or very close to a chosen level.
Ticker and Timeframe Selection
Enable or disable up to 10 tickers, each with its own timeframe input. Examples of lists could be any of these for example:
Same symbol across multiple timeframes
A watchlist of different symbols on the same timeframe
Mixed layout that matches your personal workflow
Display Settings
Choose table position, text size, background and header colors to fit your chart layout.
How to Use
Add your preferred tickers and timeframes.
Optionally apply rating or money flow filters to focus on only the strongest or weakest setups.
Use the table as a top down scanner to:
Find symbols with strong bullish or bearish confluence.
Spot reversals that align with oversold or overbought zones.
Identify divergence backed by supportive money flow or overflow readings.
Oscillator Matrix Screener is intended as a decision support tool. It does not generate direct buy or sell signals by itself. Always combine it with your own technical knowledge and risk mitigation skills

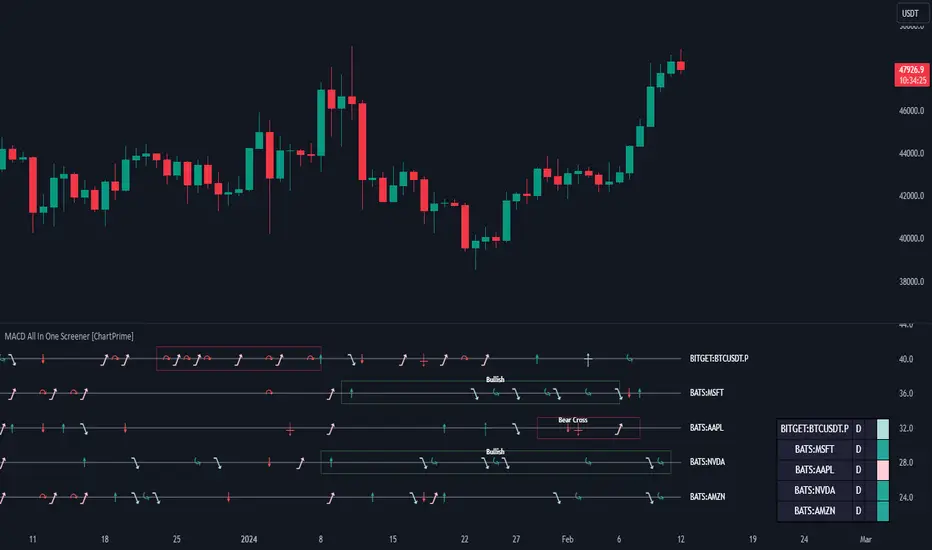
MACD All In One Screener [ChartPrime]INTRODUCTION
MACD All In One Screener (ChartPrime) is a multi instrument, multi timeframe indicator designed to provide traders with a comprehensive solution to monitoring the market. This indicator is designed to be easy to use and visually appealing while also being highly flexible and feature rich. Users can pick up to 10 symbols not including the chart's symbol and set up alerts for many different signals that the MACD produces. One standout feature of this indicator is its ability to display not only each symbol individually as a MACD but you can also view its chart from within this indicator. This removes the need to flip between symbols to see the price action for your basket.
On top of that we have designed this indicator to be friendly with "indicator on indicator" by providing outputs for all of the standards of price that users may want. Included is an overview section that shows all of the symbols signals symbolically over time. Additionally we have included a table for easy monitoring. This table includes the symbol, its timeframe, the current alert, and its histogram state. To make things as user friendly as possible we have also included rich error handling that tells you exactly what is wrong with your configuration.
HOW TO USE
To use this indicator, simply add it to your chart and navigate to the settings. From there select the symbols you want to monitor and the timeframes you want to use. Next you want to navigate down to the alerts section to select the what alerts you want to receive, and what symbols you want to get alerts for. Finally, you wan to create your alert using "Any alert() function call". Now your screener is all set up!
OVERVIEW OF INPUTS
View allows you to select what the indicator currently displays. You can pick from any one of the selected symbols, an overview of all of the symbols, or simply nothing. If you want to only use the table, "None" is provided so you can move the indicator into the chart panel.
View Toggle lets you pick from displaying the MACD for the selected symbol or the Price Action as a candle chart. To see your "indicator on indicator" you will have to select a symbol from the view list. There is a bug where if you select "Overview" while you are using "indicator on indicator" your added indicator will see the last symbol you viewed. To fix this, simply change the setting of your overlaid indicator and it will correct its self.
History Length is the number of historical bars to calculate over. This feature is here to prevent the indicator from breaking due to uneven historical data between the symbols.
Show Price Line toggles a dotted line that follows the current symbols closing price when "Price" is selected under the "View Toggle" dropdown.
Show Symbol Label toggles a label that displays the current symbols name and timeframe. This only impacts the single symbol view.
Overview Label Color adjusts the color of the symbol labels for both overview and single symbol view.
MA Type lets you pick what kind of moving average you want to use for the oscillator or signal. You can pick from the standard SMA or EMA.
Fast Length is a standard input for MACD. This lets you pick the period of the fast MA.
Slow Length , just like Fast Lenght, is a standard input for MACD. This lets you pick the period of the slow MA.
Signal Length is another standard input for MACD. This lets you configure the period of the signal MA.
MACD Cross Overlay Icon is a toggle to display MACD crosses when viewing a single symbol's MACD. When the MACD has a bullish cross it will plot a bullish dot, and when it has a bearish cross it will plot a bearish dot. This is purely visual.
Regular Bullish and Bearish toggles the visual display of the divergences on the single symbol view. This does not effect the indicators ability do send alerts.
Divergence Look Right adjusts the number of bars into the future to look for confirmation of a signal. This directly impacts lag but enhances stability.
Divergence Look Left adjusts the number of bars into the past to check for a signal. A longer period will filter out smaller moves
Maximum Lookback adjusts the maximum size of a divergence.
Minimum Lookback adjusts the minimum size of a divergence.
Divergence Drawings picks how you want to visualize the divergence. You can pick from displaying it as a line, a label, or both.
Enable Table toggles the overview table. When enabled it will show you the enabled symbols and their current state. From left to right: symbol name, timeframe, current alert, and histogram state.
Position picks where on the chart you want the table to be.
Text Color adjusts the text color of the table.
BG Color adjusts the background color of the table.
Frame Color adjust the frame color of the table.
Current Symbol Time Frame adjusts the timeframe of the chart's symbol.
Symbol 1 - 10 pick "Symbol's" symbol and timeframe. To use higher timeframes, the symbol's have to be the same type. You can't have a crypto and a stock using HTF at the same time as they don't have the same sessions and will result in an error. You can use unsafe mode (as described below) to potentially get around this.
Enable Symbol when enabled it will give you alerts for the symbol. This also enables the symbol in the overview. If this is disabled it won't send alerts, and it will not show up in overview, or the table.
Wait for Close enables waiting for the bar to close before printing an alert.
Alert Symbol Size picks what size you want the overview symbols to be.
Enable Cross Over 0 Alert: MACD crosses over the 0 line.
Enable Cross Under 0 Alert: MACD crosses under the 0 line.
Enable MACD Cross Bullish Alert: Bullish MACD cross.
Enable MACD Cross Bearish Alert: Bearish MACD cross.
Enable Histogram Bullish Turn Alert: MACD begins to turn bullish but hasn't crossed.
Enable Histogram Bearish Turn Alert: MACD begins to turn bearish but hasn't crossed.
Enable Histogram Bullish Continuation Alert: MACD is in a bullish cross state and it was declining but began rising again.
Enable Histogram Bearish Continuation Alert: MACD is in a bearish cross state and it was rising but began falling again.
Enable Bullish/Bearish Divergence Alert enables divergence alerts. Divergences are lagging, especially on a higher timeframe. These alerts will also tell you the time in the past when the divergence occurred.
Color Section is provided to allow for personalization of the indicator. Everything can be adjusted here.
Disable Error Checking: Only enable this if you want to bypass the built in error checking. This will enable 'Safe Requesting'. Safe Requesting will only request enabled symbols and you will not be able to view symbols that are not enabled in this mode. Only use this if you want to mix symbol types and you know it will work. (An example would be viewing stocks and SPY at the same time.)
CONCLUSION
The MACD All In One Screener (ChartPrime) is a versatile indicator designed to monitor multiple symbols across various timeframes. The flexibility in customization, from MACD settings to visual alerts and table presentations, allows users to tailor the screener to their needs and preferences. We hope you find this as useful and interesting as we do and wish you good luck in the market!
Enjoy
Ultimate Volume Custom ScreenerThis indicator will allow you to make your custom volume TradingView screener without coding. Add it to the chart, and select up to 40 symbols and up to five indicators. The screener will do the rest for you. The indicator will form a lovely table with all values and highlighted signals. It allows also to filter symbols based on the values of indicators and sends results as an alert.
The screener is highly customizable, and you can choose its position on the chart, sorting, order of the columns, colors for the tables, and all signals separately. You can easily change parameters for all supported indicators.
Supported indicators
Currently, there are 15 different custom indicators available. Current list of indicators:
Accumulation/Distribution (Acm/Dst)
Chaikin Money Flow (CMF)
Ease of Movement (EOM)
Klinger Oscillator (KO)
Money Flow Index (MFI)
Negative Volume Index (NVI)
On Balance Volume (OBV)
Positive Volume Index (PVI)
Price
Price-Volume Trend (PVT)
Volume
Volume MA (VMA)
Volume Percentile (V-Prct)
Volume RSI (V-RSI)
Volume Weighted Average Price (VWAP)
We're already working on adding a few more supported indicators. If you have any ideas about the indicators you want to see in our screener, contact us, and we'll consider them.
Filters
You can combine up to 5 filters on all selected indicators.
This will split the screen table into two parts. The top one will contain symbols that satisfy all conditions:
Alerts
You can also create an alert and receive a filtered symbol at the end of every bar.
Disclaimer
Please remember that past performance may not be indicative of future results.
Due to various factors, including changing market conditions, the strategy may no longer perform as well as in historical backtesting.
This post and the script don’t provide any financial advice.

FSS Multi-Coin Screener 2.0 -- by @FlokicryptoFSS Multi-Coin Screener is built so that the user can scan the target timeframe quickly to see on which coins FSS Buy or Sell signals have shown up in the last closed candle or is currently printing on the real-time candle. As opposed to the FSS Indicator MTF Screener which scans multiple timeframes. This saves both the time and effort of having to browse through multiple coin pairs or stocks. By using this script the user will be able to quickly screen through the table and read what the FSS indicator is telling, without touching switching the ticker. Its uniqueness and originality is tightly related to its tandem work with the FSS Indicator (You can find the description of this indicator below).
Above you can see Bitcoin printed on the chart 3 candles prior, and several FSS buy signals on the table below the chart. *I am using low timeframes for the chart because I could not find any current signals on higher timeframes.
Below you can see Buy signals on multiple coins in the table, and on the chart a 5 min buy signal on APEUSDTPERP (which is not even in the table).
** The format of the table, cells and text can be changed without notice, but it is my plan to make as many things as possible with regards to the table, editable by the user in the long term.
About the FSS Indicator:
This FSS Indicator script (which is included within this screener) is unique not only in that it removes the need for the user to run each of these indicators individually; it provides an ‘at-a-glance’ summary of the aggregate indicator data, while also providing the user a simultaneous recommended stop loss value based on past market behavior for the given asset and the user's tolerance to risk by editing the ATR Multiplier in the inputs.
The basic concept of the script is to apply past data to present market conditions, and through the use of that data, provide an additional confluence/confirmation signal which simultaneously provides a recommended stop loss value based on average true range (ATR).
The FSS Indicator uses a blend of :
RSI: If within a defined RSI range, increments print score.
MACD: trend and crossovers increment print score.
Histogram: increments print score if a trend of X candles is up or down.
21 EMA: Increments print score if price is above/below 21EMA.
Parabolic SAR: Increments print score if price is above/below Parabolic SAR .
These parameters generate a print score, which is then determined to be sufficient or not to print a LONG or a SHORT signal on the candle.
The indicator isn't built to find bottoms or tops, won't trigger 100% of the time, but should see a high success rate when triggered on higher timeframes. After testing on several pairs/tickers ( Bitcoin , Ethereum , XRP, DJI, SPX and others) on multiple timeframes I have seen the best results on 12-hour, Daily, 2-day, 3-day & weekly timeframes. The success criteria are as follows: Stop Loss not hitting before a rise of at least 10% in value for a long, or a loss of at least 10% in value for a short; waiting until the signal-candle closes for confirmation and back testing.
**Disclaimer: The recommendations of the Indicator/Screener are the result of back-tests and past results will never guarantee future performance of this script on any chart.**

Watchlist Screening Hammer & Engulfing Strategies [By MUQWISHI]A trading strategy screener is an idea of a visual alert for those who're trading particular strategies and facing a lack of capability of monitoring many symbols simultaneously, so this kind of tool could be more efficient to keep managing trading plans smoothly and quickly. I developed this screener as an idea more than providing legend strategies.
This screener indicator performs scanning 4 different strategies with customizable 10 symbols inputs, and 5 min is the preferable timeframe.
Strategies
1. Hammer at Low of the day.
2. Shooting Star at High of the day.
3. Bull Engulfing at Low of the day.
4. Bear Engulfing at High of the day.
Screener Overview
Disclaimer
I'm an amateur, and I'm not a qualified licensed investment advisor.
I don't recommend the use of showing signals as a sole means of trading decisions.

Optimized Trend Tracker STRATEGY & SCREENEROptimized Trend Tracker - OTT STRATEGY & SCREENER screens the BUY and SELL signals (trend reversals) for 20 user defined different tickers in Tradingview charts.
Simply input the name of the ticker in Tradingview that you want to screen.
Terminology explanation:
Confirmed Reversal: OTT reversal that happened in the last bar and cannot be repainted.
Potential Reversal: OTT reversal that might happen in the current bar but can also not happen depending upon the timeframe closing price.
Downtrend: Tickers that are currently in the sell zone
Uptrend: Tickers that are currently in the buy zone
Screener has also got a built in OTT indicator which users can confirm the reversals on graphs.
Screener explores the 20 tickers in current graph's time frame and also in desired parameters of the OTT indicator.
Also you can optimize the parameters manually with the built in STRATEGY version.
Optimized Trend Tracker indicator :
Built in Moving Average type defaultly set as VAR but users can choose from 8 different Moving Average types like:
SMA : Simple Moving Average
EMA : Exponential Movin Average
WMA : Weighted Moving Average
TMA : Triangular Moving Average
VAR : Variable Index Dynamic Moving Average aka VIDYA
WWMA : Welles Wilder's Moving Average
ZLEMA : Zero Lag Exponential Moving Average
TSF : True Strength Force
Tip: In sideways VAR would be a good choice
You can use OTT default alarms and Buy Sell signals like:
1-
BUY when Prices are above OTT
SELL when Prices are below OTT
2-
BUY when OTT support Line crosses over OTT line.
SELL when OTT support Line crosses under OTT line.
3-
BUY when OTT line is Green and makes higher highs.
SELL when OTT line is Red and makes lower lows.
IMPORTANT: SCREENER ONLY EXPLORES AND SCREENS FOR THE 2nd SIGNAL TYPE:
BUY when OTT support Line crosses over OTT line.
SELL when OTT support Line crosses under OTT line.

trend Screener List1This is type of custom screener I searched and made to screen bulk stocks any one can modify it, other may get help out of it.
in my code i have made defined
1. uptrend= ema(close,55)> ema(close,144) and ema(close,144)> ema(close,388) and ema(close,388)> ema(close,576) and close>ema(close,388)
2. downtrend = ema(close,55)< ema(close,144) and ema(close,144)< ema(close,388) and ema(close,388)

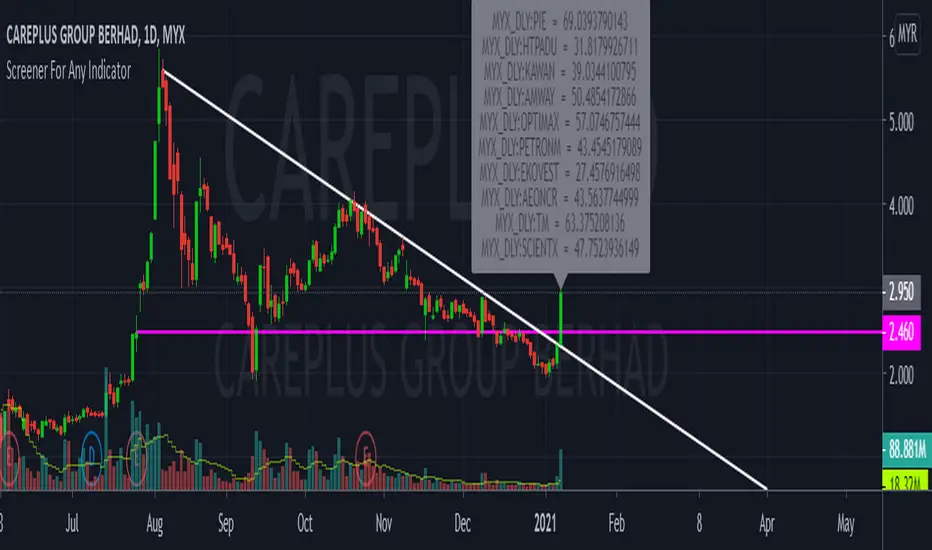
CustomScreenerTo apply your indicator with screener , please modify the section which i mention "Start your indicator pine script" & "End your indicator pine script"
At the pinescript section you will able to change the ticket symbol .
I only able to show screener result with 10 item in 1 times . To view more result, please go to setting and change stock list "1-10">"11,20">"21-30".....
Able to screener 100 items with this indicator.
Kindly change the exchange and stock in the pinescript according your watchlist.
As examples, my indicator is to determine the stock in which trend, i want to find out all stock with aqua color trend
The screener result show only 9 of 10 are in aqua color trend.
Liquidity Structure Screener [Z-Score Sniper] "Stop guessing where value is. Start seeing the structure."
This indicator is an institutional-grade screener designed to visualize Liquidity Structure across up to 30 tickers simultaneously. It moves beyond standard support and resistance by using Auto-Anchored VWAPs and Volume Nodes to identify exactly where "Smart Money" is defending, trapped, or exhausted.
Core Concepts
This screener builds a dynamic "Liquidity Geometry" for every ticker on your watchlist based on the last 60 days (adjustable) of price action:
The "Whale" Level: Automatically detects the single highest-volume day in the lookback period and anchors a VWAP from that exact candle. This is the "Line in the Sand" for the market's biggest participant.
Market Structure Anchors:
Shorts (High Anchor): VWAP anchored from the highest high. Represents the average entry of short sellers (Resistance).
Longs (Low Anchor): VWAP anchored from the lowest low. Represents the average entry of buyers (Support).
Z-Score Sniper: Calculates how far price has stretched from the Short Anchor using ATR-normalized Standard Deviations. This detects extreme "rubber band" extensions for mean reversion plays.
How to Read the Signals
The screener processes this complex data into a simple SIGNAL column with actionable color-coded states:
🔵 DEFENSE LONG (The Fortress): Price is in the "Whale Zone" or "Squeeze" AND holding near the Long Anchor support (within 5% buffer). This indicates relative strength and active institutional defense.
🟢 BUY RETEST: Price has broken out above the Short Anchor (Resistance) and is dipping back to retest it. A classic "Resistance-to-Support Flip" entry.
🟠 COIL (The Pinch): Volatility is dead. Price is trapped tightly between the Whale Level and the Short Anchor (< 0.5% distance). A massive expansion move is imminent.
🟣 OVERSOLD: Price is in a breakdown but has stretched to an extreme statistical deviation (Z-Score < -3.0σ). Sellers are exhausted, signaling a potential "Dead Cat Bounce" or reversal.
🔴 AVOID: Structure is broken (below Long Anchor) with no statistical exhaustion. The floor is gone—do not catch the falling knife.
Key Features
30-Ticker Watchlist: Monitor your entire portfolio in one panel.
Smart Deduplication: Automatically cleans duplicate tickers from your inputs.
Customizable Lookback: Adjust the "Anchor Memory" to fit your trading style (Swing vs. Position).
Visual Heatmap: Color-coded zones for instant readability of market health.
Disclaimer: This tool provides structural analysis, not financial advice. Always use proper risk management.

Seasonality Screener Best Long & Short Patterns Auto-ScanThe Seasonality Screener automatically scans a market’s history to find the most profitable seasonal patterns in the days ahead.
It searches for both long and short setups and shows you the two best patterns based on historical performance.
For each pattern, the screener looks back over past years and calculates:
Average return
Hit rate (win rate)
Winning years vs. total years
The results are displayed in a compact on-chart table with:
Entry date & exit date (calendar days)
Pattern length
Average return & hit rate
Win/trade count
Optionally, the indicator can also draw highlighted boxes in the chart’s history for the selected long and/or short pattern, so you can visually inspect how the seasonal window performed in each year.
You can:
Define how far ahead the screener should look (e.g. next X days),
Control the minimum and maximum pattern length,
Choose how many years of history to use,
And filter by simple regimes such as US election cycle years.
Internally, all calculations are based on daily data, so the seasonal analysis has to be done on the daily timeframe.
This tool is designed as a research and idea generator for seasonal tendencies and should be used together with your own risk management and trading plan.

Donchian 20/10 Screener + Alerts Donchian 20/10 Screener + Alerts identifies stocks breaking their 20-day high.
Includes ADX trend filter to confirm strong momentum.
Plots Donchian high/low lines and marks BUY/SELL signals on chart.
Screener output shows “PASS” for stocks meeting entry criteria.
Supports alerts for entry, exit, and screener signals for easy monitoring.

VWAP and IVP Volatility Screener AlertVWAP and IVP Volatility Screener Alert is a multi-asset, institutional-grade market scanner that combines Auto-Anchored VWAP, Implied Volatility Percentile (IVP), Choppiness Index, Strike Price Structure, and Volume Profile (POC / Value Area) to generate high-probability trade signals across multiple symbols.
Designed for traders who rely on volatility regimes, VWAP interactions, trend confirmation, and strike-based price behavior, this tool automatically evaluates up to 10 assets simultaneously and displays actionable BUY/SELL conditions in a unified dashboard and screener panel.
Key Features
1. Multi-Asset Screener (10 Symbols)
Scans FX, indices, commodities, and metals. Displays RSI, ADX, trend, score, volatility regime, VWAP/POC/Value Area position, IVP, and Choppiness. Custom strike increments per asset.
2. Auto-Anchored VWAP System
Auto anchors by Session, Day, Week, Month, or Auto. Includes VWAP bands and bounce detection to show when price is Above, Below, or interacting with VWAP.
3. Volume Profile + POC / Value Area
Generates intraday/session POC, VAH, and VAL. Detects breaks, retests, and bounce signals.
4. IV Percentile (IVP) Engine
Converts realized volatility into IVP and classifies regimes (EXT.HI → EXT.LO). Supports Favorable, Extreme, and High-Volatility modes for different trading styles.
5. Choppiness Index (CHOP)
Identifies trending vs ranging conditions and feeds directly into scoring and alerts.
6. 11-Criteria Alert System
Alert logic includes RSI, ADX, trend, volume, VWAP, POC/VA, strike proximity, std-dev breaks, IVP, CHOP, and score thresholds. Supports Score-Based or Multi-Criteria modes.
7. Price-to-Strike Mapping
Rounds price to the correct strike ladder, detecting reversals, continuation, breakout levels, and helping frame stop-loss/TP zones.
8. Session-Aware Filtering
Filters signals for Asian, London, and NY sessions with custom timezone support.

Top 20 Screener📘 Indicator Description: I Top 20 Screener
Name:
Top 20 Screener
✅ 1. Features
This screener is designed to monitor and evaluate up to 20 selected IDX (Indonesia Stock Exchange) stocks using technical indicators. It offers a compact and visual table on your chart.
🔧 2. How to Use
Apply the Indicator
Add the indicator to your TradingView chart.
Make sure the timeframe and chart symbol are set correctly (usually apply it to any chart, as it requests data from the 20 symbols independently).
Choose Stocks to Screen
Under the “Symbols” section, check the stocks you want to include (default includes all 20).
Use the Filter Panel (Optional)
Turn on "Filter Enabled".
Choose a Filter Column (e.g., MACD > 0).
Set the "From" and "To" values to filter conditions (e.g., From = 1, To = 1 to show only MACD-positive stocks).
Interpret the Table
Each row shows one stock and its current technical status based on the selected indicators.
Green backgrounds mean bullish signals.
Red or gray indicate bearish or neutral.
📝 3. Remarks
This script uses request.security() to fetch external symbol data — it may lag slightly or be restricted in real-time depending on your plan.
Customizable Symbol List: You can edit the list to monitor any other stocks (IDX or non-IDX).

FVGC — MTF ScreenerFVGC — MTF Screener (by Capital Complex)
Part of the FVGC Suite.
A compact, real-time dashboard that scans the 30s, 1m, 2m, and 3m timeframes for FVGC-compliant conditions—showing a green/red dot when a bullish/bearish setup is arming, and a green/red square when the setup confirms. Built to sit beside FVGC — Signals and FVGC — Visual Overlay so you can monitor multiple timeframes at once without clutter.
---
## What it does
Multi-TF heads-up display : Tracks 30s, 1m, 2m, 3m for valid FVGC criteria.
Clear state encoding:
* Dot = conditions are aligning (setup arming).
* Square = entry model confirmed (go/no-go).
Rule-true logic: Mirrors your FVGC rule set (tap/engulf/inversion and guardrails) so the screener matches what your Signals indicator would accept on each timeframe.
Noise control: Honors your Trading Windows to keep the screen focused on the session you actually trade.
---
## Why traders use it
Time compression: See four lower timeframes progress from “almost” to “confirmed” at a glance.
Discipline aid: Use the dot phase as a heads-up, and the square as the only moment you consider action—no more chart hopping.
Suite cohesion: Screener tells you when, Visual Overlay shows where, Signals defines how.
---
## Key features & options
Timeframes: 30s, 1m, 2m, 3m (fixed for clarity and speed).
FVGC-aligned filters: Honors your suite’s guardrails (e.g., IFVG/BOS logic, midpoint FTC checks, opposing-FVG 50% behavior, opening-range distance caps by TF).
Trading Windows aware: Optional pre-window arming visibility for early heads-up.
Readable UI: On-chart table/HUD with per-state colors (dot/square), custom text color control, and minimal footprint.
Timezone aware: Defaults to America/New_York to align with RTH and your other FVGC tools.
---
## Notes
Designed for index futures, indices, and liquid FX.
This is a visual scanner; it does not place orders. Pair with FVGC — Signals for your actual entry/management logic.
---
## Credits & suite
Capital Complex — FVGC Suite
© TheHiddenMarkets (code components)
---
## Disclaimer
This tool is for educational purposes only and does not constitute financial advice. Trading involves risk; do your own research and manage risk appropriately.

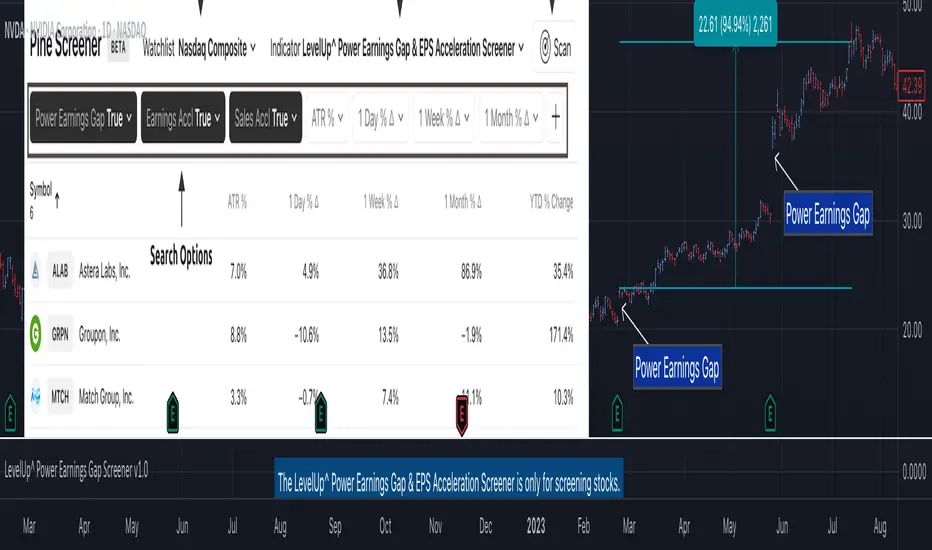
Power Earnings Gap Screener Pro [LevelUp]Customizable Pine Screener to scan for stocks with a Power Earnings Gap as well as accelerating earnings and sales. Historical analysis shows that strong earnings often trigger institutional buying, pushing prices higher and increasing the likelihood of sustained price gains.
🔹 Power Earnings Gap (PEG)
A power earnings gap refers to a significant price gap up after an earnings report, reflecting a rapid shift in investor sentiment and perceived value. It’s called "power" because the move is often sharp, sustained, and accompanied by high trading volume, signaling a potential trend continuation or reversal.
A gap is the difference between the closing price of a stock on the day before an earnings report and the opening price the next trading day. A power earnings gap typically exceeds a certain threshold (e.g., 8-10% or more) and is driven by earnings surprises, guidance changes, or other significant news.
Strong earnings beats, misses, or forward-looking guidance can trigger these gaps. For example, a company reporting higher-than-expected profits or raising guidance might gap up, while a miss or weak outlook could cause a gap down.
The gap is often accompanied by above-average trading volume, confirming the move's strength. Power gaps often lead to sustained price movement in the direction of the gap (continuation) or signal a reversal if the gap fills quickly.
How Power Earnings Gap Be Helpful
▪ Power earnings gaps often indicate strong momentum. Traders can capitalize on this by entering trades in the direction of the gap (e.g., buying on a gap-up if the trend continues).
Example: If a stock gaps up 10% after a stellar earnings report and shows high volume, traders might buy, expecting further upside as momentum builds.
▪ Breakout Opportunities: A gap through key technical levels (e.g., resistance or support) can signal a breakout. Traders use these gaps to identify potential long-term trends.
Example: A stock breaking above a resistance level on a power earnings gap may continue to rally, offering a setup for swing or position traders.
▪ Volatility for Short-Term Trades: Earnings gaps create heightened volatility, ideal for day traders or scalpers. The large price swings allow for quick profits if timed correctly.
Example: A trader might use options (e.g., calls for a gap-up, puts for a gap-down) to leverage the volatility around earnings.
▪ Confirmation of Fundamental Strength/Weakness: A power earning gap often reflects a fundamental shift, e.g., strong earnings growth or a major business development. Traders can use this to align technical setups with fundamental catalysts.
Example: A gap-up after a company raises its full-year guidance might signal a long-term buying opportunity.
▪ Risk Management and Stop Losses: Gaps provide clear levels for setting stop-loss orders. For instance, traders might place stops at or below the gap up bar low to protect against a potential reversal.
Example: If a stock gaps up from $100 to $110 and intraday hits a low of $105, a trader might set a stop at $105 or lower to limit downside risk.
▪ Gap Fill Strategies:Some traders bet on gaps filling, i.e., the stock returning to its pre-gap price. If a power earnings gap seems overextended (e.g., due to market overreaction), contrarian traders might short a gap-up or buy a gap-down, anticipating a pullback.
Example: A stock gaps up 15% but lacks volume or follow-through; a trader might short it, expecting the price to retreat.
🔹 Earnings and Sales Acceleration
Earnings and sales acceleration refers to the rate of growth in a company's earnings over consecutive quarters. It highlights companies that are not only growing but doing so at an accelerating pace, signaling improving financial health and operational momentum. This metric is derived from earnings reports, which detail a company’s financial performance.
Key Concepts
▪ Earnings Acceleration: When a company’s earnings per share (EPS) growth rate increases over time (e.g., EPS growth of 10% in Q1, 15% in Q2, 20% in Q3). It indicates improving profitability, often due to cost efficiencies, margin expansion and strong demand.
▪ Sales Acceleration: When revenue growth rates increase over time (e.g., revenue growth of 5% in Q1, 8% in Q2, 12% in Q3). This reflects rising demand for products/services and operational efficiency.
▪ Relation to Earnings Reports: Acceleration is calculated by comparing sequential quarter-over-year growth rates in earnings and sales, often highlighted in earnings reports or analyst commentary. It’s a sign of fundamental strength when both metrics accelerate together.
How It’s Helpful to Traders
▪ Identify High-Potential Stocks: Stocks with accelerating earnings and sales often attract investor attention, as they signal a company is outperforming expectations and gaining market share. This can lead to sustained price appreciation.
Example: A tech company reporting 20% EPS growth and 15% sales growth quarter-over-quarter may see bullish price action as investors bet on continued momentum.
▪ Momentum Trading Opportunities: Acceleration often fuels stock price momentum, especially post-earnings. Traders can ride these trends using technical setups like breakouts or pullbacks.
Example: A stock breaking above a key resistance level after reporting accelerating growth may be a buy signal for swing traders.
▪ Early Indicator of Breakouts: Companies with accelerating fundamentals are more likely to experience price breakouts, as institutional investors (e.g., hedge funds, mutual funds) pile in. Traders can use this to position early.
Example: A retailer with accelerating sales due to strong holiday demand might gap up post-earnings, offering a breakout trade.
▪ Confirmation of Fundamental Strength: Acceleration validates a company’s growth story, reducing the risk of investing in stocks with inconsistent performance. Traders can align technical trades with strong fundamentals.
Example: A biotech with accelerating sales from a new drug launch may sustain a rally, giving traders confidence in long positions.
▪ Volatility for Short-Term Trades: Earnings reports showing acceleration often lead to significant price gaps or volatility, creating opportunities for day traders or options traders.
Example: A trader might buy call options on a stock expected to report accelerating earnings, anticipating a sharp post-earnings move.
🔹 Power Earnings Gaps - Examples
🔹 Screening Features - Setting Your Search Criteria
Power Earnings Gap
▪ Search Range
How many bars back to search for Power Earnings Gaps, anywhere between 1 and 90 bars.
▪ Last Bar Only
Look only at the last bar for Power Earnings Gaps. This is useful when looking for PEGs when screening at the end of a trading day. Choosing this option, the Search Range will be ignored.
▪ Minimum Price % Gap Up From Prior Close
This is the minimum gap up percent change to be considered a Power Earnings Gap.
▪ Minimum Volume % Change Over Average
This is the minimum volume percent change, over the 50-day average volume, to be considered a Power Earnings Gap.
▪ Require Positive Surprise
Require a positive earnings surprise and the minimum percent change.
▪ Require Closing Range
To ensure the price action closed strong on the day, specify a preferred closing range as a percentage of the bar's daily range.
▪ Gap Up Bar
The gap up bar can be configured to require one of the following:
- Open Above Prior High - Ensures there is visible gap up from the prior bar.
- Low Above Prior High - Allows for intraday price action to go below the prior bar high.
- No Requirement
Earnings And Sales Acceleration
▪ Quarters of Acceleration
You can specify between 1 and 4 quarters of earnings and/or sales acceleration.
🔹 Installation And Usage
▪ Mark this indicator as a Favorite.
▪ Use the Pine Screener to search for stocks.
▪ Save the search results to a watchlist.
▪ View the watchlist in TradingView.
🔹 Note
▪ Risk of Reversals: Not all gaps sustain their direction. Over reactions can lead to gap fills.
▪ High Volatility: Earnings gaps can be unpredictable, requiring quick decision-making & discipline.
Skrip berbayar
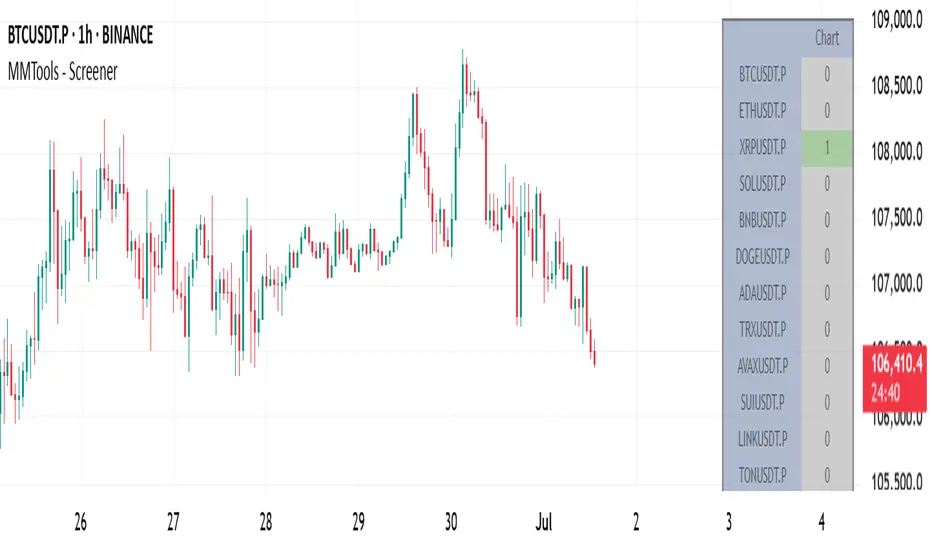
MMTools - Screener❖ Overview
Screener expands your market insights and provides an efficient way to monitor real-time signals from Catcher across hundreds of charts on a single screen.
Each cell in the table displays the number of indicator signals. For instance, a value of "1" in the row labeled ‘BTCUSDT.P’ and column ‘30’ indicates one long signal on the 30-minute Bitcoin chart within the selected lookback period. “0” means no signal in the lookback.
❖ Multi-Table Construction
Screener supports flexible layouts and overlays. To build a multi-table interface, simply add multiple instances of the script to your chart. For optimal usability, it is recommended to allocate a dedicated panel or tab.
⚙️ Key Parameters to Customize Initially
Indicator Lookback: Defines how far back Screener checks for signals.
Symbols: Choose up to 20 symbols. Use additional tables to expand coverage.
Size: Adjusts the overall dimensions of the table.
Display Settings: Customize colors, opacity, and symbol visibility. For dark theme charts, set color opacity to 100% and transparency to 0%.
⚙️ Per-Table Adjustable Parameters
Timeframe: This defines the interval for signal collection across all symbols displayed in the top row of the table. It must be equal to or greater than the chart’s timeframe, otherwise the script will deliberately trigger an error. For multiple tables, use a lower chart timeframe (e.g., 1 minute) to meet this requirement.
Table Positioning: Use either the “Position” (predefined screen locations) or “Block” (stacked layout) parameters. The “Block” method enables a greater number of tables by aligning them side-by-side efficiently.
-- Multi-table example demonstrating the use of the ’Position’ parameter --
-- Multi-table example demonstrating the use of the ’Block’ parameter --
❖ Access
Please refer to the Author's Instructions field to request access to the script.
-----------------------------------------------------------
Disclaimer
The information provided by my scripts is for informational purposes only and does not constitute financial advice. Past performance is not indicative of future results. Always do your own research before making financial decisions.
IPO Date ScreenerThis script, the IPO Date Screener, allows traders to visually identify stocks that are relatively new, based on the number of bars (days) since their IPO. The user can set a custom threshold for the number of days (bars) after the IPO, and the script will highlight new stocks that fall below that threshold.
Key Features:
Customizable IPO Days Threshold: Set the threshold for considering a stock as "new." Since Pine screener limits number bars to 500, it will work for stocks having trading days below 500 since IPO which almost 2 years.
Column Days since IPO: Sort this column from low to high to see newest to oldest STOCK with 500 days of trading.
Since a watchlist is limited to 1000 stocks, use this pines script to screen stocks within the watch list having trading days below 500 or user can select lower number of days from settings.
This is not helpful to add on chart, this is to use on pine screener as utility.