Correlation overlayThe script is intended to indicate when the correlation between VIX and VVIX gets below 0, on the selecteted security chart. It makes sense to plot it on indicies. This aims to present how the chart of a security looked like when the divergance between VIX and VVIX happened.
VIX CBOE Volatility Index

VIX Near-Term Futures CurveThis indicator provides a 3 day smoothed histogram expressing whether the near term VIX futures curve is in a state of contango or backwardation. The solid red/green bars express the spot vs front-month vs next month curve with the value being the cumulative point spread between them. The shaded overlay bars express the spread between the VIX spot index and front-month futures contract only.
This indicator is to be used on a 1 DAY interval or higher.

MOVE/VXTLT CorrelationMany know of the VIX for equity trading. Yet, many are unaware that there is the same kind of volatility measure for trading bonds, called the MOVE Index.
"The Merrill Lynch Option Volatility Estimate (MOVE) Index is a yield curve weighted index of the normalized implied volatility on 1-month Treasury options which are weighted on the 2, 5, 10, and 30 year contracts."
With this script one can see the the correlation and divergences between bonds and its volatility measure to make educated decisions in trading or hedging.
The idea of this script comes from NicTheMajestic.


VIX Implied Move Bands for ES/Emini futuresThis script uses the close of the VIX on a daily resolution to provide the 'implied move' for the E-mini SP500 futures. While it can be applied to any equity index, it's crucial to know that the VIX is calculated using SPX options, and may not reflect the implied volatility of other indices. The user can adjust the length of the moving average used to calculate the bands, the window of days used to calculate the implied move, and the multiplier that effects the width of the bands.

Vix SpikeThis script calculates spikes Vix tops and bottoms. The Vix Market Bottom is calculated using CM_Williams_Vix_Fix Finds Market Bottoms (Chris Moody). The Vix Market Top is calculated as the inverse of CM Williams’ formula.
The highest Vix Bottom and the highest Vix Top are averaged (over the Highest Vix Lookback period).
Buys are signaled when the Vix Bottom line crosses below the Highest Vix Average.
Sells are signaled when the Vix Top line crosses below Highest Vix Average.
BINANCE:ETHUSDT 5 min
BYBIT:XRPUSD 5 min

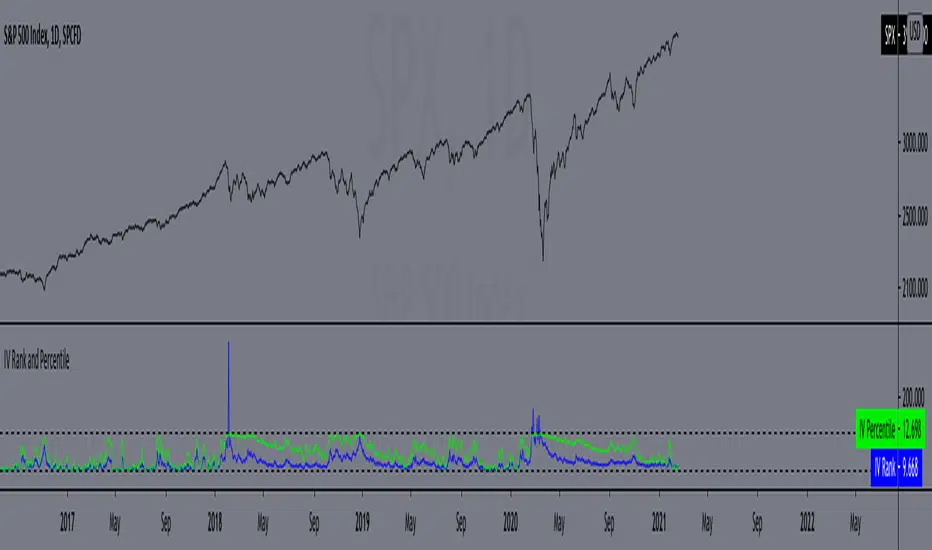
IV Rank and Percentile"All stocks in the market have unique personalities in terms of implied volatility (their option prices). For example, one stock might have an implied volatility of 30%, while another has an implied volatility of 50%. Even more, the 30% IV stock might usually trade with 20% IV, in which case 30% is high. On the other hand, the 50% IV stock might usually trade with 75% IV, in which case 50% is low.
So, how do we determine whether a stock's option prices (IV) are relatively high or low?
The solution is to compare each stock's IV against its historical IV levels. We can accomplish this by converting a stock's current IV into a rank or percentile.
Implied Volatility Rank (IV Rank) Explained
Implied volatility rank (IV rank) compares a stock's current IV to its IV range over a certain time period (typically one year).
Here's the formula for one-year IV rank:
(Current IV - 1 Year Low IV) / (1 Year High IV - 1 Year Low IV) * 100
For example, the IV rank for a 20% IV stock with a one-year IV range between 15% and 35% would be:
(20% - 15%) / (35% - 15%) = 25%
An IV rank of 25% means that the difference between the current IV and the low IV is only 25% of the entire IV range over the past year, which means the current IV is closer to the low end of historical levels of implied volatility.
Furthermore, an IV rank of 0% indicates that the current IV is the very bottom of the one-year range, and an IV rank of 100% indicates that the current IV is at the top of the one-year range.
Implied Volatility Percentile (IV Percentile) Explained
Implied volatility percentile (IV percentile) tells you the percentage of days in the past that a stock's IV was lower than its current IV.
Here's the formula for calculating a one-year IV percentile:
Number of trading days below current IV / 252 * 100
As an example, let's say a stock's current IV is 35%, and in 180 of the past 252 days, the stock's IV has been below 35%. In this case, the stock's 35% implied volatility represents an IV percentile equal to:
180/252 * 100 = 71.42%
An IV percentile of 71.42% tells us that the stock's IV has been below 35% approximately 71% of the time over the past year.
Applications of IV Rank and IV Percentile
Why does it help to know whether a stock's current implied volatility is relatively high or low? Well, many traders use IV rank or IV percentile as a way to determine appropriate strategies for that stock.
For example, if a stock's IV rank is 90%, then a trader might look to implement strategies that profit from a decrease in the stock's implied volatility, as the IV rank of 90% indicates that the stock's current IV is at the top of its range over the past year (for a one-year IV rank).
On the other hand, if a stock's IV rank is 0%, then traders might look to implement strategies that profit from an increase in implied volatility, as the IV rank of 0% indicates the stock's current implied volatility is at the bottom of its range over the past year."
This script approximates IV by using the VIX products, which calculate the 30-day implied volatility of the specified security.
*Includes an option for repainting -- default value is true, meaning the script will repaint the current bar.
False = Not Repainting = Value for the current bar is not repainted, but all past values are offset by 1 bar.
True = Repainting = Value for the current bar is repainted, but all past values are correct and not offset by 1 bar.
In both cases, all of the historical values are correct, it is just a matter of whether you prefer the current bar to be realistically painted and the historical bars offset by 1, or the current bar to be repainted and the historical data to match their respective price bars.
As explained by TradingView,`f_security()` is for coders who want to offer their users a repainting/no-repainting version of the HTF data.
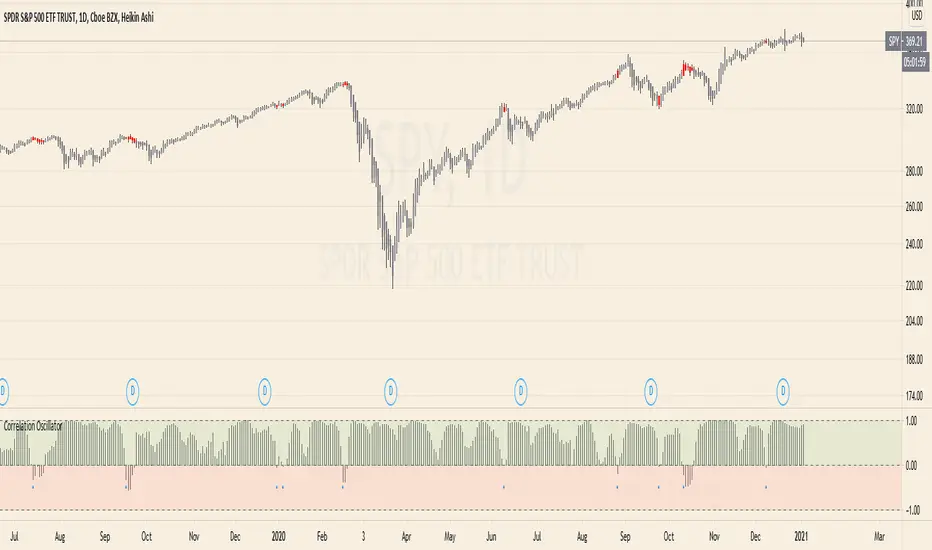
Correlation Oscillator - Anomaly AlertsThis script plots the correlation for two symbols as an oscillator:
A correlation of 1 means that both values move in the same direction together.
A correlation of -1 means that both values are perfectly negative correlated.
Parameter:
Length of the Correlation
The two symbols you want to calculate the correlation for
Barcolor: Defines whether Bar-coloring is set on.
The Number of bars lookback for anomaly: Say both are normally positively correlated it is an anomaly when the correlation turns negative and vica-versa.
Alerts: You can also set an Alert when an anomaly is detected.(blue dots on oscillator)
This has many use-cases:
For example VVIX and VIX are normally positive correlated.
When this turns negative, this can mean that we are on a turning point:
--> VVIX is rising while VIX is falling, risk of future Volatility is increasing (Top)
--> VIX is rising while VVIX is falling, risk of future Volatility is decreasing (Bottom)
Another use-case is just checking the correlation of stocks in your portfolio to diversify.
Volatility Trend IndicatorThe Volatility Trade Indicator signals bullish / bearish trend based on the volatility of the underlying asset.
During bull markets, volatility is typically low and price moves occur slowly and steadily. During bear markets, volatility is typically high and price movement is much more volatile in both directions.
The Volatility Trade Indicator measures the volatility of the underlying asset in relationship to the historic volatility over a specific timespan.
Low volatility regimes are signaled in green with an indicator value of below 0, high volatility regimes are signaled in red with an indicator value above 0.
During low volatility regime you want to look for long entries, during high volatility regimes you want to look for short entries.

Daily Crypto StrategyThis is a long only strategy.
This strategy measures and creates a signal when an asset is moving out of a correlation with CBOE VIX into an inverse correlation.
It also has a risk management with TP/SL based on percentages.
If you have any questions let me know.

VIX Term StructureThis script allows users to visualize the state of the VIX Futures Term Structure. The user is able to select from five CBOE VIX Indices; VIX, VIX9D, VIX3M, VIX6M, and VIX1Y and the script will color the candles based on the price relationship between selected indices. Visit the CBOE website for more info on how the various VIX indices are calculated.

Velocity To Inverse Correlation to VIX/Bonds Strategy (2020)This strategy measures and creates a signal when an asset is moving out of a correlation with high yield bonds or the CBOE VIX into an inverse correlation, as well as when an asset is losing correlation with a top corporate bonds ETF. When this signal is triggered, the simulation has the portfolio asset go long.
Additionally, exits are based on a 2% stop loss and a 2% take profit for simplicity sake to indicate whether the direct next move in the asset is up or down.
This was originally tested as a descent indicator for Ethereum's 2020 moves as institutional investors moved into the market.

VIX MTF MomentumSweet little momentum gadget to track the VIX Index.
What is the VIX?
The CBOE S&P 500 Volatility Index (VIX) is known as the 'Fear Index' which can measure how worried traders are that the S&P 500 might suddenly drop within the next 30 days.
When the VIX starts moving higher, it is telling you that traders are getting nervous. When the VIX starts moving lower, it is telling you that traders are gaining confidence.
VIX calculation?
The Chicago Board of Options Exchange Market Volatility Index (VIX) is a measure of implied volatility (Of the S&P 500 securities options), based on the prices of a basket of S&P 500 Index options with 30 days to expiration.
How to use:
If VIX Momentum is above 0 (RED) traders are getting nervous.
If VIX Momentum is below 0 (GREEN) traders are gaining confidence.
Follow to get updates and new scripts: www.tradingview.com

VIX CorrelationIndicator tracks the 10 day correlation with VIX. I prefer to use this with SPY. Can be a great way to flag tops/melt-ups.
Default settings are set to when the correlation is above 0.2, bars turn red, but you can change this.

Finnie's RSI + 3EMA crossover + MFI + Vix Fix-added a medium and long term rsiEMA, in addition to the previous short term, except this time there's a visual crossover :)
-added CM Williams vix fix
-and finally just a general visual overhaul!

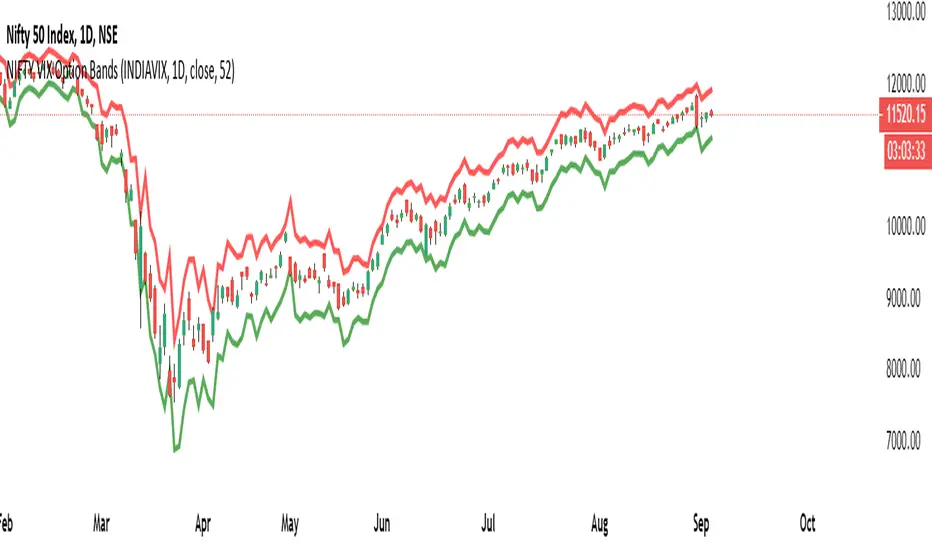
NIFTY VIX Bands1) The script takes current INDIA VIX as input Daily time frame for NIFTY
2) Used a Formula VIX Value / Square root of Time Period
3) Change Timeframe input accordingly 1 Year = 1, Monthly = 12, Weekly = 52, Daily = 365
4) based point 2 formula with 1 standard deviation it creates upper & lower range bands
5) This is generally used for option selling by big traders they go and sell above the band strikes
VIX3M/1M ratioThis script simply calculates and plots the VIX 3 month versus 1 month ratio. Values below 1 indicate a strong panic situation in the market (1 month volatility is higher than the 3 month volatiliy). This might be a good opportunity to sell options.

Trading Psychology - Fear & Greed Index by DGTPsychology of a Market Cycle - Where are we in the cycle?
Before proceeding with the question "where", let's first have a quick look at "What is market psychology?"
Market psychology is the idea that the movements of a market reflect the emotional state of its participants. It is one of the main topics of behavioral economics - an interdisciplinary field that investigates the various factors that precede economic decisions. Many believe that emotions are the main driving force behind the shifts of financial markets and that the overall fluctuating investor sentiment is what creates the so-called psychological market cycles - which is also dynamic.
Stages of Investor Emotions:
* Optimism – A positive outlook encourages us about the future, leading us to buy stocks.
* Excitement – Having seen some of our initial ideas work, we begin considering what our market success could allow us to accomplish.
* Thrill – At this point we investors cannot believe our success and begin to comment on how smart we are.
* Euphoria – This marks the point of maximum financial risk. Having seen every decision result in quick, easy profits, we begin to ignore risk and expect every trade to become profitable.
* Anxiety – For the first time the market moves against us. Having never stared at unrealized losses, we tell ourselves we are long-term investors and that all our ideas will eventually work.
* Denial – When markets have not rebounded, yet we do not know how to respond, we begin denying either that we made poor choices or that things will not improve shortly.
* Fear – The market realities become confusing. We believe the stocks we own will never move in our favor.
* Desperation – Not knowing how to act, we grasp at any idea that will allow us to get back to breakeven.
* Panic – Having exhausted all ideas, we are at a loss for what to do next.
* Capitulation – Deciding our portfolio will never increase again, we sell all our stocks to avoid any future losses.
* Despondency – After exiting the markets we do not want to buy stocks ever again. This often marks the moment of greatest financial opportunity.
* Depression – Not knowing how we could be so foolish, we are left trying to understand our actions.
* Hope – Eventually we return to the realization that markets move in cycles, and we begin looking for our next opportunity.
* Relief – Having bought a stock that turned profitable, we renew our faith that there is a future in investing.
It's hard to predict with certainty where we exactly are in the market cycle, we can only make an educated guess as to the rough stage based on data available. And here comes the study "Trading Psychology - Fear & Greed Index"
Factors taken into account in this study include:
1-Price Momentum : Price Divergence/Convergence versus its Slow Moving Average
2-Strenght : Rate of Return (RoR) also called Return on Investment (ROI) is a performance measure used to evaluate the efficiency of an investment, net gain or loss of an investment over a specified time period, the rate of change in price movement over a period of time to help investors determine the strength
3-Money Flow : Chaikin Money Flow (CMF) is a technical analysis indicator used to measure Money Flow Volume over a set period of time. CMF can be used as a way to further quantify changes in buying and selling pressure and can help to anticipate future changes and therefore trading opportunities. CMF calculations is based on Accumulation/Distribution
4-Market Volatility : CBOE Volatility Index (VIX), the Volatility Index, or VIX, is a real-time market index that represents the market's expectation of 30-day forward-looking volatility. Derived from the price inputs of the S&P 500 index options, it provides a measure of market risk and investors' sentiments. It is also known by other names like "Fear Gauge" or "Fear Index." Investors, research analysts and portfolio managers look to VIX values as a way to measure market risk, fear and stress before they take investment decisions
5-Safe Haven Demand : in this study GOLD demand is assumed
What to look for :
*Fear and Greed Index as explained above,
*Divergencies
Tool tip of the label displayed provides details of references
Conclusion:
As investors, we always get caught up in the day to day price movements, and lose sight of the bigger picture. The biggest crashes happen not when investors are cautious and fearful, it's when they're euphoric and expecting financial instruments to continue going higher. So as we continue investing, don’t forget to stop and ask yourself, where in the chart do you think we are right now? The Market Psychology Cycle shines light on how emotions evolve, fear and greed index can come in handy, provided that it is not the only tool used to make investment decisions. It is easy to look back at market cycles and recognize how the overall psychology changed. Analyzing previous data makes it obvious what actions and decisions would have been the most profitable. However, it is much harder to understand how the market is changing as it goes - and even harder to predict what comes next. Many investors use technical analysis (TA) to attempt to anticipate where the market is likely to go. Investors are advised to keep tabs on fear for potential buying the dips opportunities and view periods of greed as a potential indicator that financial instruments might be overvalued.
Warren Buffett's quote, buy when others are fearful, and sell when others are greedy
Trading success is all about following your trading strategy and the indicators should fit within your trading strategy, and not to be traded upon solely
Disclaimer : The script is for informational and educational purposes only. Use of the script does not constitute professional and/or financial advice. You alone have the sole responsibility of evaluating the script output and risks associated with the use of the script. In exchange for using the script, you agree not to hold dgtrd TradingView user liable for any possible claim for damages arising from any decision you make based on use of the script

VIX TrendlineThis indicator helps to see the volatility index (VIX) trendline in all stock charts without opening the VIX chart explicitly.
Hope this helps many of you to be more efficient in your chart analysis - have fun!

VIX futures Backwardation/Contango strategyVery basic strategy that goes long on a VIX ETF whenever the futures curve shows signs of backwardation and gets out when it shows signs of contango. Makes no effort whatsoever to avoid getting faked out by monthly futures rollover.
Surprisingly good at not incinerating money while still providing diversification benefits in a long SPY portfolio. Useful for demonstrating the benefits of including VIX futures to hedge an actively managed portfolio.
Can be set to get out if the VIX goes below the lowest value of the last 3 candles, in which case it spends less time in the market but seems to actually make a bit of money over the past decade, though the only intent of this script is to make it not lose money.

Imminence of volatilityWork in progress.
Simple oscillator that takes in implied volatilities at two different timescales for the same security, to determine whether the market expects the next crash to be imminent or "in a few months from now".
Best combined with other IV/VIX-based indicators and visual inspection of the IV charts, but still gives some decent information at a glance.

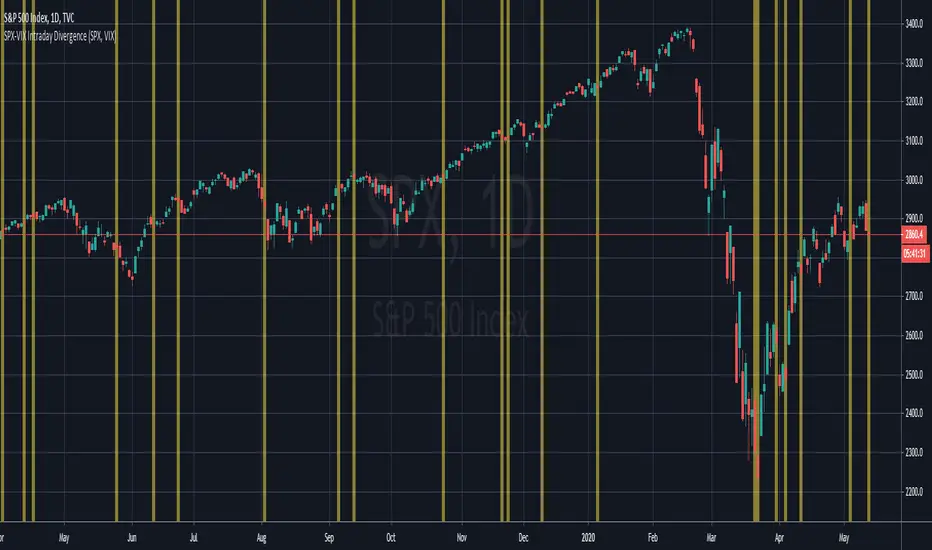
SPX-VIX Intraday DivergenceAs a long-term buyer/short-seller, you will always find different ways to enter the market , moving average crossovers, breakouts , overbought/oversold conditions being some of the classy methods. However, they are decreasingly effective... 😢
Recently I have realized that analysis beyond the technical indicators will bring trading to the next level because I will be able to confirm my trading signals without relying too much on basic price actions and patterns which are easily manipulated by big banks and institutions. 👍
Today I will introduce you to my divergence indicator making use of SPX and VIX. Unlike MacD or RSI divegence , which would involve normative judgement , it will take account of the unusual move by SPX alongwith the VIX , to the exploit chances that options market, where most experienced investors participated in has a preceding insight into the equity market about the upcoming moves.
I have divided signals into two groups.
Bullish divergence - SPX Down , VIX also Down 👇
Bearish divergence - SPX Up , VIX also Up 👆
I hope this script will enable us to take advantage of the options market activities , to provide a REAL divergence signal, and be used coupled with our own chart patterns or other price signals, and more importantly to score more and more winning trades!!!
If you want more useful scripts from me, please like and share my posts. And don't forget to follow my account to grab the latest ideas and tools! 😘
SPY Expected Move by VIXThis indicator shows 1 and 2 standard deviation price move from the VWAP based on VIX. Implied Volatility (IV) is being used extensively in the Option world to project the Expected Move for the underlying instrument. VIX is used as a proxy for SPY's IV for 30 days.
This indicator is meaningful only for SPY but can be used in any other instrument which has a strong correlation to SPY.
