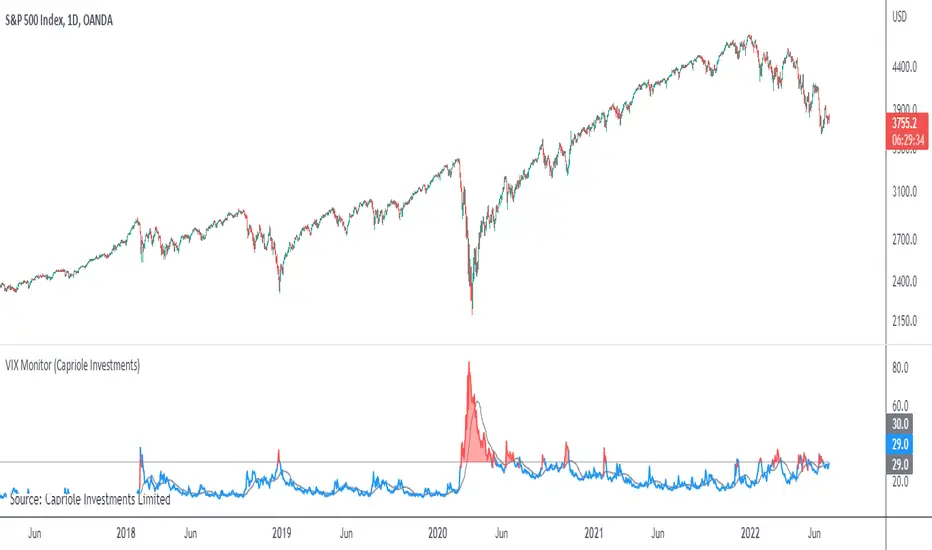
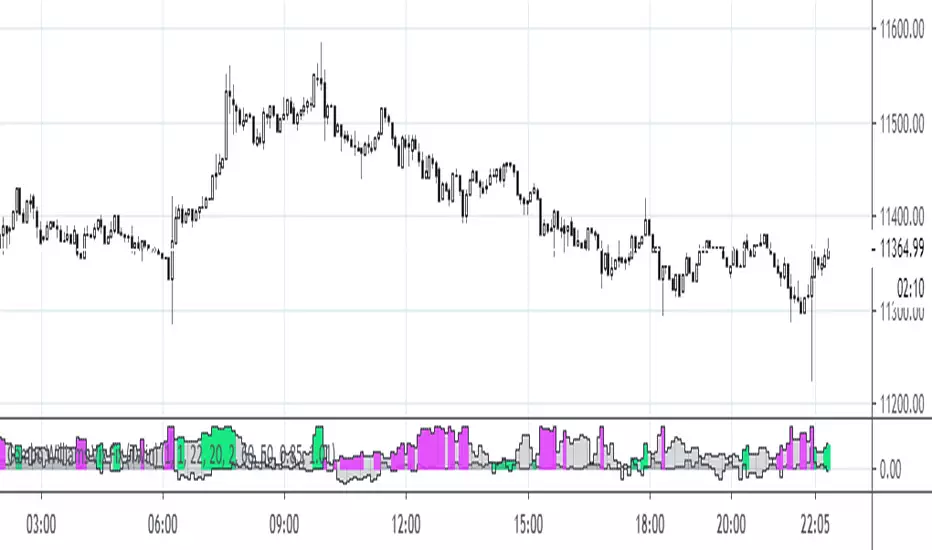
VIX MonitorSimple VIX Monitor to track spikes.
Spikes in VIX are often followed by big moves up in stocks.
Useful when paired with "Correlation & Beta" Indicator.
For Bitcoin Traders: when Bitcoin is highly correlated to Stocks (such as now) it could be a good opportunity for a short-term long trade.
VIX CBOE Volatility Index
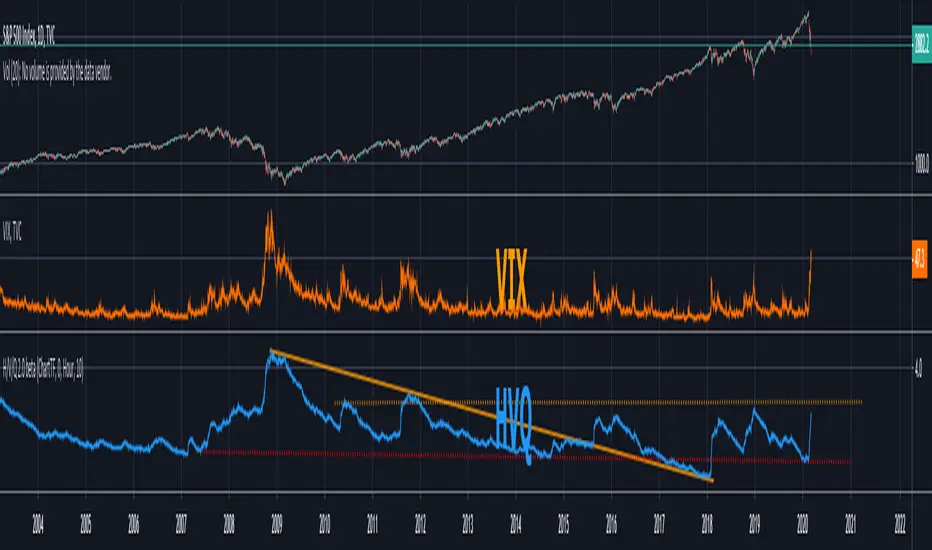
H/V/Q Volatility Index v2.0This is a standalone version of the volatility calculation used in QuantRsi. It is a relatively complex volatility-specific filtering calculation designed to give deeper insight into volatility trends for any asset class.
Use with Log scaling on the indicator's value scalar.
This tool offers an alternative model for volatility calculation. Experience using this tool proves that it extends the efficacy of volatility prediction techniques, and allows deeper technical analysis within volatility moves.
Use alongside conventional volatility indices to find opportunities within option chains to long or short volatility when HVQ provides evidence for volatility reversal that other options value models have not priced in.
Use as part of a predictive based risk management strategy.
Use alongside QuantRsi and HeffaeClouds as a complete trading suite, sans volume analysis, and gain insight not offered by any other indicator set.
SETTINGS:
TimeFrame settings:
Chart/Custom timeframe inputs are carried over from HeffaeClouds and QuantRsi indicators. Allows you to assign any non-chart timeframe to the indicator:
"ChartTF" follows your chart's selected resolution / TimeFrame
"Non-Chart TimeFrame" is an integer for your custom TimeFrame, the setting below:
"Non-Chart TimeFrame" selects "Minutes, Hours, Days" that corresponds to the above setting for a custom TimeFrame.
More Settings:
"Invert Output switch" will invert the volatility chart scale. Useful for visualizing some trends on assets that regularly correlate large volatility spikes with disorderly selloffs.
"Show High/Low Volt range" switch (experimental) shows the high/low extremes of alternate volatility window calculations. There is insight to be gained from large differences v.s. all ranges trending near the same values.
"Relative value switch" (experimental) divides the HVQ values by the hl2 candle price, per candle. This is a unique way to filter the output, visualize the volatility value per asset value.
"Range Multiplier" adjusts the average window length HVQ uses for calculations. This has been finely tuned so that the value of "10" corresponds to the best average fitting of all assets and timeframes. In most situations TimeFrame should be used to alter the real window periods and this should be left at default. Instead you can change this to find better fitting if you'd like.
If there is a feature you would like, question answered, or a bug to report, visit the TradingView SNOW_CITY public chat-room; link in my signature
Use the pastebin link below for indicator access information and pricing
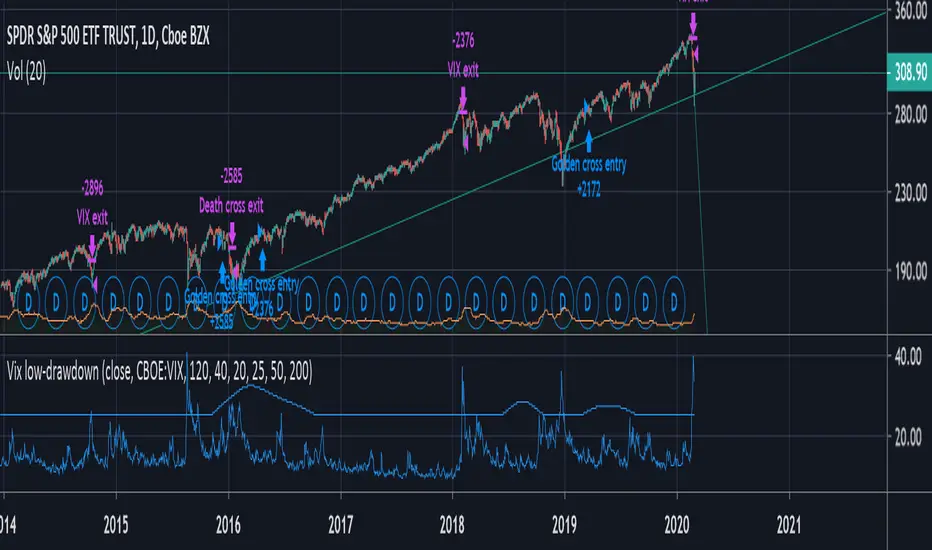
VIX + moving average low-drawdown SPY strategyAims to be a simple way to avoid recessions by combining two complementary tools that work well together: A simple moving average crossover (death cross & golden cross) to detect a bull markets and run with it, and a crossover between the VIX and a moving average of its previous peaks to get out as quickly as possible during periods of volatility.
The Death cross gets you out of slow drawn-out bear markets. The VIX gets you out of sudden rapid crashes.
Volatility IndexThis is a composite volatility index to show percentile of current volatility compared to that of the last 52 bars. As this is a weekly chart (and this script is intended for usage on weekly charts) we can see the yearly percentile rank of volatility.
As shown when volatility is in the lower 25%tile (viewed on weekly) the market is calm and likes to rise; when the volatility is above the 25%tile you can see that the market tends to have larger and 'choppier' moves.
This is /not/ 'just the vix' this takes into consideration the volatility of all major US indexes including the SPX500, Dow 30, Nasdaq 100, and Russel 2000.
Please remember that this is just plotting:( volatility index - lowest(index,52) )/( highest(index,52)-lowest(index,52) ) so for 'yearly percentile' check the weekly chart (52 weeks = 1yr)

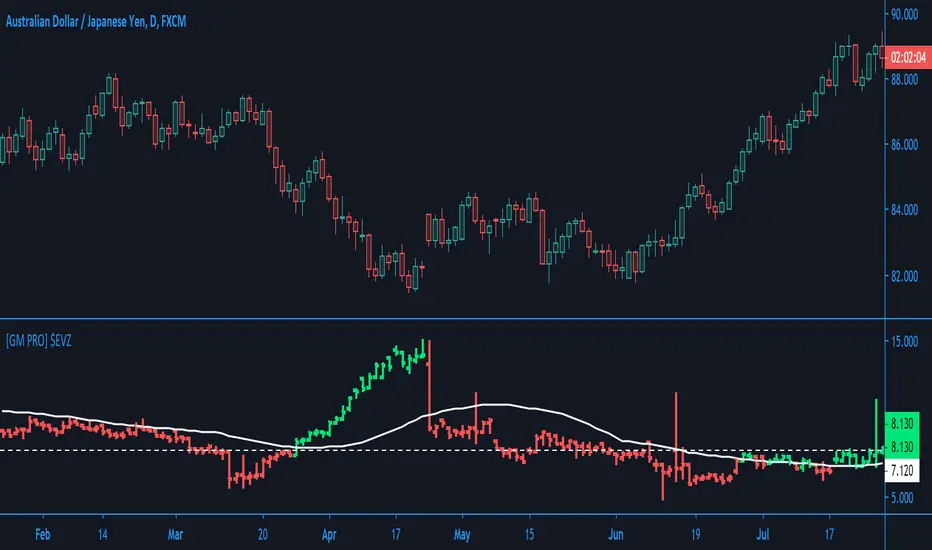
[GM PRO] $EVZCBOE: Euro FX VIX ($EVZ)
A reasonable indicator of overall Forex Market Volume and/or Volatility.
Filters added:
- Filter by Horizontal Level
- Filter by Moving Average
Options to consider the highs or the closing values
This indicator is only for Forex
(JS)S&P 500 Volatility Oscillator For Options 2.0I am going to start taking requests to open source my indicators and they will also be updated to Version 4 of Pinescript.
I added some features to the original code such the ability to smooth the oscillator and select the look back periods for the historical volatility.
Link to original:
Original post:
"The idea for this started here: www.tradingview.com with the user @dime
This should only be used on SPX or SPY (though you could use it on other things for correlation I suppose) given that the instrument used to create this calculation is derived from the S&P 500 (thank you VIX ). There's a lot of moving parts here though, so allow me to explain...
First: The main signal is when Implied Volatility (from VIX ) drops beneath Historical Volatility - which is what you want to see so you aren't purchasing a ton of premium on long options. Green and above 0 means that IV% has dropped lower than Historical Volatility . (this signal, for example, would suggest using a Long Call or Put depending on your sentiment)
Second: The green line running underneath zero is the bottom portion of the "Average True Range" derived from the values used to create the oscillator. the closer the bottom histogram is to the green line, the more "normal" IV% is. Obviously, if this gets far away from the line then it could be setting up nicely to short options and sell the IV premium to someone else. (this signal, for example, would suggest using something like a Bull Put Spread)
Third: The red background along with the white line that drops down below zero signals when (and how far) the IV% from 3 months out (from VIX3M ) is less than the current IV%. This would signal the current environment has IV way too high, a signal to short options once again (and don't take any long option positions!).
Tried to make this simple, yet effective. If you trade options on SPX , SPY , even ES1! futures - this is a tool tailored specifically for you! As I said before, if you want you can use it for correlation on other securities. Any other ideas or suggestions surrounding this, please let me know! Enjoy!
Feb 17, 2019
Release Notes: Cosmetic update for a much cleaner look:
-Replaced the "HIGH IV" with a simlple "H"
-Now the white line is constantly showing you the relationship between VIX and VIX3M - when VIX is greater than VIX3M the background still goes red
-However, now when VIX drops below Historical Volatility, the background is bright green
-When both above are true - it's dark green
-The Average True Range on the bottom is now a series of crosses"

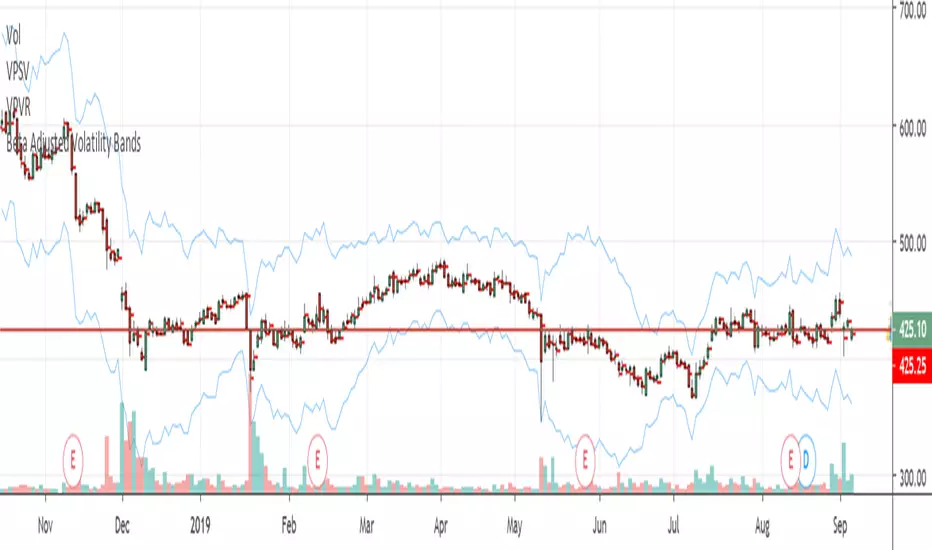
Beta Adjusted Volatility BandsBeat Adjusted Volatility Bands
Input Vix and Beat of the asset Sector.
Example:
Looking to sell options, Sell options beyond the bands.
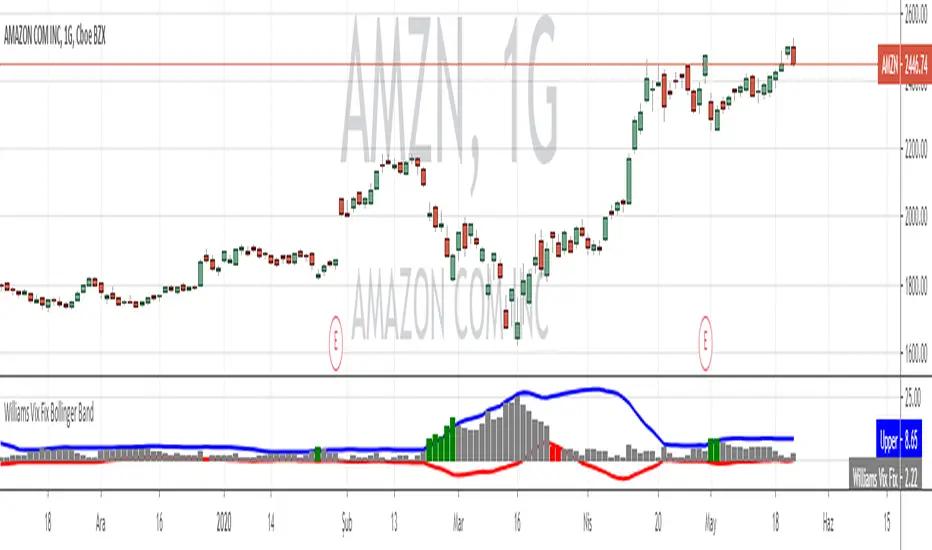
Williams Vix Fix paired with Supertrend HeatmapThis script shows my mod of the powerful Williams' Vix Fix indicator paired with a modified Supertrend Heatmap, originally created by Daveatt.

VIX - SHORT - SVXY - Daily Chart (Oldinvestor)This looks at he VIX and trades SVXY. Load SVXY and run the script on SVXY.
INPUTS:
Entry - You set this number to how high you want the VIX to go before SVXY will be bought. Keep in mind it buys the bar after a trigger, results may be confusing
Exit - You set this number to how low you want the VIX to go before SVXY will be sold.
Year - This as stated, It will start trading on the year you set here.
Good luck.
This script is for learning purposes, and boy did I learn something. UVXY still sucks

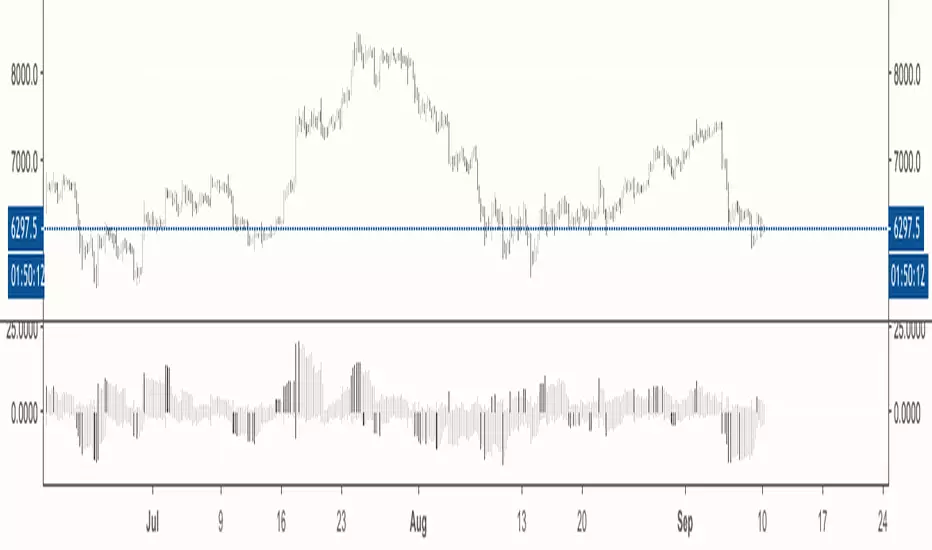
Combo Williams Vix Fix (Twin version)This is a very powerful Williams' Vix Fix indicator.
My implementation of this wonderful indicator features both up and down movements. Both up & down flavors have two versions (fields tp and tp2, each having two values). Color can be reversed as desired (rev). By default colors show continuation, reversed colors show reversion (as intended originally).
VIX reversion-Buschi
English:
A significant intraday reversion (commonly used: 3 points) on a high (over 20 points) S&P 500 Volatility Index (VIX) can be a sign of a market bottom, because there is the assumption that some of the "big guys" liquidated their options / insurances because the worst is over.
This indicator shows these reversions (3 points as default) when the VIX was over 20 points. The character "R" is then shown directly over the daily column, the VIX need not to be loaded explicitly.
Deutsch:
Eine deutliche Intraday-Umkehr (3 Punkte im Normalfall) bei einem hohen (über 20 Punkte) S&P 500 Volatility Index (VIX) kann ein Zeichen für eine Bodenbildung im Markt sein, weil möglicherweise einige "große Jungs" ihre Optionen / Versicherungen auflösen, weil das schlimmste vorbei ist.
Dieser Indikator zeigt diese Umkehr (Standardwert: 3 Punkte), wenn der VIX vorher über 20 Punkte lag. Der Buchstabe "R" wird dabei direkt über dem Tagesbalken angezeigt, wobei der VIX nicht explizit geladen werden muss.

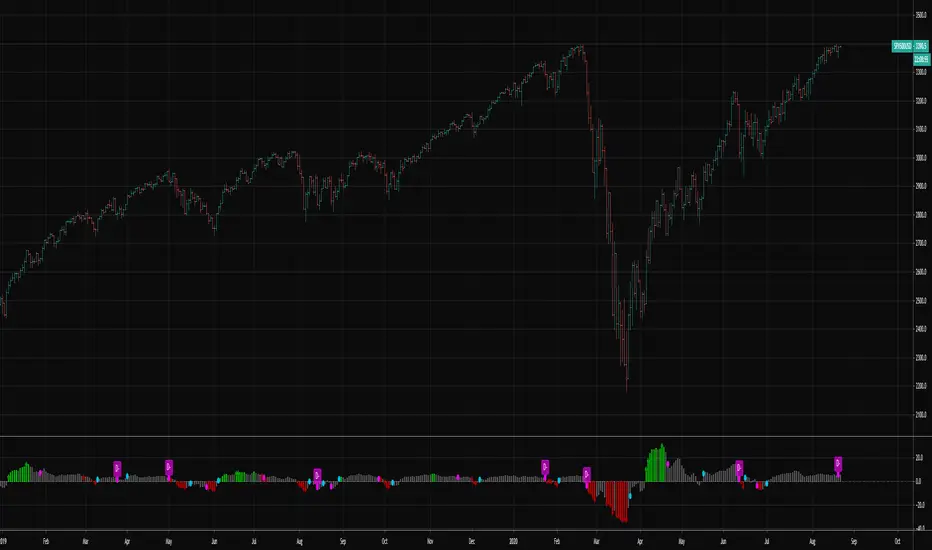
PpSignal EWO BB IndexI have developed an indicator based on the oscillator of that with the escape bands, where we can see the relationship between the Vix. (histogram), Nasdaq color lime and SP500 color green.
it is very important to consider the relationship vix with these indices ...

Extreme IndicatorIdentifies price extreme points based on a highest/lowest price lookback. There are many other goodies hidden in this indicator including a built in ATR trailing stop that will flip up and down.
The inspiration of this indicator is based on this idea .

VIX-VXV-Ratio-Buschi
English:
This script shows the ratio between the VIX (implied volatility of SPX options over the next month) and the VXV (implied volatility of SPX options over the next three months). Since in normal "Contango" mode, the VXV should be higher than the VIX, the crossing under 1.0 or maybe 0.95 after a volatility spike could be a sign for a calming market or at least a calming volatility.
Deutsch:
Dieses Skript zeigt das Verhältnis zwischen dem VIX (implizite Volatilität der SPX-Optionen über den nächsten Monat) und dem VXV (implizite Volatilität der SPX-Optionen über die nächsten drei Monate). Da im normalen "Contango"-Modus der VXV höher als der VIX liegen sollte, kann das Abfallen unter 1,0 oder 0,95 nach einer Volatilitätsspitze ein Anzeichen für einen ruhiger werdenden Markt oder zumindest eine ruhiger werdende Volatilität sein.

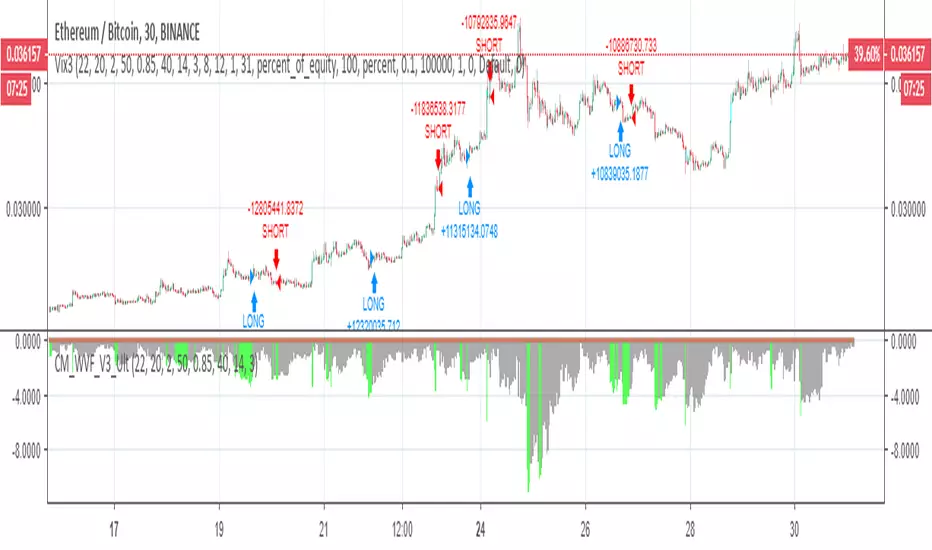
CM Vix V3 Strategy ChrisMoody developed an indicator VIX , I combined it with DEMA and share here for a long time ago ( )
I wanted to share this indicator's version 3 as a strategy. If you like it, we can combine it with other indicators together.
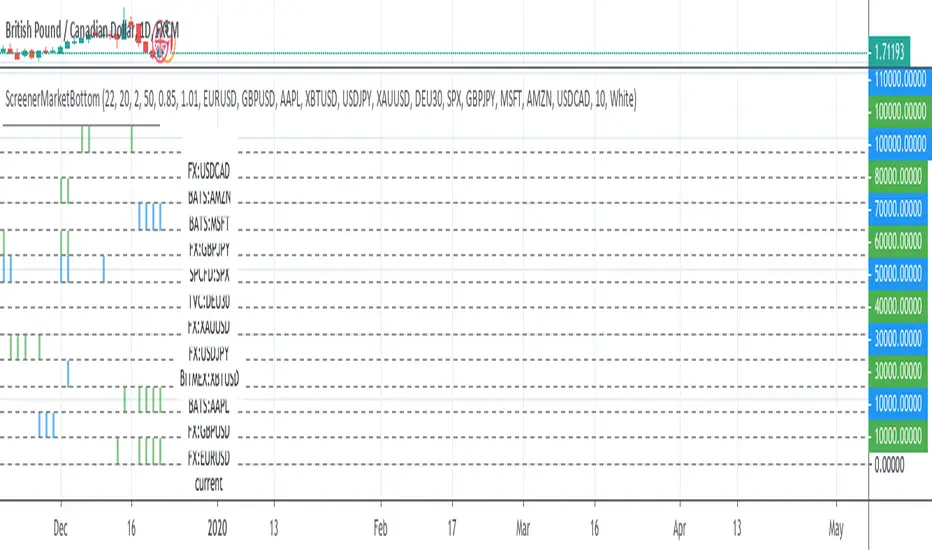
ScreenerMarketBottomThis study works as screener with alerts for ChrisMoody's scritp CM_Williams_Vix_Fix Finds Market Bottoms .
Refers to original study for the code: I converted it in a function and I used my snippets of pine script codes for convert it in a screener.
I'm thinking to transform it in a strategy: if someone has suggestion on startegy logic please let me know. For example enter long after three lime color bars?
Please use comment section for any feedback.
Next improvement (only to whom is interested to this script and follows me): study with alerts on multiple tickers all at one. Leave a comment if you want to have access to study.
Historical Volatility RankSame formulation of IVR but based on Historical Volatility instead.
Serves the same purpose as IV rank.

@WACC Volatility Weighted PUT/CALL Positions [SPX]This indicator is based on Volatility and Market Sentiment. When volatility is high, and market sentiment is positive, the indicator is in a low or 'buy state'. When volatility is low and market sentiment is poor, the indicator is high.
The indicator uses the VIX as it's volatility input.
The indicator uses the spread between the Call Volume on SPX/SPY and the Put Volume.
This is pulled from CVSPX and PVSPX.
When volatility and put/call reaches a critical level, such as the levels present in a crisis or a sell off, the line will be green. See Sept 2015, 2008, and Feb 2018.
This level can be edited in the source code.
As the indicator is based on Put/Call, the indicator works best on larger time frames as the put/call ratio becomes a more discernible measure of sentiment over time.

IV/HV ratio 1.0 [dime]This script compares the implied volatility to the historic volatility as a ratio.
The plot indicates how high the current implied volatility for the next 30 days is relative to the actual volatility realized over the set period. This is most useful for options traders as it may show when the premiums paid on options are over valued relative to the historic risk.
The default is set to one year (252 bars) however any number of bars can be set for the lookback period for HV.
The default is set to VIX for the IV on SPX or SPY but other CBOE implied volatility indexes may be used. For /CL you have OVX/HV and for /GC you have GVX/HV.
Note that the CBOE data for these indexes may be delayed and updated EOD
and may not be suitable for intraday information. (Future versions of this script may be developed to provide a realtime intraday study. )
There is a list of many volatility indexes from CBOE listed at:
www.cboe.com
(Some may not yet be available on Tradingview)
RVX Russell 2000
VXN NASDAQ
VXO S&P 100
VXD DJIA
GVX Gold
OVX OIL
VIX3M 3-Month
VIX6M S&P 500 6-Month
VIX1Y 1-Year
VXEFA Cboe EFA ETF
VXEEM Cboe Emerging Markets ETF
VXFXI Cboe China ETF
VXEWZ Cboe Brazil ETF
VXSLV Cboe Silver ETF
VXGDX Cboe Gold Miners ETF
VXXLE Cboe Energy Sector ETF
EUVIX FX Euro
JYVIX FX Yen
BPVIX FX British Pound
EVZ Cboe EuroCurrency ETF Volatility Index
Amazon VXAZN
Apple VXAPL
Goldman Sachs VXGS
Google VXGOG
IBM VXIBM

Inverted Yield Curve with VIX Fear IndexUS 2 year and US 10 year comparison, inverted yield curve with VIX. I use this on a weekly chart with 2 moving averages, the 40 week (ma200 daily) and the 520 week (10 year median).
The bottom histogram is the VIX and the plot is the yield curve. When the VIX is above a certain level (you can set it in settings) and the ýield curve is close to or at inversion the background goes red.
The last seven recessions were preceded by an inverted yield curve. Here I combined the two main fear indexes, the VIX and the run for safe US treasuries (Inverted Yield Curve).
This is preset to the 2 year and 10 year US bond, weekly, and the normal VIX ticker but you can set it to whatever you like.
Published with source code for anyone to modify. Please comment below if you do so! This is the second in a series of indicators I intend to publish as a package of economic recoverty/recession symptom indicators.
Follow me for updates, next one up is commodities with dr Copper and oil!
