[KL] BOLL + MACD Strategy v2 (published)This strategy will look for opportunities when price touches the lower Bollinger band, then enters Long when it anticipates a MACD crossover signal.
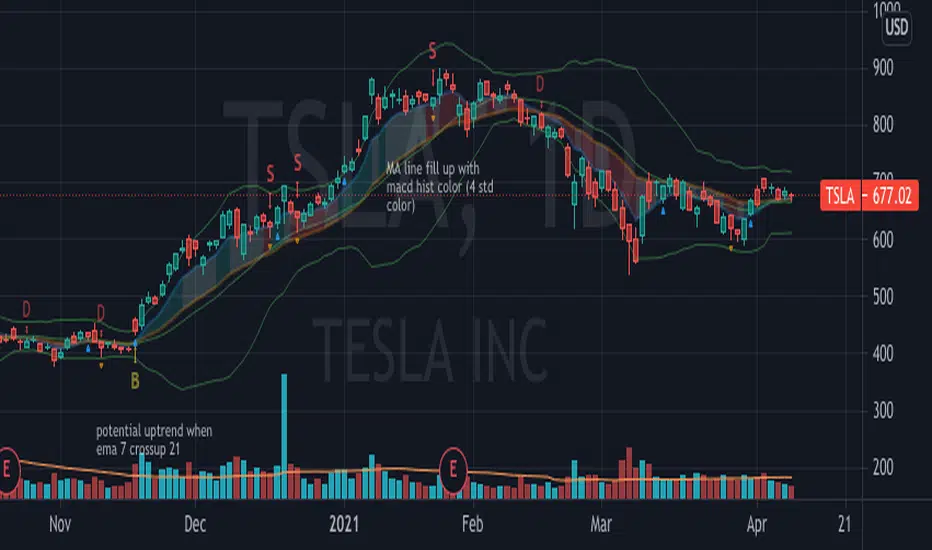
Setup: on 1-day chart interval
Exits when either (a) hitting trailing stop loss, or (b) meeting risk-to-reward, if defined by user.
Strategi Pine Script®