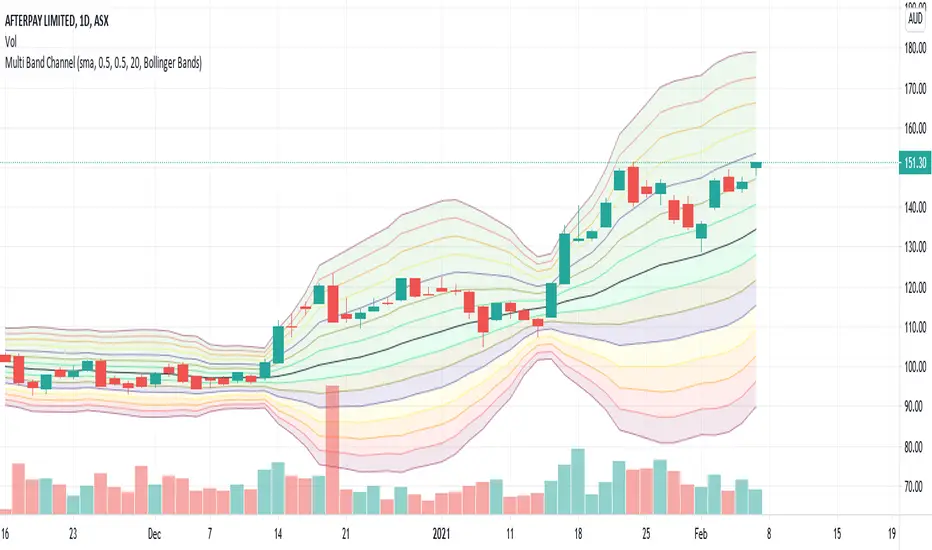
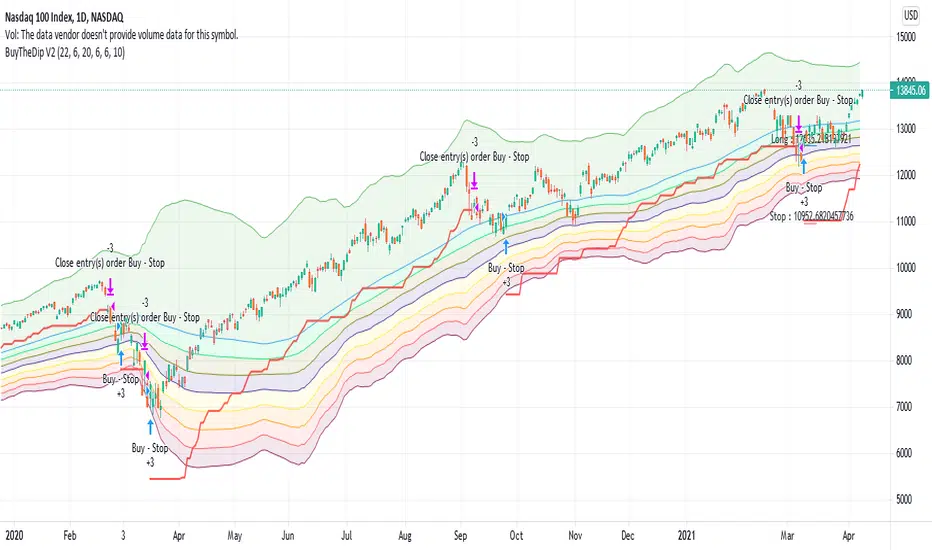
Find lows based on divergence on bollinger bands. Works great on stocks and index, no success on forex. Different stock/index requires different values. Exit is not perfect, often on the safer side. Example settings: NASDAQ:OMXS30, 30m: 25 0.452 0.42 0.453 2 62 20 Lower bbrower = buys harder dips, too low will cause buy during fall. Higher bbrhigher = buys...
The Traders Dynamic Index(TDI) is a trend, momentum and volatility indicator. The TDI is comprised of a standard Relative Strength Index(RSI) line, but also includes an RSI signal line, Bollinger Bands of the RSI and adjusted horizontal overbought/oversold levels. This version of the TDI offers the ability to color the RSI line based on RSI momentum. This...
This strategy combines VWAP and BB indicators BUY RULE 1. EMA50 > EMA 200 2. if current close > vwap session value 3. check if price dipped BB lower band for any of last 10 candles EXIT RULE 1. price closes above BB upper band STOP LOSS EXIT 1. As configured --- default is set to 5% warning: for the use of educational purposes only
3 indicators in 1. Included Indicators are: - EMA 8,13,21,55,100,200,450 - Ichimoku - Bollinger Band These can be used to determine changes in trends when: - EMA's collide, trajectories shift, or certain levels are reached. - Ichimoku cloud is above or below the candles. - Bollinger Band's width changes, or range is broken. Reasons for 3 in 1 assembly: This...
I wanted to share this strategy that I use myself for binary options trading. After trading binary options for several years I have learned that every single day is unique... assets behave differently every single day. So, when I start the day I want to know which is the optimum combination of parameters in my indicators that will give me the signals I want...
Set the color for each bands and indicate the Bollinger bands. In order to indicate with simple moving average line,hide the bollonger bands line and set the color for bands. ボリンジャーバンドの帯域ごとに色を設定して表示します。 単純移動平均線と同時表示しても見やすいように、ボリンジャーバンドの線を非表示にして、帯域に色を設定して表示することができます。
This is part 3 of 11 in the system named Ninetales/Volt V2 you can find on Tradingview. It simply measures all of the combinations of the defined parameters for Bollinger Bands, and returns the most logically accurate values. Use it however you would use standard Bollinger Bands, just add your preferred values to test against each other, and set the period you...
Indicator idea based on classic Bollinger bands and Telson T8 moving average. The indicator detects Bollinger bands narrowing which should predict a move to a direction. NOTE: You need to define in the indicator settings (Narrow percentage) the percentage between the upper and lower bands that would be highlighted. For example: if you set 5%, the indicator...
This strategy gives signals for Buy or Sell based on BB and EMA indicators. Green Buy signal below the BB which is not touching 5 EMA Red Sell signal above the BB which is not touching 5 EMA
Bollinger bands says whether price or any source is relatively high or low at any particular point of time. We can apply Bollinger bands on RSI and volume indicator Price Volume Trend to identify if RSI movement or PVT movement is relatively high or low. By calculating Bollinger %B, we can define the variation in a range between 0 to 1. By applying Bollinger %B...
A mixture of A Bollinger and fork from Ricardo Santos Donchian/Bollinger(DBH). Looks Nicer on a higher time frame, 4hr+. Default of DBH is 20, but 13/15 looks clearer to me.
This script plots multiple EMA's also it shows you when a particular EMA crosses up or below another EMA. You can customize the EMA's based on your setups or preferences. This script basically will help you easily identify when a particular EMA has crossed over or crossed under another EMA at one glance. Particularly useful when there is a lot of entanglement...
Referred to the book "Bollinger on Bollinger Bands" The best use of BB is to wait for squezze and breakout to capture the start of the trend. Here the signal and target profit. 1. Long Signal when the close crosses above the upper BB and the Bandwidth of current bar exceeds 1.25 times of the previous bar (Volatility expands). : Green Triangle Up 2. Short Signal...
본 지표는 PSAR + Bollinger Bands 를 사용해 추세를 나타내는 지표입니다. 배경색이 붉은색이면 상승추세, 파란색이면 하락추세를 나타냅니다. PSAR과 BollingerBands 중심선을 기준으로 추세를 알아냅니다. These are indicators of trends using PSAR + Bollinger Bands. A red background indicates an upward trend, while a blue one indicates a downward trend. Identify trends based on the centerlines of PSAR and BollingerBands.
This is an indicator that flags the lowest Bollinger Bands Width value for a set number of bars back. This is based on my BBVV script seen here Each dot on the BBVV indicator marks the rolling "X"-period low in BBVV value. You can set "X" as any number of bars back in the settings of this indicator. This can be used to accurately predict when periods of...
Buy when the candle closes above upper BB Sell when the candle closes bellow lower BB Stop always on base line
For best results, collect a minimum of 4 confirmations. The EMA serves as a dynamic support and resistance and to know the trend, when it touches the bottom of the Bollinger Bands look for purchases, if it is at the top look for sales. It can be supplemented with Volume. (also applying price action and looking for bounce points) EMA: 200 Bollinger Bands:...
Exponential Volume Weighted Average Price and Deviations. Selectable intervals (daily/weekly/monthly/yearly vwap). Options to change deviation multipliers and display interval closing values for the previous interval. Uses volume weighted EMA for the interval as the basis/vwap & exponential deviations calculated using the exponential vwap as the mean.