BBliciousStandard Bollinger Band with : - BB with 1 Standard Dev - BB with 1.5 Standard Dev - BB with 2..5 Standard Dev Top and Bottom Ribbon Color Area - Fill Area between Standard Dev 1 and 1.5 ( Top & Bottom )Penunjuk Pine Script®oleh Hud_Hud307
[blackcat] L2 Center Band BollingerLevel: 2 Background Bollinger bands are a type of price envelope developed by John Bollinger , where price envelopes define upper and lower price ranges. Bollinger Bands are envelopes that are represented with a standard deviation above and below a simple moving average of price. Because the spacing of the bands is based on the standard deviation, they adjust for fluctuations in the volatility of the underlying price. Function L2 Center Band Bollinger takes advantage of Bollinger band to detect sideways and trends. At the same time, I made an improvement and the center Bollinger line as a fast-slow-line color band. The algorithm of the color center band is composed of price and volume information, which produces gold cross and dead cross for short term long and short entries. Key Signal aa10 --> bollinger middle fast line aa12 --> bollinger middle slow line up --> upper envelope dn --> lower envelope Pros and Cons Pros: 1. it can easy see the sections of trends or sideways by width of Bollinger band 2. long and short entries are disclosed Cons: 1. Some noise is still incorporated in trends 2. due to this is un-optimized version, time frame and trading pairs need to be selected 3. Bollinger re-entry signal is not disclosed yet Remarks The long and short signal is compatible to @nilux strategy backtest framework for sandardized backtest scheme: Backtest Readme In real life, I am a prolific inventor. I have successfully applied for more than 60 international and regional patents in the past 12 years. But in the past two years or so, I have tried to transfer my creativity to the development of trading strategies. Tradingview is the ideal platform for me. I am selecting and contributing some of the hundreds of scripts to publish in Tradingview community. Welcome everyone to interact with me to discuss these interesting pine scripts. The scripts posted are categorized into 5 levels according to my efforts or manhours put into these works. Level 1 : interesting script snippets or distinctive improvement from classic indicators or strategy. Level 1 scripts can usually appear in more complex indicators as a function module or element. Level 2 : composite indicator/strategy. By selecting or combining several independent or dependent functions or sub indicators in proper way, the composite script exhibits a resonance phenomenon which can filter out noise or fake trading signal to enhance trading confidence level. Level 3 : comprehensive indicator/strategy. They are simple trading systems based on my strategies. They are commonly containing several or all of entry signal, close signal, stop loss, take profit, re-entry, risk management, and position sizing techniques. Even some interesting fundamental and mass psychological aspects are incorporated. Level 4 : script snippets or functions that do not disclose source code. Interesting element that can reveal market laws and work as raw material for indicators and strategies. If you find Level 1~2 scripts are helpful, Level 4 is a private version that took me far more efforts to develop. Level 5 : indicator/strategy that do not disclose source code. private version of Level 3 script with my accumulated script processing skills or a large number of custom functions. I had a private function library built in past two years. Level 5 scripts use many of them to achieve private trading strategy.Penunjuk Pine Script®oleh blackcat1402Telah dikemas kini 22144
BB Keltner Squeeze Signal 1.0Made this to signal when the criteria is met for a "Bollinger Band + Keltner Channel Squeeze" signal. This is when one or both of the Bollinger Bands come inside the Keltner Channel. When this happens the bars are highlighted. The idea of this script is to clean up charts as much as possible. Bollinger Bands are measures of standard deviation from a simple moving average. This is the distance that price travels as a whole over time. Keltner Channels are a measure of ATR from an exponential moving average. This is the average range of individual bars. Both indicators measure volatility and when they contract indicate that price is consolidation. A very tight consolidation can often be a prelude to an expansion of volatility and price movement. It can be a signal for a potential breakout or confirmation one will be successful. The actual Bollinger Bands and Keltner Channels are turned off by default but can be turned on in the script settings. I also use 26 as the default length but it can be changed.Penunjuk Pine Script®oleh norok189
Improved On balance volume with BB channel and double MAThis is an improved version of the on balance volume indicator. 
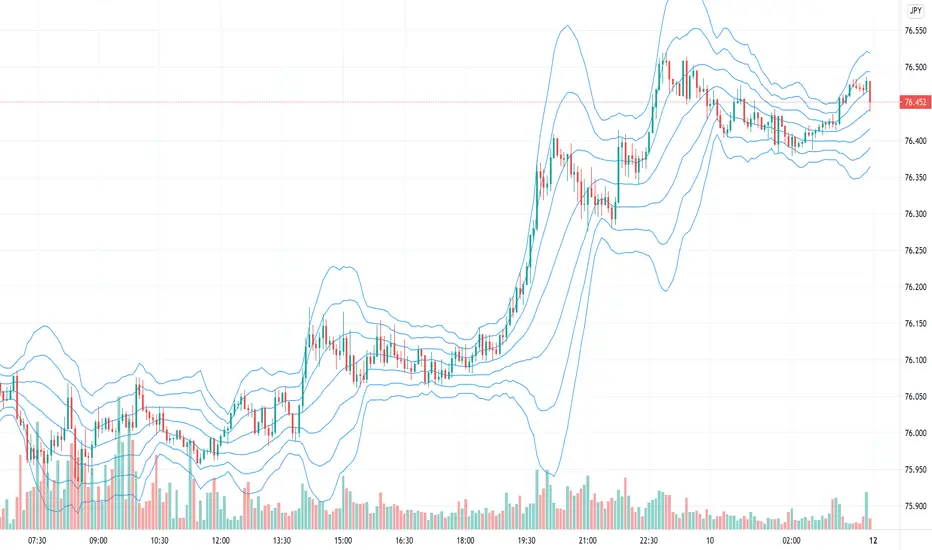
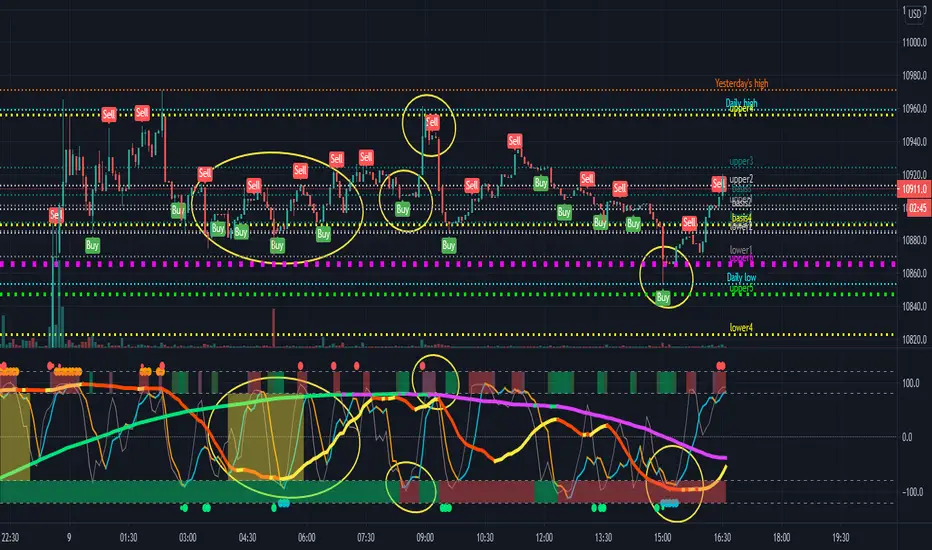
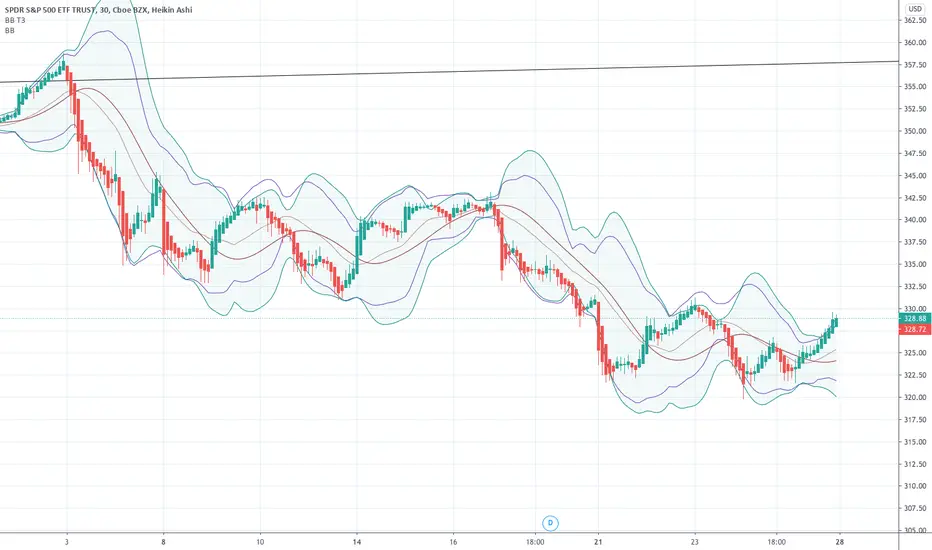
I made it inside a bollinger band channel, so we can define better the zones. At the same time I applied 2 moving averages on OBV, to get a better idea of the trend and at same time that change direction of the trend. Green - > uptrend - > we look for buy positions Red - > downtrend -> we look for sell positions. At the same time we have to be aware of crosses on bollinger bands, which can indicate a change in the trend .Penunjuk Pine Script®oleh SoftKill21164
Ultimate VWAP Bands- Ultimate VWAP Bands is a script that helps to decide and further clarify areas of oversold and overbought conditions. - For example, when the price is in the lowest band it is extremely oversold relative to the VWAP . Hence it should be considered a good place to buy with a high risk to reward payoff. - Each band is set at a fixed offset away from the VWAP . The "VWAP Band Multiplier" adjusts this and is a key part of the script. This allows the indicator to be adjusted based on the assets volatility . For example, with Crypto. A multiplier of 1 would be strongly advised. Whilst a multiplier of 0.1-0.25 would be useful for currency pairs. - This indicator can be used for all manners of trading. However, it is most effective when used for scalping and swing trading.Penunjuk Pine Script®oleh Pinnacle_InvestorTelah dikemas kini 1111993
Volume Weighted Bollinger Bands 出来高加重ボリンジャーバンドIt is a volume-weighted index of Bollinger Bands. The central line is vwma so it's quite responsive The standard deviation is also volume weighted Charts without volume are not weighted with volume as 1. It seems that the usage in trading is the same as the Bollinger band ボリンジャーバンドを出来高加重した指標です 中央線はvwma出来高加重移動平均なのでかなり反応が良いです 標準偏差も出来高加重してしています 出来高の無いチャートは出来高を1として加重しないようにしています トレードでの使い方はボリンジャーバンドと同じで良いと思われますPenunjuk Pine Script®oleh xinolia126
Blast Off With BBBased on Larry Williams "Blast Off" indicator. An excellent article describing calculations and usage is here . The indicator uses the same calculations. It must be noted that "Blast Off" by itself is not a sufficient system for a trade set up. This indicator adds traditional Bollinger Bands as a support structure for blast off. Generally, a volatility compression followed by a cluster of blast off indicates an aggressive "launch" on the upside or downside. Explanation Blast off is indicated below the candle bar with an up arrow Blast off candles can be marked (coloured) if preferred Bollinger bands can be enabled for prediction of the direction of the blast ("up" or "down") The Blast Smooth Length applies a smoothing to the ranges (Open - Close) and (High - Low) over the specified length. Threshold is the "trigger" that indicates a blast off candidate. It is defined in % terms.Penunjuk Pine Script®oleh bharatTraderTelah dikemas kini 33 1 K
Stochastics and RSI HybridThis is an interesting study. We know bollinger bands can be a useful tool for price action, but what if we applied them to other indicators? The top chart is the Stochastics and bottom chart represents RSI. We can see a relationship between the two indicators, where the signal line bounces of the bollinger bands. The strategy is simple, when the signal lines bounce of their bollinger bands together, review price action and then take the trade. If you see one indicator going in the opposite direction to the other, or opposite to price action, then you may be observing divergence in which case a big move is about to happen. If you wish to have this indicator further customised, please do not hesitate to contact me.Penunjuk Pine Script®oleh ForexResearchLabs152
Radar Screen v3This is a combination of various indicators that very rarely conflict, thus giving us a good understanding: - "Price Rally" detecting whether price is rallying, giving us confidence it will continue. - Volume - knowing volume is going with the trend is a good confidence check. - Trend Angle - This will go red or green depending on whether the price angle is going up or down, taken over three bars. - VWAP for all of these stock traders. - EMA8 is a very sensitive moving average, good for short term trades. - CCI SMA is a strategy I commonly use, please check out my other indicators for a functional description. - Stochastics is used throughout many systems. - RSI BB shows where price is rebounding of the bollinger band and then moving up or down. As per all of my indicators, the system is simple - The more green lines you see, the stronger the buy signal. The more red lines you see, the stronger the sell. If its a 50/50 mix of red and green, then don't trade. I can customise this further or add other strategies, please message me. Penunjuk Pine Script®oleh ForexResearchLabs1313293
Bollinger bands on 1M/5M/15M chart onlyJapanese below. 日本語の説明は下記 This is Bollinger bands that is shown only on 1M, 5M and 15M charts only. I Sometimes refer to Bollinger bands when I try to identify specific entry point on lower timeframe especially on 5M, whereas I do not want Bollinger bands to be shown up on other timeframes as they become noise... This is why I removed Bollinger bands from 1 hour and upper timeframes. —————————————————————————————— 1分足、5分足、15分足のみに表示されるボリンジャーバンドのインジケーターです。 1分足や5分足でエントリーのタイミングを計るときにはボリンジャーバンドを使うことがあるのですが、1時間足以上では特に参照しないため、チャートに表示しないよう制御を加えました。 ±1〜3シグマのバンド及びミドルラインとしてSMAを設定可能です。Penunjuk Pine Script®oleh FX365_Thailand36
short term reversal, MTF support & resistanceIt is an indicator that assists short-term reversal trading utilizing support and resistance. It is recommended to build a position after the buy / sell marker appears while checking the support and resistance. When building a position, it is important to have a short-term perspective without holding it for a long time. (Recommended period is 3 to 5 candlesticks) If the price moves in the opposite direction to the marker, hold it until the marker comes out again, or if it is out of support and resistance, cut the loss once and the marker again You can also wait for it to come out. Support and Resistance mainly uses Bollinger Bands and can use multi-timeframes. By default, the higher the support and resistance of the time axis, the thicker the line. Please send me a PM to access this indicator. Penunjuk Pine Script®oleh bitjiaozi9914
[M2J] Indicator | Turtle Atom Duck Signal Turtle Atom Duck shows potential buy and sell It consist of 3 indicators Turtle - Donchian Channel - bullish when price close above previous 1 bar high - bearish when price close below previous 1 bar low Atom - Bollinger Band - bullish when price close above upper band - bearish when price close below lower band Duck - Moving Average (Default 50-period EMA) - bullish when price close above moving average - bearish when price close below moving average When all 3 are bullish, buy signal appears When all 3 are bearish, sell signal appears Screener Turtle Atom Duck Example: FBMKLCI Technology Sector Health Sector TOPGLOV BINTAI XOX PRLEXUS JCY EURUSD XAUUSD Penunjuk Pine Script®oleh Mango2JuiceTelah dikemas kini 1010 1 K
Volatility Bands by DGTVolatility represents how large an asset's prices swing around the mean price, the degree of variation of a trading price over time, and is commonly measured with beta (β) coefficients, standard deviations (σ) of returns where tools such as Average True Range, Bollinger Bands, Keltner Channel, Squeeze Indicator, etc presents volatility concept Volatility often refers to the amount of uncertainty or risk related to the size of changes in a security's value. The higher the volatility, the riskier the security - the price of the security can change dramatically over a short time period in either direction. A lower volatility - security's value does not fluctuate dramatically, and tends to be more steady This study, Volatility Bands , attempts to present a way to measure and visualize volatility , using standard deviations (σ) and average true range indicator, and aims to point out areas that might indicate potential trading opportunities I will try to explain the usage with examples, same setup with different option selected as you may observe from the examples different setting may have advantages and disadvantages over one another, it is recommended to verify a trading setup with different available options. Additionally, It is recommended to use this indicator in conjunction with other technical indicators, or verify using chart/candle patterns. Below is an usage example using in conjunction with other indicator, in the given example “Neglected Volume by DGT” is selected Similarities and Differences Bollinger Bands depicts two standard deviations above and below a simple moving average, and Keltner Channel depicts two times average true range (ATR) above and below an exponential moving average Volatility Bands study combines the approach of both Bollinger Bands and Keltner Channel, with different settings and different visualization Default settings are one standard deviations and one time average true range (ATR) above and below 13 period exponential moving average. Setting can be adjusted by users but let me remind all testes are performed with the default settings. Mathematically expressed as Upper band area between “ema + stdev” and “ema + atr” Lower band area between “ema – stdev” and “ema – atr” A different display is added with the inspiration I get from one of the @quantgym ‘s study, many thanks @quantgym 😉 When difference band display is selected the study will reflect the area between “ema + stdev – atr” and “ema – stdev + atr”. As shown in the examples above Note: standard deviation calculation can be adjusted based on price action or its moving average. Other differentiation between BB and KC is with V-BANDS mostly we look for trade opportunities when price action move out of the bands and in most cases we assume market is consolidating when the price action is within the bands The other indicator that presents similarities to Volatility Bands is Squeeze Indicator, which measures the relationship between Bollinger Bands and Keltner's Channels to help identify consolidations and signal when prices are likely to break out. Mainly Volatility Bands is different version of Squeeze indicator, in fact the purpose is almost same but visualization is completely different. Additionally Volatility Bands Offers trading opportunities whereas Squeeze indicator only presents market states unless a momentum indicator is adapted to Squeeze indicator. Disclaimer: Trading success is all about following your trading strategy and the indicators should fit within your trading strategy, and not to be traded upon solely The script is for informational and educational purposes only. Use of the script does not constitute professional and/or financial advice. You alone have the sole responsibility of evaluating the script output and risks associated with the use of the script. In exchange for using the script, you agree not to hold dgtrd TradingView user liable for any possible claim for damages arising from any decision you make based on use of the script Penunjuk Pine Script®oleh dgtrdTelah dikemas kini 2323 1.3 K
bb5 1-15-240: why i upload this here This script is protected only. no need invitation. that is why i upload here. very good? but it works only for 1min, 15min and 4h candle. : what is this script This script show 5 BB. you can see arrow if price hit BB. 5 band, 5 arrow color. It has many option you can set. you can choose sma, ema, rma ..... and there are many option like that. you can change formular of BB to my own Band(Oringan). : you may wanna chack this out in this version, you can not use unit alert. for unit alert, use this Penunjuk Pine Script®oleh ducksjc33155
Bollinger Bands Strategy with Intraday Intensity IndexFor Educational Purposes. Results can differ on different markets and can fail at any time. Profit is not guaranteed. This only works in a few markets and in certain situations. Changing the settings can give better or worse results for other markets. This is a mean reversion strategy based on Bollinger Bands and the Intraday Intensity Index (a volume indicator). John Bollinger mentions that the Intraday Intensity Index can be used with Bollinger Bands and is one of the top indicators he recommends in his book. It seems he prefers it over the other volume indicators that he compares to for some reason. III looks a lot like Chaikin Money Flow but without the denominator in that calculation. On the default settings of the BBs, the III helps give off better entry signals. John Bollinger however is vague on how to use the BBs and it's hard to say if one should enter when it is below/above the bands or when the price crosses them. I find that with many indicators and strategies it's best to wait for a confirmation of some sort, in this case by waiting for some crossover of a band. Like most mean reversion strategies, the exit is very loose if using BBs alone. Usually the plan to exit is when the price finally reverts back to the mean or in this case the middle band. This can potentially lead to huge drawdowns and/or losses. Mean reversion strategies can have high win/loss ratios but can still end up unprofitable because of the huge losses that can occur. These drawdowns/losses that mean reversion strategies suffer from can potentially eat away at a large chunk of all that was previously made or perhaps up to all of it in the worst cases, can occur weeks or perhaps up to months after being profitable trading such a strategy, and will take a while and several trades to make it all back or keep a profitable track record. It is important to have a stop loss, trailing stop, or some sort of stop plan with these types of strategies. For this one, in addition to exiting the trade when price reverts to the middle band, I included a time-based stop plan that exits with a gain or with a loss to avoid potentially large losses, and to exit after only a few periods after taking the trade if in profit instead of waiting for the price to revert back to the mean.Strategi Pine Script®oleh SparkyFlaryTelah dikemas kini 22358
Matty Pips strategy 2For education purpose. Applied only for Matty Pips Strategy. Arrow will appear when bollingerband + sar + binary with temito are in the same OB/OS. Matty Pips main strategy is number 1. This is number 2Penunjuk Pine Script®oleh Edrul_Alejandro1111301
Bollinger Band x2Double BB with different deviation bb1: 34, 2 bb2. 34. 2.5. Las bb se pueden configurarPenunjuk Pine Script®oleh Edrul_Alejandro44
matty pips strategyFor education purpose. Applied only for Matty Pips Strategy. Arrow will appear when bollingerband + sar + binary with temito are in the same OB/OS.Penunjuk Pine Script®oleh Edrul_AlejandroTelah dikemas kini 8080404
A smoother Bollinger BandThe Bollinger Band is a popular indicator due to it's ability to accurately predict future ranges based on prior volatility. However the bands can fluctuate wildly as a result of acute changes to the price. This results in a channel that is sensitive though replete with sharp angles. Replacing the simple moving average basis line with a Tillson T3 moving average results in a smoother albeit slower basis line. Deriving the bands from partially smoothed data results in more continuous bands than those of the original equation.Penunjuk Pine Script®oleh Traaaderz68
GLANTALL AT A DEEP GLANCE Monitor the whole market at a glance Give your analysis double-dimensional depth With the help of this assistant , you can quickly aware about the various dimensions of the market and improve the quality of your trading experience. Everything is clear in the picture so I will avoid further explanation. All functions are controllable and highly customizable Get instantly and accurate report of Volume Volume changes Volume is higher or lower than average Volume significant increase 2 oscillators of your choice, each one at 4 time frame of your choice, at the same time (Stoch, RSI, StochRSI, MFI, StochMFI) Selected oscillators changes and direction Selected oscillators divergences with full coordinate Bollinger bands Bollinger bands middle line changes Bollinger bands width changes and direction Amount of volatility 4 moving averages as type as your choice at a same time (SMA, EMA, WMA, HMA) Mark up the moving averages as dynamic support or resistance Crosses of the 4 averages as type as your choice at a same time (SMA, EMA, WMA, HMA) (completely separately than above mentined MAs) with full coordinate More than 500 line code.. but Clean and Clear ! Gifts to all of you dear ones. Penunjuk Pine Script®oleh AlgorcaTelah dikemas kini 6692
Bollinger Bands Front WeightedBollinger Bands Front WeightedPenunjuk Pine Script®oleh DarthTrader2236
Bollinger Bands Double Time FramePut a second Bollinger Band set in 1 week. You can change itPenunjuk Pine Script®oleh caudebertTelah dikemas kini 91
Bolinger strategy v1Find lows based on divergence on bollinger bands. Works great on stocks and index, no success on forex. Different stock/index requires different values. Exit is not perfect, often on the safer side. Example settings: NASDAQ:OMXS30, 30m: 25 0.452 0.42 0.453 2 62 20 Lower bbrower = buys harder dips, too low will cause buy during fall. Higher bbrhigher = buys on lower dips Strategi Pine Script®oleh GoatftwTelah dikemas kini 99161