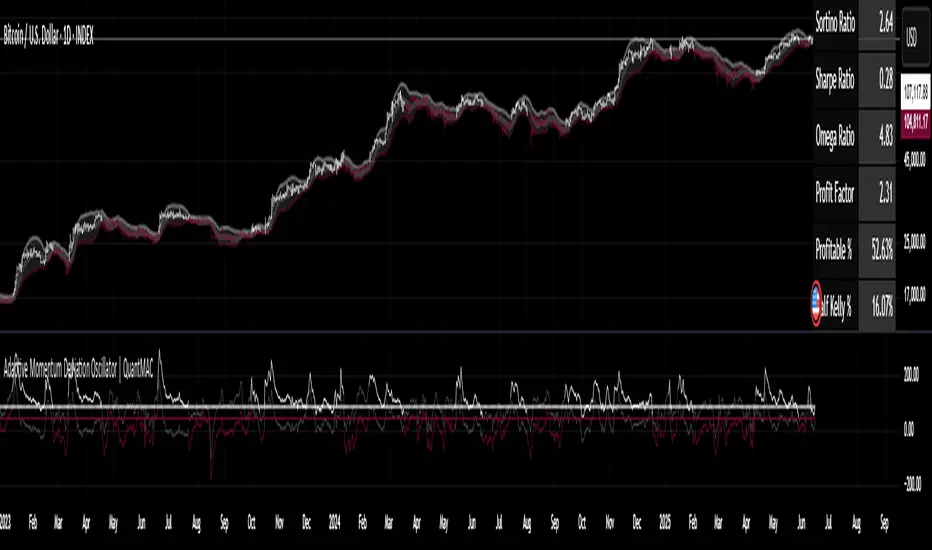
AMV Impulse AssistantThe AMV Impulse Assistant is a custom momentum tool designed to assess how aggressively price is moving relative to recent volatility. It combines Bollinger-based range analysis and fast-moving average behavior to generate a dynamic impulse score. This score helps identify when price action is potentially overextended or showing signs of unusual momentum — useful for pullback traders, breakout traders, and anyone managing entries during trending conditions.
What it does:
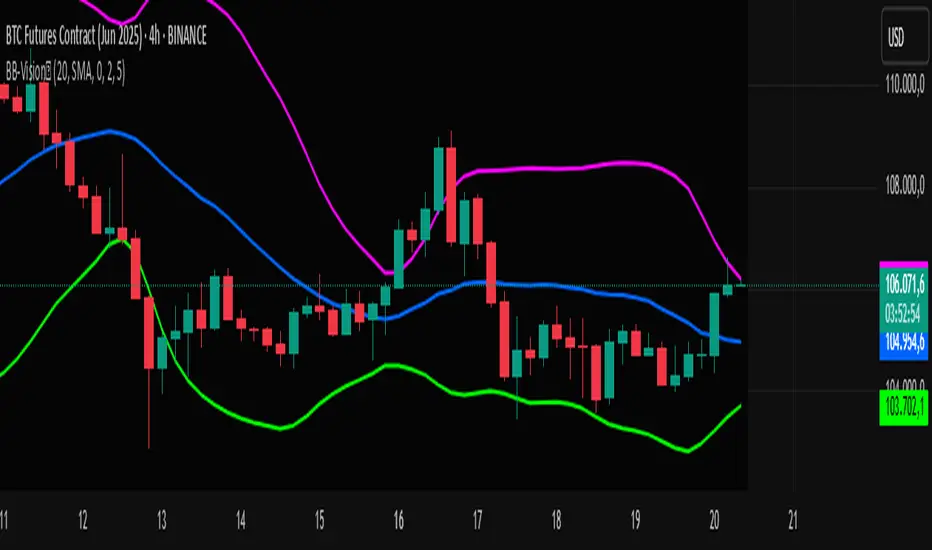
Tracks the relationship between a short WMA and Bollinger basis to gauge directional strength.
Measures price movement compression/expansion with a normalized Bollinger Width Percentile.
Combines both into a smoothed Impulse Score (from -10 to +10) that reflects how aggressively price is pushing in either direction.
Colors the score line and highlights background zones when momentum enters extreme ranges.
📈 Use case:
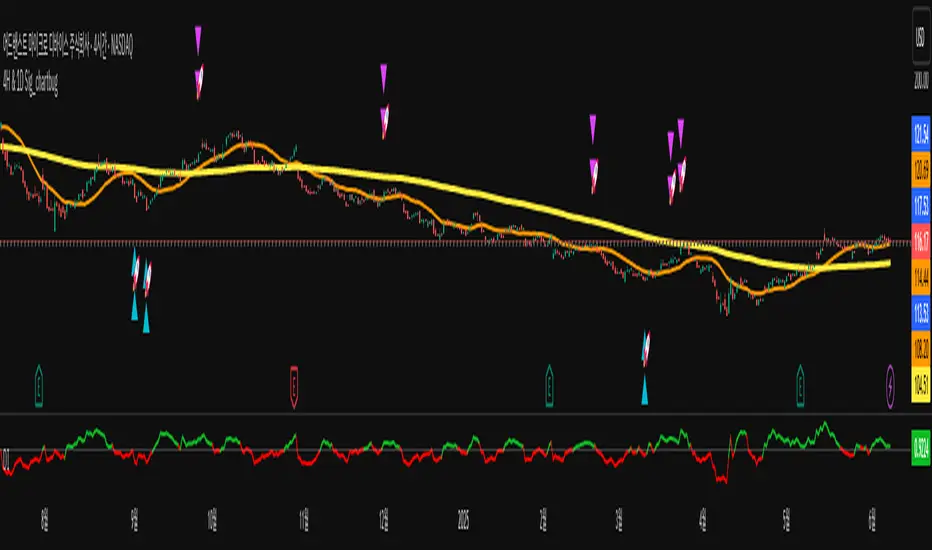
This tool is especially effective for day traders who need to quickly identify when price is moving abnormally fast — either as an exhaustion signal or confirmation of an aggressive continuation. It can be used to:
Confirm the end of a pullback.
Spot overly aggressive moves that may revert.
Avoid entries during neutral chop or volatility compression.
It is best used alongside your primary trend filters and execution tools as a supplementary confirmation.
Penunjuk Pine Script®