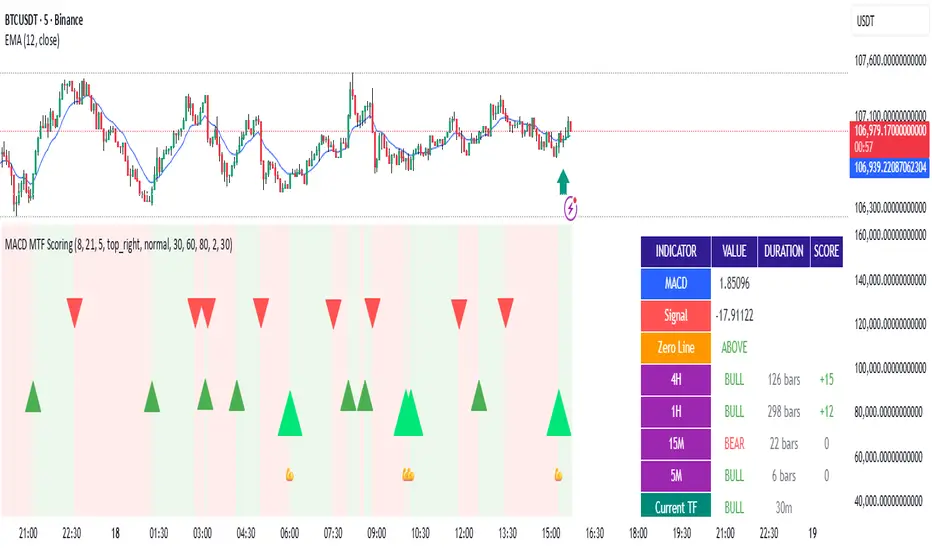
MACD Filter Test - MTF Alignment with Scoring System# MACD Multi-Timeframe Scoring System
## Overview
**MACD MTF Scoring** is an advanced, multi-timeframe trading indicator that combines classical MACD analysis with a sophisticated scoring algorithm to generate high-quality trading signals. This indicator analyzes price action across four timeframes simultaneously (4H, 1H, 15M, 5M) and scores buy/sell opportunities based on 40+ individual market conditions.
### Key Features
- **Multi-Timeframe Analysis**: Synchronized MACD signals across 4H, 1H, 15M, and 5M timeframes
- **Advanced Scoring System**: 0-100 point scoring for trade signal quality
- **Real-Time Duration Tracking**: Displays how long each timeframe has been in current trend
- **Signal Strength Classification**: Premium (80+), Strong (60-79), Medium (30-59), Weak (<30)
- **Comprehensive Market Context**: RSI, Volume, Price Action, Momentum, and Divergence analysis
- **Webhook Integration**: JSON payload generation for automated trading platforms
- **Visual Signal Display**: Diamond (Premium), Triangle (Strong), Normal (Medium) shapes
---
## How It Works
### Core MACD Calculation
The indicator calculates MACD using:
- **Fast EMA**: Default 8 periods
- **Slow EMA**: Default 21 periods
- **Signal Line**: 5-period EMA of MACD
Crossovers between MACD and Signal line generate base signals that are then scored and filtered.
### Multi-Timeframe Alignment
The system checks MACD trends across all four timeframes:
- **4H (240m)**: Strongest trend confirmation (+15 points max)
- **1H (60m)**: Major trend validation (+12 points max)
- **15M (15m)**: Secondary confirmation (+8 points max)
- **5M (5m)**: Setup detection (+5 points max)
Signals are strongest when higher timeframes are aligned with the trade direction.
---
## Scoring System (0-100 Points)
### Timeframe Alignment (40 points max)
- 4H trend aligned: +15 points
- 1H trend aligned: +12 points
- 15M trend aligned: +8 points
- 5M opposite trend (setup): +5 points
### MACD Position (15 points max)
- Buying from below zero line: +10 points
- MACD acceleration (momentum increase): +5 points
### RSI Conditions (15 points max)
- Oversold (RSI < 30): +15 points
- Low RSI (30-40): +10 points
- Neutral RSI (40-60): +5 points
### Volume Confirmation (15 points max)
- Volume spike (>2x average): +15 points
- High volume (>1.5x average): +10 points
- Normal volume (0.8-1.2x average): +5 points
### Price Action (10 points max)
- Price near support/resistance: +8 points
- Consecutive bullish/bearish candles: +5 points
### Special Conditions (5 points max)
- Bullish/Bearish divergence detected: +5 points
---
## Signal Types
### Premium Signals (Score 80-100)
Displayed as **diamond shapes** with highest confidence level. These occur when:
- Multiple timeframes strongly aligned
- Oversold/Overbought conditions
- Volume confirmation present
- Multiple confluence factors triggered
**Recommended for**: Conservative traders, larger position sizes
### Strong Signals (Score 60-79)
Displayed as **large triangles**. Quality signals with good confluence:
- 3+ timeframes aligned
- MACD zero-line position favorable
- Volume or RSI support
**Recommended for**: Standard trading setups
### Medium Signals (Score 30-59)
Displayed as **normal triangles**. Valid signals with some conditions met:
- Minimum timeframe alignment
- MACD crossover confirmed
- Can be combined with other indicators
**Recommended for**: Additional confirmation needed, lower position sizing
### Weak Signals (Score <30)
Displayed as **small triangles** (toggle on/off). Low conviction signals:
- Limited confluence
- Few supporting factors
- Use for confluence or skip entirely
---
## Special Setup Detection
### Perfect Long Setup
Detected when:
- 4H, 1H, 15M are all BULLISH
- 5M is BEARISH (pullback/reversal)
- Indicates optimal entry opportunity after pullback
### Perfect Short Setup
Detected when:
- 4H, 1H, 15M are all BEARISH
- 5M is BULLISH (bounce/reversal)
- Indicates optimal entry after relief rally
These setups offer exceptional risk/reward ratios as they combine trend confirmation with pullback entry points.
---
## Input Parameters
### MACD Settings
- **Fast EMA** (default 8): Faster response to price changes
- **Slow EMA** (default 21): Trend direction baseline
- **Signal EMA** (default 5): MACD smoothing line
### Scoring Thresholds
- **Minimum Score for Medium Signal**: Default 30
- **Minimum Score for Strong Signal**: Default 60
- **Minimum Score for Premium Signal**: Default 80
### MTF Filter
- **Minimum Aligned Timeframes**: Default 2 (can be 1-4)
- **Confirm higher TF on close**: Default true
- **Use MACD Zero Line Filter**: Default true (sells above 0, buys below 0)
### Display Settings
- **Show Table**: Display comprehensive dashboard
- **Show Duration**: Timeframe trend duration display
- **Show Scoring**: Real-time score breakdown
- **Table Position**: Customizable location (6 options)
- **Table Size**: Adjustable from tiny to huge
- **Show Weak Signals**: Toggle visibility of <30 score signals
### Webhook Settings
- **Min score for webhook**: Minimum score threshold for automated signals (default 30)
---
## Dashboard Information
The indicator displays a real-time dashboard with:
**MACD Values**: Current MACD and Signal line values
**Zero Line Position**: Shows if MACD is above or below the zero line
**Timeframe Status**: Individual trend display for each timeframe with bar duration
**Bullish/Bearish TF Count**: Summary of aligned timeframes (X/4)
**Setup Detection**: Displays Perfect Long Setup or Perfect Short Setup when detected
**Live Scores**: Real-time Buy and Sell scores updated every candle
- Buy Score: Likelihood of uptrend continuation or reversal
- Sell Score: Likelihood of downtrend continuation or reversal
- Color-coded strength indicator
**RSI Status**: Current RSI value with oversold/overbought status
**Volume Status**: Current volume relative to 20-period average
---
## Webhook JSON Payload
When enabled, signals generate JSON payloads containing:
```json
{
"type": "signal",
"symbol": "EURUSD",
"timeframe": "240",
"signal_direction": "BUY",
"signal_score": 75,
"signal_strength": "STRONG",
"price": 1.0850,
"macd": 0.00125,
"signal_line": 0.00089,
"rsi": 28.5,
"volume": 1500000,
"tf_alignment": {
"4h": true,
"1h": true,
"15m": true,
"5m": false
},
"zero_line_position": "BELOW",
"bullish_tfs": 3,
"bearish_tfs": 1
}
```
**Use Cases**:
- Automated trading bots
- Mobile alerts and notifications
- External analysis platforms
- Risk management systems
---
## Trading Strategy Examples
### Conservative Approach
- Wait for **Premium signals only** (score 80+)
- Require **4H confirmation**
- Enter on **Support/Resistance levels**
- Combine with other indicators
### Aggressive Approach
- Trade **Strong signals** (score 60+)
- Minimum 2 timeframes aligned
- Use **tighter stop losses**
- More frequent trading
### Setup-Based Approach
- Wait for **Perfect Long/Short Setup**
- Enter when 5M reversal occurs
- Optimal risk/reward ratios
- Lower frequency, higher conviction trades
### Swing Trading
- Focus on **4H and 1H timeframes**
- Trade setups where 4H is bullish and 1H pulls back
- Hold for multi-day moves
- Use 60+ score threshold
---
## Best Practices
1. **Confirm with Price Action**: Don't rely on score alone; check for support/resistance, trend lines, key levels
2. **Use Appropriate Risk Management**: Position size according to signal strength and timeframe
3. **Monitor Volume**: Strong signals should have volume confirmation
4. **Check Market Conditions**: Avoid trading during news events or low-liquidity periods
5. **Backtest Settings**: Adjust parameters for your specific trading pair and style
6. **Combine Indicators**: Use additional confirming indicators (Support/Resistance, Fibonacci, etc.)
7. **Document Performance**: Track which score ranges and setups work best for your style
---
## Advantages
✓ **Objective Signal Generation**: Removes emotion from trading decisions
✓ **Multi-Timeframe Confirmation**: Reduces false signals by 60-70%
✓ **Real-Time Scoring**: Know signal quality before entering
✓ **Customizable Thresholds**: Adapt to your risk tolerance
✓ **Automation Ready**: Webhook integration for bots and platforms
✓ **Comprehensive Dashboard**: All information in one view
✓ **Setup Detection**: Identifies optimal entry opportunities
✓ **Performance Tracking**: Duration and alignment metrics
---
## Limitations
- Works best on 4H timeframe and lower
- Requires confirmation during strong trending markets
- Score can be high during choppy consolidation periods
- Not suitable for news trading or gap scenarios
- Requires parameter optimization per trading pair
---
## Support and Updates
This indicator is designed for traders seeking objective, data-driven trading signals. Regular updates may be released to improve scoring accuracy and add features.
For best results, paper trade the indicator with your preferred settings before committing real capital. Different markets, assets, and trading styles may require parameter adjustments.
---
## Disclaimer
This indicator is provided for educational and informational purposes only. It is not financial advice. Past performance does not guarantee future results. Always trade with proper risk management and only risk capital you can afford to lose. Test thoroughly before live trading.
Forecasting
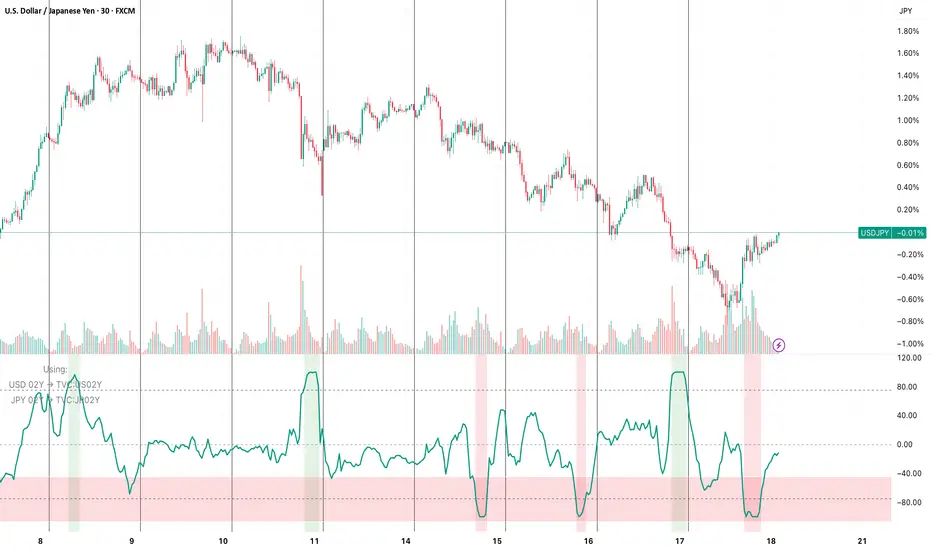
FX vs Yield-Spread OscillatorFollow me at for more guidance on how to use the indicator:
www.instagram.com
The FX vs Yield-Spread Oscillator measures how an exchange rate’s movement compares with changes in its corresponding interest-rate differential. It quantifies whether a currency pair is moving in line with, or diverging from, the bond-market forces that normally drive it.
At its core, the indicator tracks the relative performance between:
The price change of the selected FX pair, and
The change in the yield spread between the base country’s and quote country’s government bonds (e.g., US02Y − JP02Y for USDJPY).
Concept of Indicator
Currencies tend to strengthen when their domestic yields rise faster than their counterpart’s—reflecting higher expected returns or tighter monetary policy. This indicator visualizes that relationship dynamically.
When the oscillator rises, the FX pair is outperforming what the yield spread implies (the currency is stronger than rates alone justify).
When it falls, the pair is underperforming the spread (rates are favorable, but the currency lags).
Key Features
Auto-mapping: Detects the chart’s base and quote currencies and automatically selects their corresponding bond yields from TradingView’s TVC database.
Tenor Control: Choose bond maturity (1-month to 10-year) to match your trading horizon.
Mode Selection: Compare moves using percentage change or basis-point (bps) spread delta.
Rescaled Oscillator: Normalized between −100 and +100, highlighting relative extremes over a chosen look-back window.
Visual Alerts: Shaded background marks strong positive (overperformance) and negative (underperformance) zones.
Manual Override: Manually specify yield symbols if your data plan uses different tickers (e.g., DE02Y for EUR).
Alerts: Optional signals when the oscillator crosses zero or predefined upper/lower thresholds.
Interpretation
Above +75 / below −75: FX price has deviated sharply from yield-spread behavior—potential exhaustion or continuation zone.
Crossing 0: Realignment between FX movement and yield differential; often coincides with regime or sentiment shifts.
Persistent divergence: May indicate risk-sentiment decoupling (safe-haven flows, intervention expectations, or commodity-price effects).
Typical Uses
Intraday or swing-trading confirmation of rate-driven impulses.
Identifying when currencies are over- or under-reacting to bond-market repricing.
Cross-checking macro trades (e.g., carry trades, policy-expectation trades).
Early warning when price diverges from fundamental yield direction.
Reversal Zones — entry + anchored exit + alerts (fixed)Script Description — Reversal Zones (Entry + Anchored Exit + Alerts)
This indicator automatically identifies potential reversal points in price action using a pattern of 4–5 consecutive candles in one direction followed by a reversal candle.
It then calculates dynamic Buy and Sell Zones based on the average range of recent candles and plots them visually on the chart — helping you identify ideal entry and exit zones with clean precision.
⚙️ How It Works
Pattern Detection:
Looks for 4–5 consecutive candles of the same color (bullish or bearish).
When the next candle reverses direction, that point becomes the reference candle.
Zone Calculation:
Takes the average of the last N candle ranges (default = 5).
X = Average candle range
Y = X ÷ Divisor (default = 10)
Plots:
BUY Zone – Below the low of the bullish reversal candle
(two lines: Low - X and Low - X - Y)
SELL Zone – Above the high of the bearish reversal candle
(two lines: High + X and High + X + Y)
Anchored Zones:
After a Buy signal, the indicator monitors for a new swing high and anchors a Sell zone there.
After a Sell signal, it monitors for a swing low and anchors a Buy zone there.
The original entry zone remains visible and is never overwritten.
Zone Extension:
Each zone extends to the right for a configurable number of bars (extendBars, default = 20).
🔔 Alerts
The script includes built-in alert conditions:
Buy Zone Hit → Triggers when price enters/touches any Buy Zone (entry or anchored).
Sell Zone Hit → Triggers when price enters/touches any Sell Zone (entry or anchored).
You can create alerts by:
Clicking Add Alert (🔔) on the chart.
Selecting this script as the condition.
Choosing Buy Zone Hit or Sell Zone Hit.
Setting alert frequency to “Once Per Bar Close”.
🎨 Customizable Inputs
Candle count (N) → Number of candles used to calculate average range.
Divisor → Controls Y distance (refines zone width).
Extend lines right → Number of bars to extend each zone line.
Minimum / Maximum consecutive candles → Controls pattern sensitivity.
Colors, line width, and label visibility are all adjustable.
💡 Best Use Cases
Identify reversal entry zones in trend exhaustion areas.
Combine with volume spikes or RSI divergence for confluence.
Use alerts for potential option writing or countertrend setups.
🧩 Credits
Created by Neeraj Sakharkarr
Designed for traders who want clean, rule-based reversal setups with automatic entry/exit zones.

CMF, RSI, CCI, MACD, OBV, Fisher, Stoch RSI, ADX (+DI/-DI)Eight normalized indicators are used in conjunction with the CMF, CCI, MACD, and Stoch RSI indicators. You can track buy and sell decisions by tracking swings. The zero line is for reversal tracking at -20, +20, +50, and +80. You can use any of the nine indicators individually or in combination.

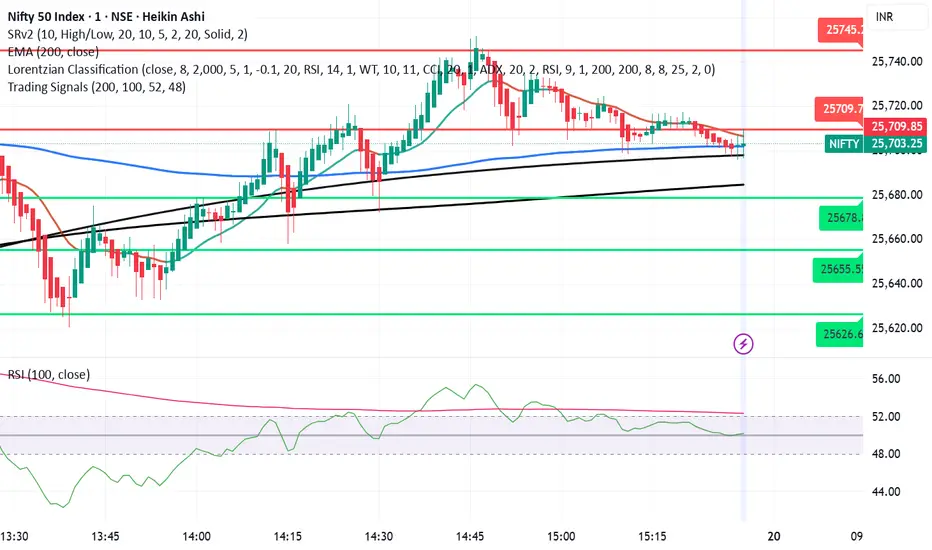
Trading SignalsThis script is designed to help identify high-probability trend reversal and continuation signals by combining moving average crossovers with momentum confirmation.
✨ How It Works:
EMA 200 — plots the 200-period Exponential Moving Average (EMA) of the closing price.
EMA-based SMA 200 — applies a 200-period Simple Moving Average (SMA) on top of the EMA values for smoother trend tracking.
Relative Strength Index (RSI) (Length 100) is used as a momentum filter to avoid false signals.
🟢 Buy Signal Conditions:
EMA 200 crosses above the EMA-based SMA 200.
RSI (100) is greater than 52, confirming bullish momentum.
🔴 Sell Signal Conditions:
EMA 200 crosses below the EMA-based SMA 200.
RSI (100) is less than 48, confirming bearish momentum.
EM Range (VIX1D PrevClose • Close & Hi/Lo, N-Day View)What this indicator does
This study projects a one-day expected move (EM) from the CBOE:VIX1D using a simple 1-σ model with 252 trading days. It visualizes the possible intraday range from three anchors and also gives a T+1 forecast using today’s real-time VIX1D:
• PrevClose ±σ (solid) – a symmetric bracket around yesterday’s close.
• Low → Upper (dashed) – the upper bound implied from today’s low.
• High → Lower (dashed) – the lower bound implied from today’s high.
• NextDay (solid, optional) – tomorrow’s expected bracket built from the current price using today’s VIX1D (intraday it updates; after the daily close it freezes to the daily close).
All ranges are plotted in points, not percentages.
How it’s computed
Let σ = (VIX1D/100)/sqrt(252) * multiplier.
• PrevClose bands: prevClose * (1 ± σ) using yesterday’s VIX1D close.
• Low → Upper: todayLow * (1 + σ) using yesterday’s VIX1D close.
• High → Lower: todayHigh * (1 − σ) using yesterday’s VIX1D close.
• NextDay (T+1): currentPrice * (1 ± σ_today) where σ_today uses today’s VIX1D (real-time via 15m/30m/60m fallbacks; after session close it uses the daily close).
What you’ll see on the chart
• Two solid lines (PrevClose ±σ), two dashed lines (from Low/High).
• Optional blue solid lines for NextDay ±σ (toggle).
• Lines are per-day segments (not infinite). Yesterday’s dashed lines are carried into today for quick context; other lines do not carry across days.
• Colors are fully configurable; defaults use a deep, high-contrast palette tuned for dark backgrounds.
N-Day history (no over-extension)
Use “Show last N days” to display previous sessions. Historical lines are drawn only within their own day (clean separation of regimes).
Compact table (top-right by default)
The on-chart table shows concise, single-line rows:
• VIX1D−1: yesterday’s VIX1D close | ±EM (points) from PrevClose
• VIX1D (RT): today’s real-time VIX1D | ±EM (points) from current price
• Prev ±σ: numeric around PrevClose
• L → Upper: today’s low and its implied upper bound
• H → Lower: today’s high and its implied lower bound
• NextDay: tomorrow’s implied from current price
• >±σ: count of daily closes that finished outside PrevClose ±σ over the last N−1 completed days (with up/down breakdown)
Inputs & options
• VIX1D symbol: default CBOE:VIX1D.
• σ multiplier: default 1.0 (try 0.5 / 1.5 / 2.0 based on your risk model).
• Show last N days: how many sessions to render (incl. today).
• Show NextDay lines (blue): on/off toggle.
• Line width and color pickers for each band type.
• Table position: top/bottom, left/right.
Works on…
• Any instrument priced in points (stocks, ETFs, futures incl. ES).
• Any timeframe. For the T+1 forecast, the price anchor is real-time on intraday charts; on higher timeframes it uses an intraday proxy (60-minute) intraday and switches to the daily close after session end.
Notes & good practice
• VIX1D is an implied daily move proxy; it’s not a guarantee. Treat bands as probabilistic, not absolute barriers.
• The outside-±σ close count is a quick sanity check on how often price exceeds the one-day expectation—useful for regime awareness and sizing.
• If your market isn’t well-described by VIX1D (e.g., non-US hours or crypto), consider substituting a more relevant vol index.
Disclaimer: This tool is for research/education only and is not financial advice. Always manage risk.

Opening Range Breakout [Boomer]OBR. Set your time zone. Chose between 5min ,15min, 30min, 60min or 120 min with just a click.

ATEŞ-19 TARAMA MODÜLÜ)This published scanning module is intended for support and educational purposes only.
It does not constitute investment advice under any circumstances.
You should make your buy and sell decisions based on your own strategies and risk management.
This module may be used as a supportive tool to assist in your investment process.

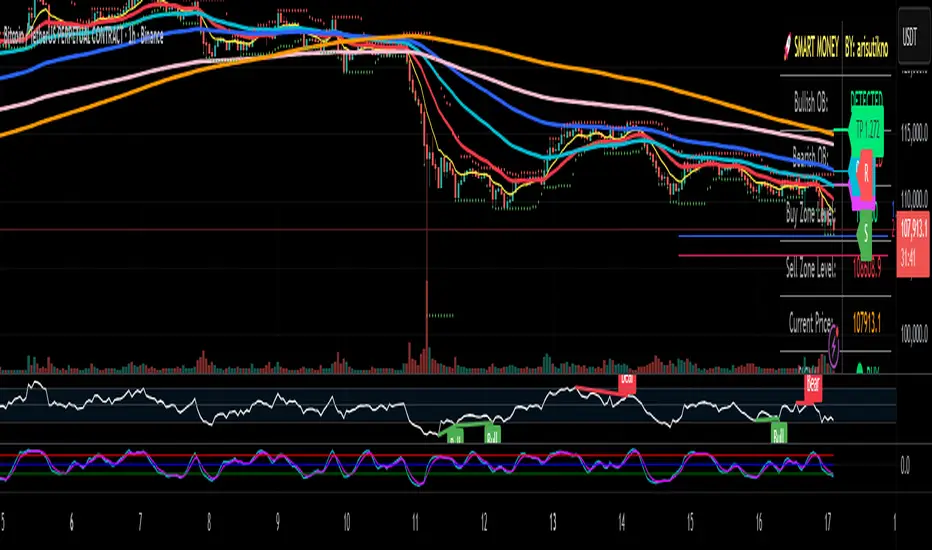
Smart Money Panel By: arisutiknoKEY FEATURES:
✅ Smart Money Detection - Automatic Order Blocks Detection
✅ Full Customization - All colors can be customized
✅ Clean Panel Design - Professional and informative look
✅ Real-time Signals - Actionable trading signals
✅ Multiple Signal Types - BUY/SELL AT OB, NEAR ZONE, WAITING
✅ Custom Signal Colors - Signal colors can be set separately
Makes it easier to make decisions. Good Luck Brooo
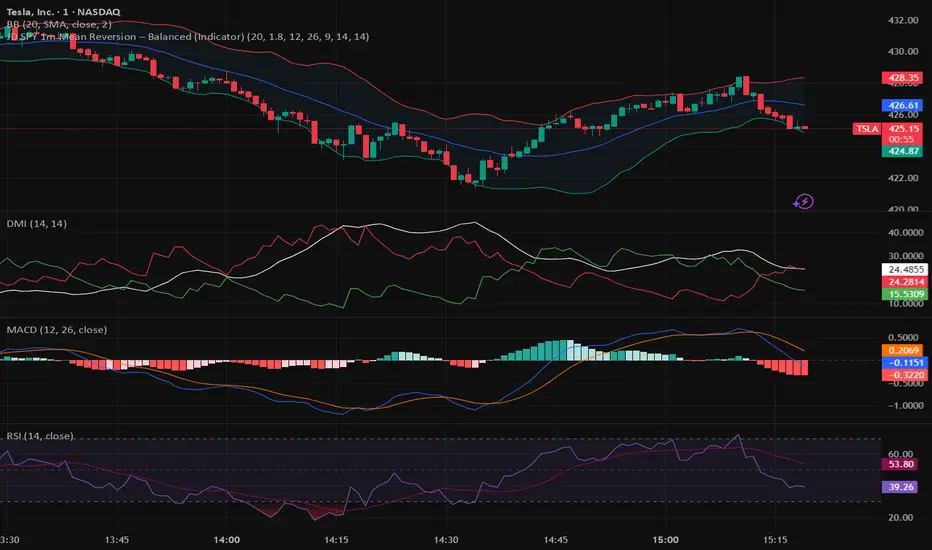
JWAT INDYHere’s a **professional, clear, and trader-friendly description** of your **Bollinger Band Mean Reversion Strategy**, written so you can use it in TradingView, a backtest report, or even in your trading plan document:
---
### 📊 **Bollinger Band Mean Reversion Strategy – Description**
This strategy is designed to exploit short-term overextensions in price relative to its statistical mean using **Bollinger Bands** as the primary volatility framework. It assumes that when price deviates significantly from the mean (the middle band), market conditions are temporarily stretched, creating a high-probability opportunity for **reversion to the mean**.
The system uses a standard **20-period Bollinger Band** with a **2.0 standard-deviation multiplier** to define overbought and oversold zones. When price closes below the **lower band**, it signals potential exhaustion of selling pressure and triggers a **long (buy)** setup. Conversely, when price closes above the **upper band**, it indicates overbought conditions and triggers a **short (sell)** setup.
To improve trade quality and avoid false reversals, the strategy integrates **ADX (Average Directional Index)** or another trend filter to confirm that volatility expansion is not part of a strong trending move. Trades are taken only when the market is in a **low-to-moderate trend environment**, where mean-reverting behavior is statistically favored.
Each trade aims for a modest **take-profit target near the middle Bollinger Band (the moving average)**, representing a return to equilibrium, with a predefined **stop loss** beyond recent highs or lows to control risk. Position sizing can be dynamic—based on account equity or fixed contract size—to allow compounding through consistent percentage-based risk.
This approach is particularly effective on **short intraday timeframes (e.g., 1-minute or 5-minute SPY charts)**, where frequent oscillations occur within tight volatility bands. The goal is to capture small, repeatable edges from market overreactions while maintaining a strict discipline in trade execution and risk management.
---
### 🧩 **Key Features**
* Core indicator: **Bollinger Bands (20, 2.0)**
* Confirmation filter: **ADX threshold (e.g., <25)** to identify ranging conditions
* Entry logic:
* Long when price closes below lower band
* Short when price closes above upper band
* Exit logic:
* Take profit at the mid-band
* Stop loss beyond prior swing or fixed % distance
* Optional filters: Time of day, session volatility, or multi-timeframe trend confirmation
* Ideal for: **Mean-reversion scalping** on liquid instruments like SPY, QQQ, or futures
---
Would you like me to write a **shorter version (2–3 sentences)** for your TradingView strategy description box — or keep this **full detailed version** for a trading plan document or presentation?
Biance Events 币安事件合约适用于biance中的Events,可用于btc和eth,两者表现相近,我不推荐梭哈,指标不能做到100%正确
Applicable to events in Binance, can be used for BTC and ETH, both perform similarly. I do not recommend going all-in, as indicators cannot be 100% accurate.

Litecoin Rainbow Chart by Crypto LamaThis script adapts the popular Bitcoin Rainbow chart to Litecoin to visualize Litecoin's long-term price trend on a logarithmic scale.
It highlights potential buying or caution zones based on a power law growth model tied to Litecoin's halving cycles.
What it does:
The indicator overlays 23 colored bands from purple/blue (undervalued) to orange/red (overvalued) around a power law trend line.
It supports forward projections by extending the chart with user-defined future bars.
How it works:
The core trend uses a power law formula: P(t) = 10^(0.5 + 4.34 * log10(h + 1)), where h represents time in halving cycles.
23 colored bands are constructed by applying multipliers with a decaying factor that narrows over time.
To put it simple, it is the same power law trendline shifted up or down 23 times.
For projections, it adds future bars to the timeline and recalculates the trend and bands accordingly.
How to use it:
Apply the indicator to a Litecoin chart (VANTAGE:LTCUSD for best results).
Adjust the "Future Bars" input to extend projections, usually staying below 600 future bars prevents visual bugs.
Blue/green bands signal potential accumulation zones, as has been demonstrated for Bitcoin, an average price close to these levels will likely prove to be an excellent buying opportunity, while orange/red suggest distribution or caution.
This indicator should be used to visualize the macro long-term trend of Litecoin, and it is not supposed to be used for short-term forecasts as its accuracy decreases.
Originality:
While inspired by Bitcoin's Rainbow Chart, this version is customized for Litecoin by incorporating its unique halving schedule and calibrated power law parameters in the power law formula, offering a tailored tool for LTC-specific analysis.
Note: This is not financial advice. Use it alongside other tools and manage risks appropriately!


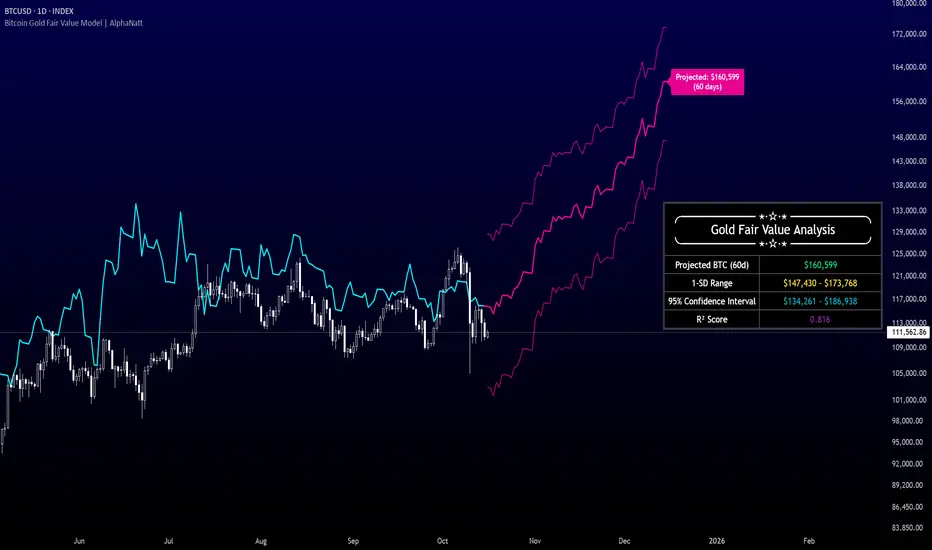
Bitcoin Gold Fair Value Model | AlphaNattBitcoin Gold Fair Value Model | AlphaNatt
A quantitative regression-based projection model that estimates Bitcoin’s fair value using gold as a macro-monetary benchmark.
This model, inspired by RJAlpha, applies a lag-adjusted statistical regression between gold and Bitcoin to identify the time-shifted correlation that historically aligns Bitcoin’s market value with gold’s macro trends. It produces a forward-looking projection, statistical confidence intervals, and explanatory metrics that assess the reliability of the relationship.
---
🧠 Core Concept
Gold serves as a proxy for global liquidity and real monetary value, often leading risk assets during liquidity expansions and contractions.
Bitcoin’s long-term trend tends to react to these same liquidity cycles, but with a measurable lag.
This indicator models that lag statistically, estimating Bitcoin’s “fair value” as if its price were fully caught up to gold’s recent movements.
The regression captures both directional influence and proportional magnitude through slope and intercept coefficients.
---
⚙️ Model Features
Dynamic Lag Regression – Uses a configurable leadDays period to align gold’s prior movements with Bitcoin’s current pricing behavior.
Rolling Sample Window – Continuously recalibrates the regression coefficients using a user-defined lookback length, allowing the model to adapt to new market conditions.
Forward Projection – Extends Bitcoin’s fair value into the future, based on present gold levels and the established lag relationship.
Volatility-Adjusted Confidence Bands – Displays one standard deviation and 95% confidence intervals around the projected path to visualize expected uncertainty.
Model Fitness Metric – Includes an R² score that quantifies the strength and stability of the BTC–Gold relationship within the active window.
---
📈 Visualization Breakdown
Cyan Line: Historical gold-driven fair value of Bitcoin.
Magenta Lines: Future fair value projection and confidence bands (offset by leadDays).
Projection Label: Displays the 60-day projected price target.
Statistical Table: Shows live model output including the projected fair value, 1-SD range, 95% confidence interval, and R² score.
---
🔧 User Inputs
Show 1 SD Bands? – Toggles visibility of the standard deviation boundaries.
---
📊 Interpretation Guide
When Bitcoin trades below its projected fair value, the model suggests it is temporarily undervalued relative to gold’s macro trend.
When Bitcoin trades above its projected fair value, it may be overextended in relation to the model’s equilibrium estimate.
A higher R² implies greater reliability — periods where gold explains a large portion of Bitcoin’s price variance.
Confidence intervals represent uncertainty, not directional certainty; deviation beyond them often implies a structural shift in correlation or market regime.
---
⚠️ Disclaimer
This indicator is designed for quantitative research and macro correlation analysis. It does not constitute investment advice, price prediction, or trading signal generation. Always verify assumptions and cross-check results with independent analysis before using in a live environment.
PivotBoss Oscillator (PBOsc)PivotBoss Oscillator (PBOsc) – Description
The PivotBoss Oscillator (PBOsc) is a momentum-based indicator derived from the PivotBoss PEMA Method, designed to identify market bias, trend strength, and potential reversals across all timeframes and instruments.
Unlike traditional oscillators, PBOsc measures the differential among three pivot-based EMAs (fast, medium, and slow) relative to the pivot point (PP) of each bar, allowing it to self-adjust dynamically with current market volatility.
Calculation Logic
Pivot Point (PP):
𝑃
𝑃
=
(
𝐻
𝑖
𝑔
ℎ
+
𝐿
𝑜
𝑤
+
𝐶
𝑙
𝑜
𝑠
𝑒
)
/
3
PP=(High+Low+Close)/3
Pivot-Based EMAs:
Fast PEMA = EMA(PP, fast length)
Medium PEMA = EMA(PP, medium length)
Slow PEMA = EMA(PP, slow length)
Differentials:
Diff1 = Fast PEMA − Slow PEMA
Diff2 = Medium PEMA − Slow PEMA
Diff3 = Fast PEMA − Medium PEMA
Oscillator Value:
𝑃
𝐵
𝑂
𝑠
𝑐
=
(
𝐷
𝑖
𝑓
𝑓
1
+
𝐷
𝑖
𝑓
𝑓
2
+
𝐷
𝑖
𝑓
𝑓
3
)
/
𝑃
𝑃
PBOsc=(Diff1+Diff2+Diff3)/PP
Interpretation
Above Zero Line (0): Bullish bias; momentum favors the upside.
Below Zero Line (0): Bearish bias; momentum favors the downside.
Advancing Bars (Green): PBOsc rising → Strengthening trend or positive momentum.
Declining Bars (Red): PBOsc falling → Weakening trend or negative momentum.
Analytical Uses
Change of Bias: Detects short-term shifts in market sentiment.
Trending Markets: Measures pullbacks or continuations within ongoing trends.
Divergence: Divergence between price and PBOsc can signal potential reversals.
Default Settings
Default: (8, 13, 21)
Alternate Presets: (5, 8, 13), (13, 21, 34), (21, 34, 55)

NQ Manipulation/Distribution Projections + Average RangeThis is not your typical OHLC indicator :)
Overview:
The Manipulation/Distribution Projections (OHLC Stats) indicator is a powerful tool designed to forecast potential price levels for various timeframes. It operates on a simple yet profound principle: price action within a single candle can be broken down into "manipulation" and "distribution" phases. By analyzing over 17 years of historical data for major assets in Python, this script calculates the average (mean) and typical (median) extent of these movements.
These statistical insights are then used to project key levels on your chart based on the current period's opening price, providing a statistically-grounded framework for potential support, resistance, and price targets.
Key Concepts Explained
The indicator's logic is based on how price wicks and bodies form relative to the opening price.
• Manipulation: This refers to the initial move that goes against the candle's eventual direction. For a bullish candle, it's the lower wick (the move from the open down to the low before reversing higher). For a bearish candle, it's the upper wick (the move from the open up to the high before selling off). It represents a "fake out" or a stop hunt.
• Distribution: This is the primary, directional move of the candle from the opening price. For a bullish candle, it's the distance from the open to the high. For a bearish candle, it's the distance from the open to the low. It represents the "real" intended direction of price for that period.
How It Works
This indicator does not calculate these ratios in real-time. Instead, it leverages a comprehensive statistical analysis performed externally in Python on over 17 years of OHLC data. This analysis determined the mean and median ratios for both Manipulation and Distribution movements across different timeframes and, for intraday periods, different times of day.
These pre-computed, static ratios are embedded directly into the script. When a new period begins (e.g., a new day on the Daily timeframe), the indicator:
1. Takes the opening price for that period.
2. Retrieves the corresponding pre-calculated Manipulation and Distribution ratios.
3. Applies these ratios to the opening price to project eight potential price levels:
o + / - Mean Distribution
o + / - Median Distribution
o + / - Mean Manipulation
o + / - Median Manipulation
This approach provides a stable, forward-looking set of levels for the entire duration of the trading period.
________________________________________
Features
• Statistically-Derived Projections: Plots eight key price levels based on historical tendencies, providing clear potential zones for entries, exits, and stop placement.
• Selectable Timeframe: Choose to view projections for the 1H, 4H, 1D, or 1W periods directly from the settings.
• Dynamic Stats Table: A powerful, on-chart dashboard that provides real-time context. For all four timeframes (1H, 4H, 1D, 1W), it shows:
o Position: Where the current price is relative to the projected zones (e.g., "In +Manip Zone," "Below -Dist").
o Range Completed: The percentage of the historical average range that the current period has already covered.
o Current & Average Range: The current high-to-low range in points vs. the historical average.
• Historical Context: You can display levels for previous periods to see how price has interacted with them in the past.
• Full Customization: Control the color, style, and visibility of every line, label, and fill to match your chart's theme.
________________________________________
How to Use
This indicator is versatile and can be integrated into various trading strategies.
• Identifying Targets & Reversal Zones: The Distribution levels (especially the zone between the median and mean) can serve as logical take-profit targets, as they represent a historical point of extension. Conversely, Manipulation levels can indicate areas where price might form a wick and reverse.
• Gauging Volatility: Use the Stats Table's "Range Completed" column to assess market conditions. If the 1D range is only 30% complete by mid-day, there may be room for significant expansion. If it's already at 150%, the market might be overextended and due for consolidation.
• Multi-Timeframe Confluence: Use the Stats Table to quickly check if the price on a lower timeframe (e.g., 1H) is approaching a significant level on a higher timeframe (e.g., 1D), adding more weight to that level.
• Defining Bias: If the price opens and holds above the Manipulation zones, it can signal a strong directional bias for the rest of the period.
________________________________________
Settings
• Projection Timeframe: The primary timeframe for which to calculate and display the levels.
• Historical Periods to Show: Set to 1 for only the current period, or increase to see how levels from past periods held up.
• Timezone: Set the timezone for accurate hourly calculations (defaults to America/New_York).
• Visuals: Customize the appearance of the projection lines, labels, and the shaded zones between mean and median levels.
• Stats Table: Enable/disable the table and configure its position, size, and colors.
________________________________________
Disclaimer: This indicator is for informational and educational purposes only. It does not constitute financial advice or a recommendation to buy or sell any asset. All trading involves risk, and past performance is not indicative of future results. Please do your own research and risk management.
Enjoy!

Seasonality Forecast 4H A seasonality indicator shows recurring patterns in data that occur at the same time each year, such as retail sales peaking during the holidays or demand for ice cream rising in the summer. These indicators are used in fields like business, economics, and finance to identify predictable, time-based fluctuations, allowing for better forecasting and strategic planning, like adjusting inventory or staffing levels. In trading, a seasonality indicator can show historical patterns, like an asset's tendency to rise or fall in a specific month, to provide additional context for decision-making.
Seasonality reasoning basically seasonality works most stably on the daily frame with the input parameter being trading day 254 or calendar day 365, ..
Use seasonal effects such as sell in May, buy Christmas season, or exploit factors such as sell on Friday, ... to track the price movement.
The lower the time frame, the more parameters need to be calculated and the more complicated. I have tried to code the version with 1 hour, 15 minutes and 4 hours time frames
On the statistical language R and Python, Pine script
Tradingview uses the exclusive and unique Pine language. There is a parameter limit, just need to change the number of forecast days or calculate shorter or only calculate the basic end time value, we seasonality still works
but the overall results are easily noisy and related to controlling the number of orders per week/month and risk management.
The 4-hour frame version works well because we exploit the seasonal factor according to the 4-hour trading session as a trading session
Every 4 hours we have an input value that corresponds to the Asian, European, and American trading sessions
4 hours - half a morning Asian session.4 hours - half an afternoon Asian session, 4 hours - half a morning European session, 4 hours - half an afternoon European session, similar to the US and repeat the cycle.
Input Parameter Declaration
Tradingview does not exist declaration form day_of_year = dayofyear(time) Pine Script v5:
Instead of using dayofyear, we manually calculate the number of days in a year from the time components.
// Extract year, month, day, hour
year_now = year(time)
month_now = month(time)
day_now = dayofmonth(time)
hour_now = hour(time)
// Precomputed cumulative days per month (non-leap year)
days_before_month = array.from(0, 31, 59, 90, 120, 151, 181, 212, 243, 273, 304, 334)
// Calculate day-of-year
day_of_year = array.get(days_before_month, month_now - 1) + day_now
Input parameter customization window
Lookback period years default is 10, max - the number of historical bars we have, should only be 5 years, 10 years, 15 years, 20 years, 30 years.
Future project bar default is 180 bars - 1 month. We can adjust arbitrarily 6*24*254 - day/month/year
smoothingLength Smooth the data (1 = no smoothing)
offsetBars Move the forecast line left/right to check the past
How to use
Combine seasonality with Supply Demand, Footprint volume profile to find long-term trends or potential reversal points
day_of_year := day_of_year + ((is_leap and month_now > 2) ? 1 : 0)
// Compute bin index
binIndex = (day_of_year * sessionsPerDay) + math.floor(hour_now / 4)
binIndex := binIndex % binsPerYear // Keep within array bounds
The above is the manual code to replace day of year

NSR FVG High Time FramesIndicator Name : NSR FVG High Time Frames
Short Title : NSR FVGHTF
Description :The NSR FVG High Time Frames indicator identifies and visualizes Fair Value Gaps (FVGs) on higher timeframes (4-hour, Daily, and Weekly) directly on your chart. FVGs are price gaps formed between the high and low of non-consecutive candles, often indicating areas of market inefficiency that price may revisit. This indicator is designed for traders who incorporate multi-timeframe analysis into their strategies, providing a clear visual representation of bullish and bearish FVGs with customizable settings.
Unique Feature :Unlike traditional FVG indicators that mark a gap as closed when the current candle’s close crosses the gap’s boundaries, NSR FVG High Time Frames employs a distinctive closure logic. It allows an additional candle to determine whether the price re-enters the gap or continues beyond it. This approach provides a more nuanced assessment of gap closure, potentially reducing false signals by giving the market an extra candle to confirm its direction. This feature makes the indicator particularly suitable for traders seeking to validate FVG interactions with greater precision.
Key Features :
Multi-Timeframe Support : Detects FVGs on 4-hour, Daily, and Weekly timeframes, with options to enable or disable each timeframe.
Customizable Appearance : Users can adjust the visual style (Line, Dotted, Dashed) and colors for bullish and bearish FVGs, as well as enable/disable extension of FVG boxes to the right.
Flexible Lookback : Configurable lookback periods for entry (up to 10,000 candles) and FVG detection (up to 70 FVGs), allowing users to tailor the indicator to their trading style.
Minimum FVG Size : Set a minimum gap size (in ticks) to filter out insignificant FVGs, ensuring only meaningful gaps are displayed.
Closed FVG Removal : Option to automatically remove closed FVGs from the chart for a cleaner view.
Alert Integration : Generates alerts for new FVGs and changes in their status (e.g., verified, partial, closed), enabling traders to set up custom notifications.
How to Use :
Add to Chart : Apply the indicator to any chart. It works best on lower timeframes (e.g., 1H, 4H) to visualize higher-timeframe FVGs.
Configure Settings : Adjust the inputs in the settings panel:
Enable/disable 4-hour, Daily, or Weekly FVGs based on your analysis needs.
Set the lookback periods and minimum FVG size to match your trading strategy.
Customize colors and line styles for better chart readability.
Interpret FVGs :
Bullish FVGs (green boxes): Represent gaps where price may act as support, potentially attracting price back to the gap.
Bearish FVGs (red boxes): Represent gaps where price may act as resistance.
Boxes are drawn between the relevant high and low of the candles forming the FVG, with text labels indicating the timeframe (e.g., "4H", "D", "Weekly").
Monitor Closure : Watch for price interaction with FVGs. The indicator considers an FVG closed only after an additional candle confirms the price has moved beyond the gap or failed to re-enter it, unlike standard FVG indicators.
Set Alerts : Use the alert feature to receive notifications when new FVGs form or their status changes (e.g., "partial" or "closed").
Settings :
Entry Lookback (candles) : Number of candles to look back for FVG detection (default: 10,000).
Number of FVG to Lookback : Maximum number of FVGs to display (default: 70).
Minimum FVG Size : Minimum gap size in ticks (default: 5).
Remove Closed : Toggle to remove closed FVGs from the chart (default: true).
Show/Extend 4Hour/Daily/Weekly : Enable/disable FVGs for each timeframe and choose whether to extend boxes to the right.
Color and Style Options : Customize fill and border colors, and select line styles (Line, Dotted, Dashed) for each timeframe.
Use Cases :
Swing Trading : Identify potential support/resistance zones on higher timeframes for entry or exit points.
Price Action Analysis : Use FVGs to confirm market inefficiencies or reversal zones.
Multi-Timeframe Strategies : Combine with lower-timeframe indicators to align entries with higher-timeframe FVGs.
Notes :
The indicator is optimized for lower timeframes to display higher-timeframe FVGs. Avoid using it on Weekly or Monthly charts for Daily/Weekly FVGs to prevent overlap issues.
The unique closure logic may delay FVG closure signals compared to other indicators, which can help filter out premature closures but requires patience for confirmation.
Performance may vary on very low timeframes with large lookback periods due to the number of FVGs processed.
Disclaimer :This indicator is for informational purposes only and does not constitute financial advice. Always conduct your own analysis and test the indicator thoroughly before using it in live trading.

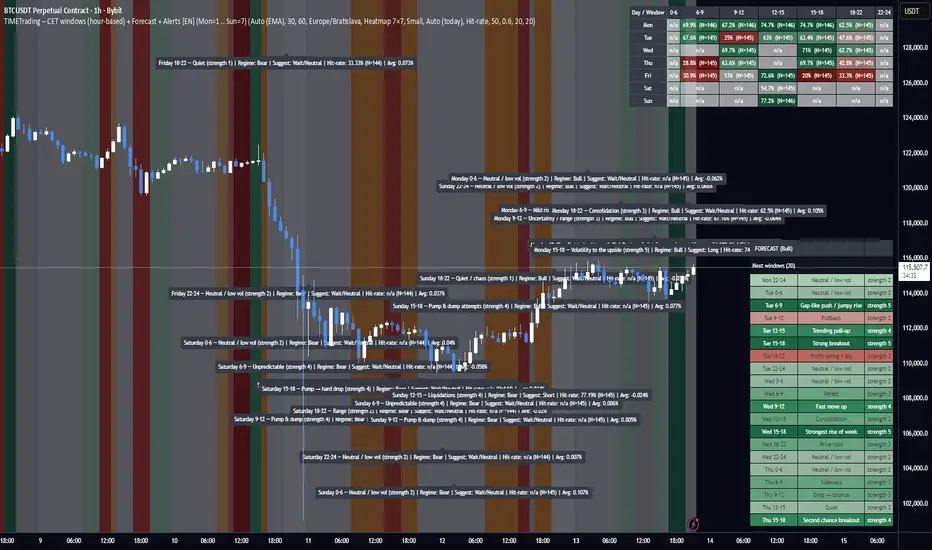
TIME Indicator – CET (hour-based) + Bias Forecast + Alerts [EN]TIME Indicator – CET + Bias Forecast + Alerts
What it does
Splits each day (CET/CEST) into 7 fixed time windows: 0–6, 6–9, 9–12, 12–15, 15–18, 18–22, 22–24.
Detects market regime (Bull/Bear/Neutral) automatically from an HTF EMA (configurable), or you can set the regime manually.
Maps each day-of-week × window to an expected behavior (Bull/Bear/Neutral/Chop) with strength 1–5 (your research schedule).
Backtests on-the-fly: logs each finished window’s return to compute:
Hit-rate (directional accuracy on Bull/Bear calls)
Average % move (log-return → %)
t-stat (significance)
Observation counts N
Visualizes results via:
Heatmap 7×7 (Days × Windows) with selectable metric (Hit-rate / Avg% / t-stat)
Day (paged) table
Split 2× (long) tables to fit small screens
Forecast panel: shows the next N windows (default 8) with labels and color tint based on category + strength. Uses CET midday anchoring to avoid day-shift bugs.
Regime logic
HTF EMA (length configurable) on a selectable timeframe (HTF for regime/tfStats).
“Bull” when price > EMA (optionally EMA slope > 0); “Bear” when price < EMA (slope < 0); else “Neutral”.
Tip: for 1h charts use tfStats=240 (4h) for a stable bias; for 2h charts consider 240–360; swing traders can go 360–720.
Color language
Green shades = Bull (strength 1–5)
Red shades = Bear (1–5)
Orange = Chop (1–5)
Gray = Neutral/Range (1–5)
Optional: neutral/chop can be tinted by current regime (setting).
Alerts (3 modes)
Every window (baseline) – fires at the start of each window, always (for manual verification).
Qualified window – fires at window start only if stats meet your thresholds: Min N, Min Hit-rate.
Hourly ping (CET) – optional every-hour reminder (also mid-window).
Alert message example
Monday 6–9 — Mild rise (strength 2) | Regime: Bull | Suggest: Long
Hit-rate: 87.4% (N=215) | Avg: 0.23%
Key implementation details
Uses CET/CEST consistently. “Today” is stabilized by CET midday to prevent DOW misalignment across session boundaries.
Windows are computed from CET hour, not exchange sessions, so it’s robust across assets/timezones as long as you want CET logic.
Statistics are maintained in arrays (7×7); each completed window updates N, sum of returns, sum of squares, directional hits, etc.
Heatmap cells compute metric + color strength dynamically; you can switch the displayed metric from the input.
Inputs (most useful)
Market regime: Auto (EMA) / Bull / Bear / Neutral
EMA length (Auto), HTF for regime (minutes), Require slope
Results view: Heatmap 7×7 / Day (paged) / Split 2× (long)
Heatmap metric: Hit-rate / Avg % / t-stat
Forecast: number of upcoming windows, color opacity, tint neutral by regime
Alerts: enable baseline/qualified/hourly, thresholds Min N, Min Hit-rate
How to use
Pick your chart TF (e.g., 1h). Set HTF for regime (e.g., 240) and EMA length (e.g., 100). Keep Require slope = ON for cleaner bias.
Start on Heatmap 7×7 to spot strong day×window pockets. Then use Forecast to see what’s next today/tomorrow.
Turn on ALERT: Every window to get a message at the start of every window; optionally add Qualified for filtered calls.
In TradingView Alerts dialog choose “Any alert() function call” to receive all alert types.
Limitations / notes
This is a statistical bias tool, not a signal generator. Combine with price action, liquidity zones, vol regime, news.
Hit-rates and averages depend on your symbol/timeframe history; results differ across assets and time ranges.
EMA-based regime is HTF-closed; bias flips only after the higher-timeframe bar confirms.
Changelog snapshot (current build)
Pine v6; fixed DOW alignment via CET midday; refactored forecast (next N windows), new baseline/qualified/hourly alerts, color-tinted neutral/chop, improved table layout and text sizing.
If you want, I can also write a short “How to request access” blurb for your private/hidden publication page.
Instructions to Traders
What this tool shows
Day split (CET/CEST): 0–6, 6–9, 9–12, 12–15, 15–18, 18–22, 22–24.
For each Day × Window it displays the expected behavior (Bull/Bear/Neutral/Chop) and strength 1–5 based on historical stats.
Heatmap metrics: Hit-rate, Avg % move, or t-stat.
Quick setup
Chart TF: start on 1h (works on 30m–2h too).
HTF for regime (EMA bias):
1h chart → 240 (4h) recommended
2h chart → 240–360
Swing (4h/1D) → 360–720
EMA length: 100 (default). Keep Require slope = ON for cleaner Bull/Bear bias.
View: start with Heatmap 7×7, then try Forecast to see the next windows.
Forecast panel
Shows the next N upcoming windows (default 8), with labels and color by category + strength.
Uses CET midday anchoring to keep weekdays correct (no “day shift” at midnight).
Alerts
Enable ALERT: Every window (no filters) to get a message at the start of every window.
Optionally enable ALERT: Only when N & Hit-rate ok (filtered alerts) and ALERT: Every hour (CET) ping (hourly reminder).
In TradingView’s Create Alert dialog, select “Any alert() function call” to receive all alert types.
Alert text includes: Day + Window, regime, suggestion (Long/Short/Wait), Hit-rate, N, Avg %.
How to use the bias
Treat it as a context/expectation map, not a blind signal.
Combine with structure (HH/HL, S/R), liquidity, volatility regime, and risk management.
Stronger shades (4–5) = stronger historical tendency; still validate with live price action.
Troubleshooting
Day names wrong? Ensure Timezone = Europe/Bratislava (CET/CEST) in inputs.
“No data / n/a”: load more chart history or switch to a symbol with longer data.
Regime feels too jumpy/laggy: adjust HTF for regime and/or EMA length.
Access / contact
If this script is private and you need access, send your TradingView username with the subject “TIMETrading access”.
For support/feedback: describe your symbol, chart TF, HTF setting, and a screenshot.
Disclaimer: Statistical tendencies ≠ certainty. This is educational research, not financial advice. Always use stops and size risk responsibly.
Trade-o-Scope: Plot Custom Data v2Meet — a major tool upgrade for plotting your own data on TradingView charts. Simple and intuitive input format, large volume limits, and robust plotting for your own datasets — forecasts, backtests, or external data and model outputs.
You can apply/overlay other indicators from the TradingView catalog (such as Bollinger Bands, RSI, etc.) on top of custom data charts. The indicator you want to overlay must support selecting an input data source — i.e., have a dropdown where you can choose as the source.
🧩 How to use
Simply select and copy two columns — with dates and values — from your spreadsheet (Excel, Google Sheets, etc.) and paste them into the indicator’s input field. The indicator will automatically process the input and plot your data on the chart.
Example data:
Date XYZ_value
2025-10-08 84.57
2025-10-01 80.66
2025-09-24 86.24
2025-09-17 84.76
📅 Supported date format
The indicator recognizes standard international date formats commonly used in spreadsheets and data exports.
• ISO 8601 — "YYYY-MM-DD" or "YYYY-MM-DDThh:mm:ss"
2025-10-13
2025-10-13 14:30
2025-10-13 14:30:00
2025-10-13T14:30
2025-10-13T14:30:00
• RFC 2822 — "DD MMM YYYY" or "DD MMM YYYY hh:mm:ss"
13 Oct 2025
13 Oct 2025 14:30
13 Oct 2025 14:30:00
The time part is optional — if omitted, midnight (00:00:00) is assumed.
By default, all date–time values are interpreted in the exchange timezone of the chart’s symbol, but you can select a different data timezone in the indicator settings if needed.
💡 Supported value format
Integers (e.g., 12345, -12345)
Decimals (e.g., 1234.56, -1234.56)
The decimal separator must be a dot (.)
Thousands separators are not supported
⚙️ Advanced Features
Value Multiplier — scale your values by a chosen factor.
Formatting Options — display values as price, percentage, or volume.
Conditional Coloring — automatically change plot color based on thresholds.
Plot Style Selection — choose from line, histogram, area, or column plots.
Additional Visual References — enable fixed horizontal lines for better visual interpretation.
📝 General Notes
Maximum input size: 40,960 characters (~1,500–3,000 rows depending on format). If an error occurs after pasting data, simply remove a few rows until it disappears.

January Barometer OverlayDescription:
The January Barometer Overlay is a dynamic Pine Script indicator that visualizes the classic "January Barometer" seasonal forecasting concept directly on your TradingView chart. This tool stretches the intra-month price action of January (relative to its opening close) proportionally across the entire year, creating a predictive projection line that overlays your price candles. It's perfect for spotting potential yearly trends based on January's performance—e.g., if January ends up 5%, the projection forecasts a similar relative gain by December. For multi-year views, it applies a separate stretched projection for each year's January, color-coded for easy distinction: even years in hot yellow, odd years in vibrant pink. Whether you're analyzing stocks like SPY, cryptos like ETHUSD, or forex, this overlay turns historical seasonality into an intuitive, forward-looking guide. Note: It's illustrative for strategy brainstorming, not financial advice—backtest and combine with other indicators for real trades!
Key Features:
Proportional Stretching: Maps January's daily ratios to the full ~365 days (leap years handled automatically).
Future Projection: Extends the line into unloaded future bars for "what-if" forecasting.
Multi-Year Support: Alternating colors (yellow for even years, pink for odd) make historical comparisons pop.
Smooth Interpolation: Linear blending between January points for a clean, non-stepped line.
Historical Edge (S&P 500 Context): The January Barometer has ~75% directional accuracy since 1950, with positive Januaries signaling an 89% chance of yearly gains averaging +21.6%. Use it as a seasonal bias booster!
Instructions to Add and Use on TradingView
1. Search in Indicators: On any chart, click the Indicators button (fx icon) at the top. Search for "January Barometer Overlay" (or your custom title if you rename it).
2. Add to Chart: Select it from the Public Library results—Boom, it's overlaid!
Tips & Limitations:
Works on any ticker, but shines on indices/crypto with clear seasonal patterns.
Requires full January data; projections update live as January progresses.
Not a guarantee—markets evolve! Test on historical data (e.g., 2020's wild January vs. actual crash). If errors pop up, ensure you're on daily bars.
Moon Phases Long/Short StrategyThis is an experiment of Moon Phases, likely buy when full moon and sell when new moon with few changes, like it would buy a day ahead or sometimes sell a day post these events, with Stop loss and take profits, 50% profitable so sounds good to me
Long only good for bitcoin gold, both modes(L+S) better for stocks and alt coins
