Moving CovarianceCo-variance is a representation of the average percent data points deviate from there mean. A standard calculation of Co-variance uses One standard Deviation. Using the empirical rule, we can assume that about 68.26% of Data points lie in this range.
The advantage to plotting co variance as a time series is that it will show you how volatility of a trailing period changes. Therefore trend lines and other methods of analysis such as Fibonacci retracements could be applied in order to generate volatility targets.
For the purpose of this indicator I have the mean using a vwma derived from vwap. This makes this measurement of co-variance more sensitive to changes in volume, likewise are more representative a change in volatility, thus giving this indicator a "leading aspect".
Indicators

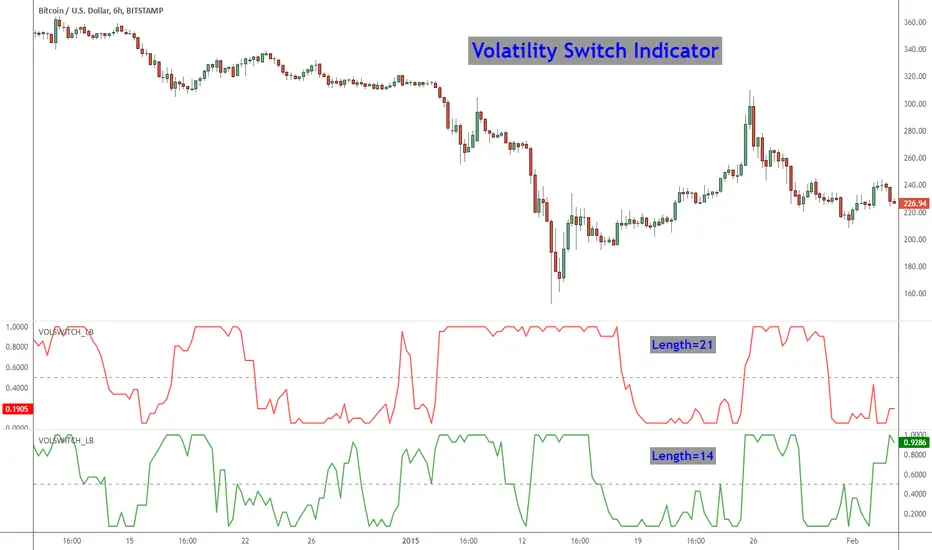
Volatility Switch Indicator [LazyBear]The Volatility Switch (VOLSWITCH) indicator, by Ron McEwan, estimates current volatility in respect to historical data, thus indicating whether the market is trending or in mean reversion mode. Range is normalized to 0 - 1.
When Volatility Switch rises above the 0.5 level, volatility in the market is increasing, thus the price action can be expected to become choppier with abrupt moves. When the indicator falls below the 0.5 level from recent high readings, volatility decreases, which may be considered a sign of trend formation.
Trading strategy as suggested by Ron McEwan is:
- If VOLSWITCH is less than 0.5, volatility decreases, which may be considered a sign of trend formation
- If VOLSWITCH is greater than 0.5, market is in high volatility mode. Can be choppy. Use RSI to look for OB/OS levels.
I have implemented support for 2 lengths (14 and 21) Note that, Pine doesn't support loops. Once it is introduced, I will publish an updated version.
Building a strategy out of this is straightforward (refer to my strategy explanation above), I strongly encourage new Pinescript coders to try to a plotarrow() based overlay indicator to get more familiar with Pine.
More info:
---------
The Volatility (Regime) Switch Indicator : traders.com
Complete list of my indicators:
-------------------------------------
docs.google.com
Vortex Indicator with Thresholds DefinedA problem I noticed with the built in Vortex indicator was that it didn't include any defined thresholds that are important to understanding how to read the vortex indicator. So I modified the vortex indicator in order to have the thresholds built in so you don't have to draw horizontal lines on your chart.

EMA Wave Indicator [LazyBear]This is a 3 EMA visualization tool. Relative momentum across 3 timeframes are rendered as A/B/C waves. Also, helpful in identifying spike/exhaustion bars.
When all the waves are in the same direction, the momentum is very high on that direction. I have made all options configurable, have fun tuning for your instrument :)
Complete list of all my indicators:
docs.google.com

Coral Trend Indicator [LazyBear]This is a famous trend indicator in MT4 platform. Is this better than other MA based trend systems? I will let you decide that :)
Supported modes:
- Trend mode: This is the default. Draws a trend line (like MA) and colors them based on the trend.
- Ribbon Mode: Shown at the bottom pane. No trend lines are drawn.
- OverlayMode: Bars are colored based on the current trend. Trend line is also displayed (default color=gray).
Complete list of all my indicators:
docs.google.com

Anchored Momentum [LazyBear]Anchored Momentum (AMOM), by Rudy Stefenel, is a modified momentum indicator to capture the relative momentum. AMOM uses SMA as the reference for deriving momentum, thereby anchoring it to that MA rather than "value of close n bars back".
Mr.Stefenel suggests using this like other oscillators -- crossing signal line, crossing zero, divergences.
For alerts, use "Momentum", "Signal" and "ZeroLine" plots.
Configurable options:
- Momentum Period: Default is 10.
- Signal Period: Default is 8.
- Smooth Momentum: Default is FALSE. If TRUE, enables EMA(close) to be used rather than "close".
- Smoothing Period: Default is 7. If momentum smoothing is enabled, this period is used.
- Show Histogram: Default is FALSE. This is not histogram per se (indicator - signal), but is used for highlighting the crosses. Check out the histogram pane below to see an example.
- Enable Barcolors: Default is FALSE. If enabled, colors the price data (bars/candles) using histogram color.
More info:
Anchored Momentum, Stocks & Commodities V16:2 (89-98)
Complete list of all my indicators:
docs.google.com

Market Direction Indicator [LazyBear]Market Direction Indicator (MDI), by Donald Lambert, is an extension of simple moving average cross over systems. Series of price cross over points are determined to derive MDI.
Note that the short/long lengths will differ between instruments. They need to be tuned properly.
I have added an option to specify a "cutoff" parameter. When MDI is in the cutoff zone (-/+ cutoff), bars are colored gray. Set this to zero to turn off cutoffs.
Other options:
- OverlayMode: Enable this to color bars. MDI values are not plotted. If unchecked, MDI default rendering mode is Histogram mode.
- ShowBelowZero: Plots the negative values below zero (Oscillator mode)
Use "MDI" and "ZeroLine" for setting up alerts. Make sure MDI is in OscillatorMode.
Master list of all my indicators:
docs.google.com

Variable Moving Average Bands [LazyBear]VMA Bands are ATR bands with VMA as its centre. For a description of options, refer to my VMA post:
I have moved VMA calculation in to a separate function. Feel free to use calc_vma() in your scripts. For more MA calculation function (KAMA, VIDYA and others), refer to my complete list of indicators below.
Wish you all a very prosperous New year. Hope these indicators make you all more money this year too :)
List of my other indicators:
- GDoc: docs.google.com
- Chart:

Variable Moving Average [LazyBear]Variable Moving Average, often abbreviated as VMA, is an Exponential Moving Average developed by Tushar S. Chande. VMA automatically adjusts its smoothing constant on the basis of Market Volatility.
Use this like other Moving Averages. I have added the following options that can be enabled via options page:
- Trend Direction Indication: Green = Up trend, Blue = Potential congestion, Red = down trend.
- Color bars based on Trend
More info:
www.thewizardtrader.com
List of my other indicators:
- GDoc: docs.google.com
- Chart:

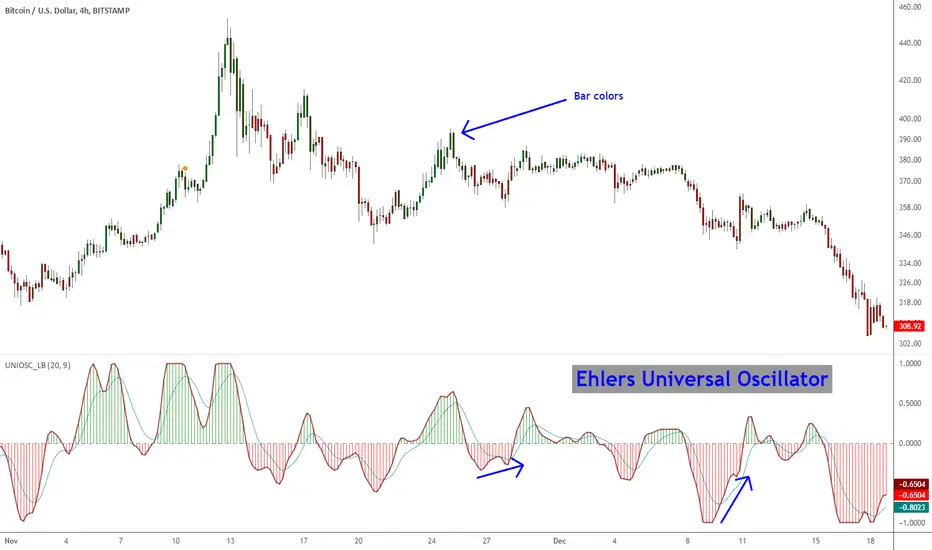
Ehlers Universal Oscillator [LazyBear]Universal Oscillator by Mr. Ehlers is an evolution of his SuperSmoother filter. The new indicator follows the swings in price without introducing extra delay.
It is controlled through one single input – the band edge – which basically is frequency. The smaller it is set, the less lag there is, but you may see lot of whipsaws. Built-in automatic gain control normalizes the output to vary between the range of -1 to +1.
Mr. Ehlers suggests a straightforward system:
- Buy when long-term Universal Oscillator crosses above zero
- Sell when long-term Universal Oscillator crosses below zero
I have added options to draw a signal line, histogram and bar coloring. Bar coloring, if enabled, is done using the histogram color, but you can change it easily to signal_cross by uncommenting a line (check the source).
More info:
Whiter is Brighter - Ehlers
List of my other indicators:
- GDoc: docs.google.com
- Chart:
Vervoort Heiken-Ashi LongTerm Candlestick Oscillator [LazyBear]HACOLT (Heikin Ashi Candles Oscillator Long Term) is a technical indicator designed by Sylvain Vervoort. It is based on Mr.Vervoort's other indicator, HACO (Heikin-Ashi Candles Oscillator - posted here: ).
Optimized for long-term trading, HACOLT shows three levels: -1, 0 and 1. These levels suggest "an open short position", "no open position", and "an open long position", respectively. Passing from a certain level to another is viewed as a trading signal:
- Rising from -1 or 0 to 1 suggests a Long Entry and Short exit;
- Falling from 1 to 0 or -1 suggests a Long Exit;
- Falling from 1 or 0 to -1 indicates a Short Entry.
Fits in nicely with any trading setup as a confirmation indicator
More info:
- tlc.thinkorswim.com
- www.motivewave.com
List of my other indicators:
- GDoc: docs.google.com
- Chart:

Vervoort Heiken Ashi Candlestick OscillatorHeiken-Ashi Candlestick Oscillator (HACO), by Sylvian Vervoort, is a digital oscillator version of the colored candlesticks.
Explanation from Vervoort:
"HACO is not meant to be an automatic trading system, so when there is a buy or sell signal from HACO, make sure it is confirmed by other TA techniques. HACO will certainly aid in signaling buy/sell opportunities and help you hold on to a trade, making it more profitable. The behavior of HACO is closely related to the level and speed of price change. It can be used on charts of any time frame ranging from intraday to monthly."
HACO has 2 configurable length parameters - "UP TEMA length" and "Down TEMA length". Vervoort suggests having them the same value.
I have also added an option to color the bars (overlay mode).
More info:
Trading with the Heiken-Ashi Candlestick Oscillator - Sylvian Vervoort
List of my other indicators:
- GDoc: docs.google.com
- Chart:

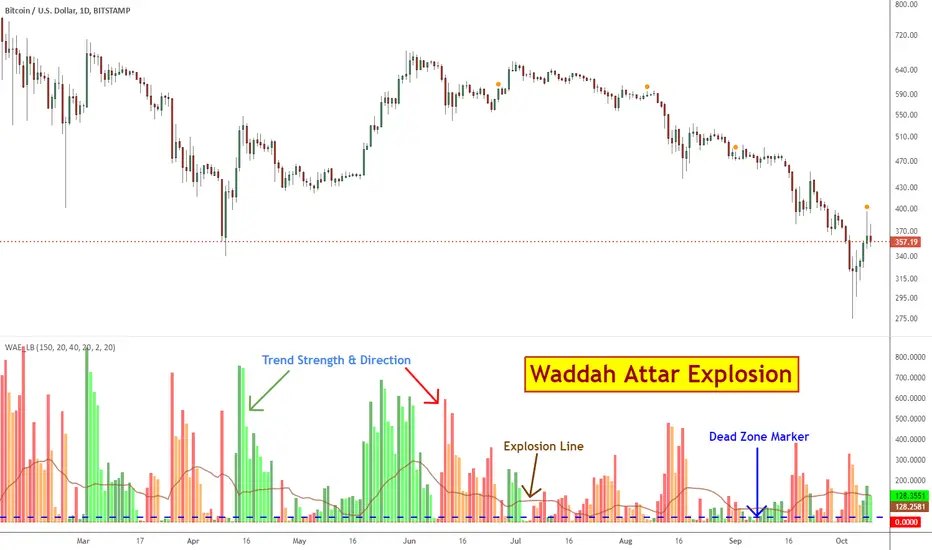
Waddah Attar Explosion [LazyBear]This is a port of a famous MT4 indicator, as requested by user @maximus71. This indicator uses MACD/BB to track trend direction and strength. Author suggests using this indicator on 30mins.
Explanation from the indicator developer:
"Various components of the indicator are:
Dead Zone Line: Works as a filter for weak signals. Do not trade when the red or green histogram is below it.
Histograms:
- Red histogram shows the current down trend.
- Green histogram shows the current up trend.
- Sienna line shows the explosion in price up or down.
Signal for ENTER_BUY: All the following conditions must be met.
- Green histo is raising.
- Green histo above Explosion line.
- Explosion line raising.
- Both green histo and Explosion line above DeadZone line.
Signal for EXIT_BUY: Exit when green histo crosses below Explosion line.
Signal for ENTER_SELL: All the following conditions must be met.
- Red histo is raising.
- Red histo above Explosion line.
- Explosion line raising.
- Both red histo and Explosion line above DeadZone line.
Signal for EXIT_SELL: Exit when red histo crosses below Explosion line. "
All of the parameters are configurable via options page. You may have to tune it for your instrument.
More info:
Author note: www.forex-tsd.com
Video (French): www.youtube.com
List of my other indicators:
- GDoc: docs.google.com
- Chart:
Elder's Market Thermometer [LazyBear]Market temperature, introduced by Dr.Alexander Elder, helps differentiate between sleepy, quiet and hot market periods.
Following is Mr.Elder's explanation on how to use this indicator (from his book "Come in to my Trading Room"):
"When markets are quiet, the adjacent bars tend to overlap. The consensus of value is well established, and the crowd does little buying or selling outside of yesterday’s range. When highs and lows exceed their previous day’s values, they do so only by small margins. Market Thermometer falls and its EMA slants down, indicating a sleepy market. When a market begins to run, either up or down, its daily bars start pushing outside of the previous ranges. The histogram of Market Thermometer grows taller and crosses above its EMA, which soon turns up, confirming the new trend."
"Market Thermometer gives four trading signals, based on the relationship between its histogram and its moving average:
1) The best time to enter new positions is when Market Thermometer falls below its moving average. When Market Thermometer falls below its EMA, it indicates that the market is quiet. If your system flashes an entry signal, try to enter when the market is cooler than usual. When Market Thermometer rises above its moving average, it warns that the market is hot and slippage more likely.
2) Exit positions when Market Thermometer rises to triple the height of its moving average. A spike of Market Thermometer indicates a runaway move. When the crowd feels jarred by a sudden piece of news and surges, it is a good time to take profits. Panics tend to be short-lived, offering a brief opportunity to cash in. If the EMA of Market Thermometer stands at 5 cents, but the Thermometer itself shoots up to 15 cents, take profits. Test these values for the market you are trading.
3) Get ready for an explosive move if the Thermometer stays below its moving average for five to seven trading days. Quiet markets put amateurs to sleep. They become careless and stop watching prices. Volatility and volume fall, and professionals get a chance to run away with the market. Explosive moves often erupt from periods of inactivity.
4) Market Thermometer can help you set a profit target for the next trading day. If you are a short-term trader and are long, add the value of today’s Thermometer EMA to yesterday’s high and place a sell order there. If you are short, subtract the value of the Thermometer’s EMA from yesterday’s low and place an order to cover at that level."
You can configure the "Explosive Move threshold" (default: 3), "Idle Market Threshold" (default: 7) and "Thermometer EMA length" (default: 22) via Options page.
More info:
"Come in to my Trading Room - A complete Guide to Trading" by Dr.Alexander Elder. (Page 162)
List of my other indicators:
- Chart:
- GDoc: docs.google.com

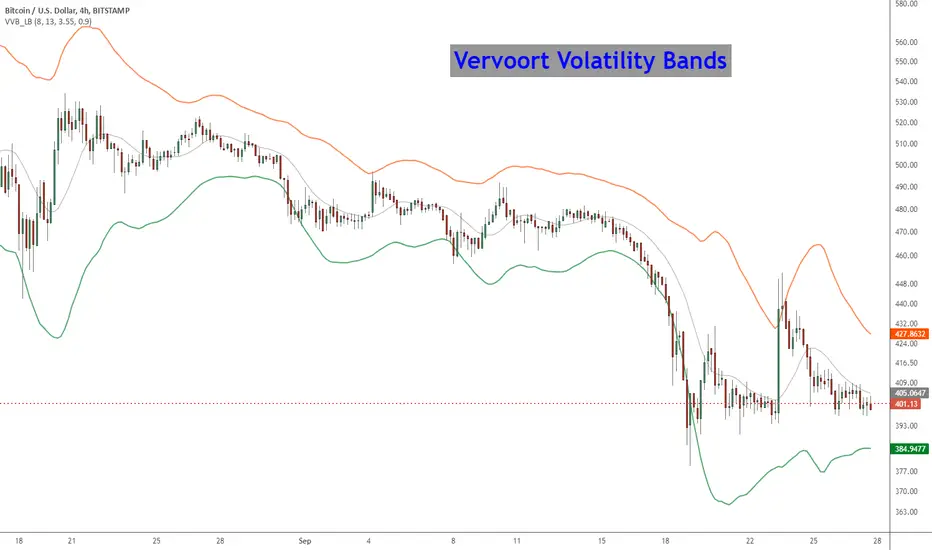
Vervoort Volatility Bands [LazyBear]This is Mr. Vervoort's take on volatility bands. Sticking to his style, he uses highly smoothed data everywhere, also improves on the way the bands are calculated. Is this better than others? I will let you guys decide :)
More info:
www.traders.com
List of my other indicators:
- Chart:
- GDoc: docs.google.com
Short-term Volume And Price Oscillator [LazyBear]Short-term Volume and Price Oscillator (SVAPO), developed by Sylvian Vervroot, combines both Price and Volume to construct an oscillator. In essence, when the price is trending up and volume is increasing, volume is added into the oscillator calculation. Conversely, when price is trending down and volume is increasing, volume will be subtracted from the oscillator. During consolidation phases when price and volume diverge, volume is not used to calculate the oscillator.
Some notes from his book:
- A buy is indicated when the oscillator is below the green line but greater than yesterday’s value.
A sell is indicated when the oscillator is above the red line but less than yesterday’s value.
- The start of a short term up move is signaled by SVAPO when it turns up from below the lower standard
deviation boundary. The same is valid for a short term down move when SVAPO turns down from above the
upper standard deviation boundary.
- Medium term turning points in an up or downtrend are mostly announced with a divergence between price and
SVAPO. In a medium term uptrend, SVAPO will generally continue to move above the 0-reference line.
More info:
stocata.org
stocata.org
Vervroot sometimes uses this with his modified %B oscillator ().
List of my other indicators:
- Chart:
- GDoc: docs.google.com

MACD Leader [LazyBear]Smoothing methods have lag, and since MACD makes use of moving averages, it usually lags behind price. You cannot eliminate lag completely, but one way of working around this is by adding a component of the price/MA difference back to MA. This technique is called Zero-lag (well, almost). "MACD Leader" makes use of this to form a leading signal to MACD.
First proposed by Giorgos E. Siligardos, "Leader" leads normal MACD, especially when significant trend changes are about to take place. This has the following features:
- It is similar to MACD in smoothness.
- It can be plotted along with MACD in the same window using the same scaling.
- It has the ability to lead MACD at critical situations
For detailed discussion on the various divergence patterns, refer to the PDF I have linked in the "More Info" below.
I have provided an option to plot MACD and MACD signal on the same pane. You can enable/disable them via options page.
For Pinescript coders: Try enabling histo on this to compare with normal MACD histo :)
More info:
drive.google.com
List of my other indicators:
- Chart:
- GDoc: docs.google.com

Vervoort Smoothed %b [LazyBear]As we know, %b is a measure of where prices are in relation to the outer Bollinger bands and therefore strongly related to volatility. This can get choppy, though.
Vervoort smoothed this using Zero lag TEMA of custom Heiken-ashi recalculated prices. According to Vervoort, "Smoothed Vervoort %b is often a leading indicator making smooth moves with clear turning points. Normal and hidden divergent moves make it an ideal tool to help find entry and exit points while watching price moving between the Bollinger bands."
More info:
drive.google.com
List of my other indicators:
- Chart:
- GDoc: docs.google.com

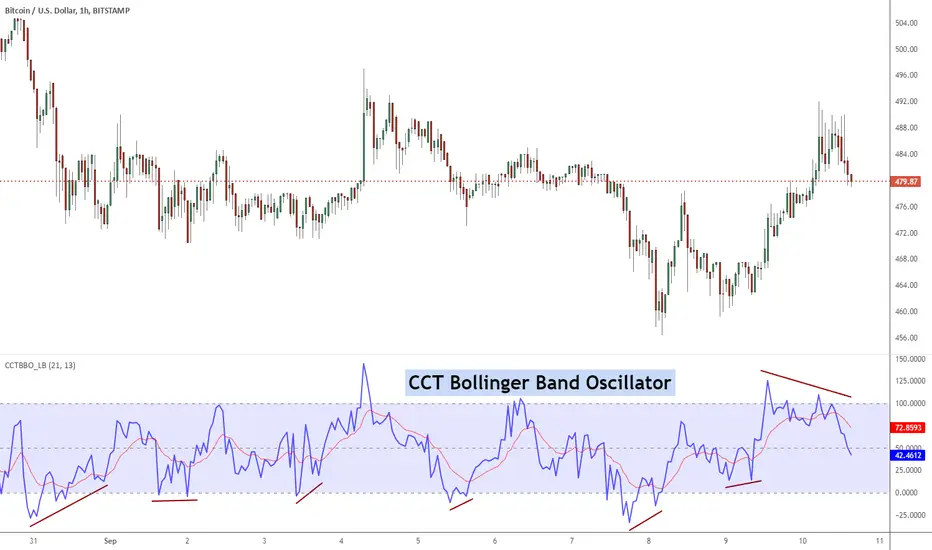
CCT Bollinger Band OscillatorThe CCT Bollinger Band Oscillator (CCTBO), developed by Steve Karnish of Cedar Creek Trading, reconfigures John Bollinger's classic Bollinger Bands (envelopes plotted at two Standard Deviations above and below a moving average) by drawing two parallel lines replacing the envelopes. The parallel lines represent a measurement of two Standard Deviations from the mean and are assigned a value of zero and 100 on the chart.
The indicator represents the price as it travels above and below the mean (50%) and outside the two standard deviations (zero and 100). Penetration of the upper band represents overbought conditions while penetration of the lower band signifies oversold conditions. Usage of the CCT Bollinger Band Oscillator to identify 'failure swings' and 'divergences' can lead to significant reversals.
List of my other indicators:
- Chart:
- GDoc: docs.google.com
Elastic Volume Weighted Moving Average & Envelope [LazyBear]Elastic Volume Weighted Moving Average (eVWMA) is a statistical measure using the volume to define the period of the moving average. The eVWMA can be looked at as an approximation to the average price paid per share. Multiplier is usually the number of shares, but it can be approximated using cumulative sum of volume (Enable it via "Use Cumulative Volume" option) or sum of volume over "n" periods.
I have also added an option to draw eVWMA envelope (eVWMA on HLC).
More info:
christian-fries.de
List of all my indicators:
- Chart:
- GDoc: docs.google.com

Earnings S/R Levels [LazyBear]These levels are based on price around earnings day. I have implemented support for 2 calculation modes:
Mode 1: Level = (low of 1 day prior to earnings + high of 1 day after earnings) / 2.0
Mode 2: Level = (hl2 of 1 day prior to earnings + hl2 of 1 day after earnings + close from earnings day) / 3.0
Chart above shows "Mode 1". Mode can be changed via options page.
This indicator was requested by user @mika2k1ff. I learnt more about this idea from @DanV and @TimWest (Thanks guys :)). BTW, TimWest has an indicators package, "Key Hidden Levels", that has this and more.
Do let me know how you use this, I am very intrigued by the potential this idea shows. Thanks.
For a complete list of my indicators:
- GDoc: docs.google.com
- Chart:

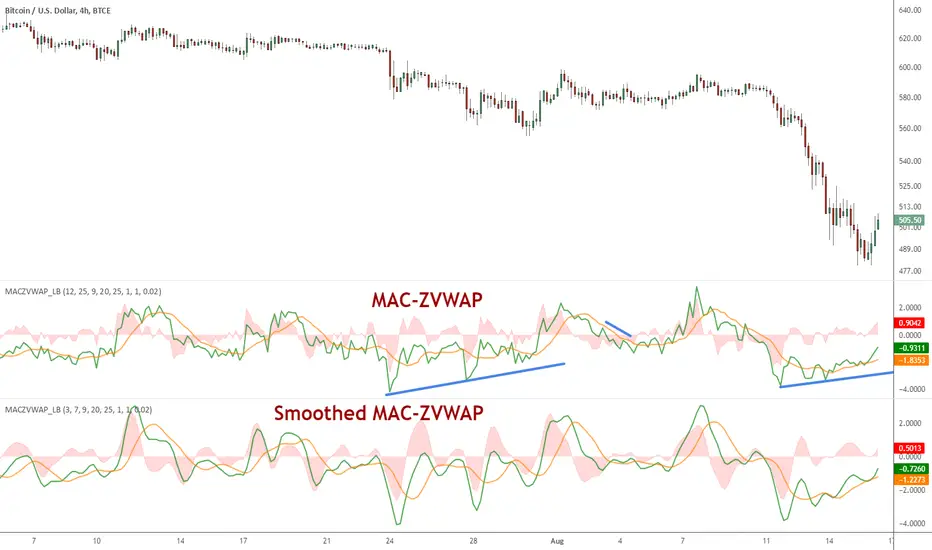
MAC-Z VWAP Indicator [LazyBear]This a modified MAC-Z using Z-VWAP. Since this uses VWAP, the signals are derived indirectly from both volume and price action.
I have also included a way to smooth MACZ-VWAP, you can enable it via options page.
Note that this will not work on any FX pair, as volume is not available.
Referenced indicators:
Z-distance from VWAP:
MAC-Z Indicator:
Z-Score:
Complete list of my indicators:
GDoc: docs.google.com
Chart:
Enhanced Index [LazyBear]The Enhanced Index (EIDX) is a modified William %R that behaves much like the original, to indicate overbought and oversold market conditions.
EIDX has the advantage of
- Reacting more quickly to changes in buying power.
- Predicting market turning points better than other oscillators. Divergences are more pronounced.
List of my other indicators:
